- Übersicht
- Bewertungen
- Diskussion
- Neue Funktionen
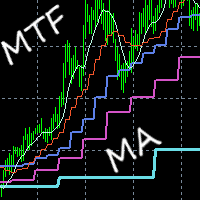
MTF Moving Trender
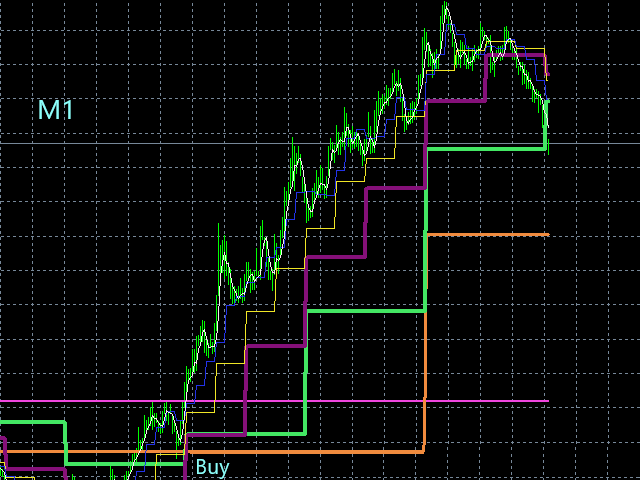
This indicator displays a modified version of Moving Averages for multiple time frames:
Current (TF indicator is attached to), M5, M15, M30, H1, H4, Daily, Weekly and Monthly.
NB: Make sure to download all time frames' history before testing and use.
No need to set up the indicator.
Features an audible alert function for the current chart's MA line.
How to use:
- Simply attach to any chart.
- Hover over the lines to see the line's time frame.
- Buy when more than two MTF lines cross closely together below the price.
- Sell when more than two MTF lines cross closely together above the price.
- Example: M5-M15-M30-H1
- Best results on Major pairs, but can also be used on other pairs.
Important to note:
- Please combine this indicator with your other tools for best results.
- Always test your strategy on a demo account before using a new indicator on a live account.
- You use this indicator at your own risk.
- Do not risk money you cannot afford to lose.
Empfohlene Produkte

SRP Pro Demo
60 USD Farhad Kia
Strong Retracement Points Pro demo edition! SRP (Strong Retracement/Reversal Points) is a powerful and unique support and resistance indicator. It displays the closest important levels which we expect the price retracement/reversal! If all level are broken from one side, it recalculates and draws new support and resistance levels, so the levels might be valid for several days depending on the market! If you are still hesitating to start using this wonderful tool, you can check this link to see h

ZhiBiCCI MT4
58 USD Qiuyang Zheng
[ZhiBiCCI] Indikatoren sind für alle Zyklusanwendungen und auch für alle Marktsorten geeignet.
[ZhiBiCCI] Die grüne durchgezogene Linie ist eine Umkehrung der bullischen Divergenz. Die grüne gestrichelte Linie ist eine klassische bullische Divergenz.
[ZhiBiCCI] Die durchgehende Linie zum Rot ist eine umgekehrte bearishe Divergenz. Die rote gepunktete Linie ist eine klassische bearishe Divergenz.
[ZhiBiCCI] kann in den Parametern (Alert, Mail senden, Benachrichtigung senden) eingestellt wer

MTF Stochastic
30 USD Sergey Deev
The indicator displays the data of the Stochastic oscillator from a higher timeframe on the chart. The main and signal lines are displayed in a separate window. The stepped response is not smoothed. The indicator is useful for practicing "manual" forex trading strategies, which use the data from several screens with different timeframes of a single symbol. The indicator uses the settings that are identical to the standard ones, and a drop-down list for selecting the timeframe.
Indicator Parame

Alpha Trend
35 USD Evgeny Belyaev
Alpha Trend is a trend indicator for the MetaTrader 4 platform; it has been developed by a group of professional traders. The Alpha Trend indicator finds the most probable tendency reversal points, which allows making trades at the very beginning of a trend. This indicator features notifications, which are generated whenever a new signal appears (alert, email, push-notification). This allows you to open a position in a timely manner. Alpha Trend does not redraw, which makes it possible to evalua

Wolfe waves ultra
30 USD Ruslan Pishun
Wolfe waves ultra draws Wolfe Waves automatically. The indicator searches for the Wolfe Waves on three timeframes. This indicator is especially accurate because it waits for a breakout in the wave direction before signaling the trade, resulting in a very high winning ratio.
Features Amazingly easy to trade. The indicator is able to recognize all Wolfe Wave patterns in a specified interval. Thus, we check each extremum for the potential 1,2,3,4,5 points apart from ZigZag vertices. The indicator

Pershikov Fibonacci Retracement
29.99 USD Alexander Afanasyev
The indicator plots 5 Fibonacci retracements according to recommendations about trend lifetime given by V.V. Pershikov. All lifetime parameters can be customized. Retracements are plotted at the moment of attaching the indicator to the chart and at the moment of scaling. It is made for increase in productivity. If the indicator re-plots on every tick, its operation will be slowed down due to abundance of calculations which come from check of 61.8 level breakthrough. Plotting can be changed manua

Th3Eng PipFinite signals
89 USD Ahmed Farag
The Th3Eng PipFinite indicator is based on a very excellent analysis of the right trend direction with perfect custom algorithms. It show the true direction and the best point to start trading. With StopLoss point and Three Take Profit points. Also it show the right pivot of the price and small points to order to replace the dynamic support and resistance channel, Which surrounds the price. And Finally it draws a very helpful Box on the left side on the chart includes (take profits and Stop loss

Super Gator
150 USD Agustinus Biotamalo Lumbantoruan
This indi shows the following 1. Supertrend 2. Alligator (Not a regular alligator)
3. ZigZag 4. Moving Average 5. Trend Continuation/Mini correction Signal (plotted in X) (See screenshots in green background color
6. Early Signal Detection (See screenshots in green background color)
You may treat Alligator as the lagging indicator
The leading indicator is the supertrend. The zig zag is based on the leading indicator where it gets plotted when the leading indicator got broken to the opposite.

The Sextet Scalper Pro
49 USD Naim El Hajj
The Sextet Scalper Pro is an MT4 indicator that gives signals when new waves are starting in a trend. The trends are calculated using the original " The Sextet " indicator method. You get a free EA to trade with The Sextet Scalper Pro: Free EA . Default settings were optimized on GBPUSD H1 from 2017.
EA could be tested on free demo version of The Sextet Scalper Pro, before purchase. Key Features: Uses The Sextet Trend Detection Method which is already a good strategy in itself for detecting l

MT4 Extreme Reversal H4
35 USD Andrei Gerasimenko
This is an Meta Trader 4 version of the indicator! This arrow indicator searches for possible market reversals and correction movements on timeframes H4 and D1 . It is based on Forex market regularities, accurate detection of current extremum and detection of candlestick patterns on market highs and lows. The universal algorithm helps identify reversal points and draws arrows indicating where to enter the market. The indicator is very easy to set up! Attach to the desired symbol chart and watch

Binary Option Signal
100 USD Yaroslav Varankin
Indicator for binary options arrow is easy to use and does not require configuration works on all currency pairs, cryptocurrencies buy signal blue up arrow sell signal red down arrow tips do not trade during news and 15-30 minutes before their release, as the market is too volatile and there is a lot of noise it is worth entering trades one or two candles from the current period (recommended for 1 candle) timeframe up to m 15 recommended money management fixed lot or fixed percentage of the depo

Harmonic Papallons
149 USD Ramon Sobrevals Arce
We have perfected this indicator to predict accurately the future market movements. Harmonic Papallons will give you the best price within a REVERSAL. Automatically scans the chart to find these Harmonic Patterns, and give you the chance to enter early in good operations. Also if selected, it will alert you in advance when future patterns appears. The main goal for this algorithm is to determine with high precision the moment when a trend ends and a new one begins. THE G LDEN TRADE, Th

PABT Pattern Indicator
110 USD Gleb Balashevich
PABT Pattern Indicator - it's classical system one of the signal patterns. Indicator logic - the Hi & Lo of the bar is fully within the range of the preceding bar, look to trade them as pullback in trend. In the way if indicator found PABT pattern it's drawing two lines and arrow what showing trend way. - First line - it's entry point and drawing at: 1. On the high of signal bar or on middle of the signal bar (depending from indicator mode) for buy; 2. On the low of signal bar or on middle of t

Chart Patterns Analyser
69 USD Sami Chebbi
Chart Patterns Detect 15 patterns (Ascending Triangle, Descending Triangle, Rising Wedge, Falling Wedge, Bullish Flag, Bearish Flag, Bullish Rectangle, Bearish Rectangle Symmetrical triangle, Head and Shoulders, Inverted Head and Shoulders, Triple top, Triple Bottom, Double Top, Double Bottom) Use historical data to calculate the probability of each pattern to succeed (possibility to filter notification according to the chance of success) gives graphic indication about the invalidation level and

Laser Trend
50 USD Nicolas Zouein
The trend is your friend! This is what this indicator is all about. Follow this famous saying and be safe.
Characteristics:
Buy/Sell signals fixed on the close of a bar. Works on all symbols and all timeframes. Clear visual market trend laser line, Buy/Sell signal arrows, market strength meter, TP1 & TP2 boxes. Visual signals when to enter, when to exit the market. No repainting. Compatible with Flexible EA for trading automation. (Ask for a free set file optimized to perform 2010-2018) Para

Harmonic 3Drives
30 USD Sergey Deev
The indicator detects and displays 3 Drives harmonic pattern (see the screenshot). The pattern is plotted by the extreme values of the ZigZag indicator (included in the resources, no need to install). After detecting the pattern, the indicator notifies of that by a pop-up window, a mobile notification and an email. The indicator highlights the process of the pattern formation and not just the complete pattern. In the former case, it is displayed in the contour triangles. After the pattern is com

Advanced Stochastic Scalper
34 USD Evgeny Belyaev
Advanced Stochastic Scalper - is a professional indicator based on the popular Stochastic Oscillator. Advanced Stochastic Scalper is an oscillator with dynamic overbought and oversold levels, while in the standard Stochastic Oscillator, these levels are static and do not change. This allows Advanced Stochastic Scalper to adapt to the ever-changing market. When a buy or a sell signal appears, an arrow is drawn on the chart and an alert is triggered allowing you to open a position in a timely mann

Trendiness Index
49 USD Libertas LLC
"The trend is your friend" is one of the best known sayings in investing, because capturing large trendy price movements can be extremely profitable. However, trading with the trend is often easier said than done, because many indicators are based on price reversals not trends. These aren't very effective at identifying trendy periods, or predicting whether trends will continue. We developed the Trendiness Index to help address this problem by indicating the strength and direction of price trend

BF Scalper PRO
137 USD Lachezar Krastev
-30% OFF LIMITED TIME OFFER! (regular price $197) BF Scalper PRO is the professional version of my very popular free EA - BF Scalper EA . I have implemented a lot of new additional features and systems in this PRO version in order to improve its overall performance . The improved exit logic reduces the drawdown and increases the efficiency of the system. In addition, the new ATR based Stop Loss calculating algorithm /as an option/ works excellent adapting the Stop Loss levels to the current mar

Alpha Trend Spotter Binary Option
30 USD Andy Ismail
This indicator is customized for binary option trading like M1 timeframe or turbo option trading. The way a binary option works is from the traders perspective is that you choose whether or not a certain underlying asset (a stock, commodity, currency etc.) is going to go up or down in a certain amount of time. You essentially bet money on this prediction. You are shown how much money up front you will earn if your prediction is correct. If your prediction is wrong, you lose your bet and the mone

Scalping Modulator
147 USD Andrey Kozak
Scalping Modulator is a scalping trading system. The indicator consists of several analytical modules. It automatically analyzes the market and shows the trader all the necessary information for trading. Scalping Modulator draws two trend lines on the chart. One line shows the long-term direction of the price, the second line shows the medium-term direction of the price. The indicator also draws red and blue dots on the chart. They indicate a likely change in price movement. In order to open a

Support and Resistance Levels on AZZD and EF
30 USD Sergey Efimenko
This is an MTF indicator of support and resistance levels based on Advanced ZigZag Dynamic and/or Extended Fractals indicator extremums with price labels (can be disabled). More higher TFs can be selected for MTF mode. By default, the levels are generated based on ZigZag indicator dots. Fractals indicator dots can also be used together with ZigZag or instead of it. In order to simplify the use and save CPU time, calculation is performed once per each bar at its opening. Parameters ForcedTF - cha

New Stochastic Oscillator
30 USD Leonid Basis
The Stochastic Oscillator is a momentum indicator that uses support and resistance levels. The term "stochastic" refers to the point of a current price in relation to its price range over a period of time. You can use a New Stochastic in the same way as classical one: Overbought and Oversold areas to make a Buy or Sell orders. This new indicator shows all variety of Fibonacci Levels (from 23.6 to 76.4) which can be used as Overbought and Oversold levels as well as points to close an open positio

Night Silence
30 USD Volodymyr Zubov
BESCHREIBUNG:
Die Theorie des Indikators besagt, dass Währungen, die in der europäischen Sitzung gehandelt werden, nachts schlafen. Und wenn sie aufwachen, gehen sie auf ihre eigene Weise zum goldenen Mittelwert von Fibonacci.
Nachts bildet sich ein Kanal, aus dem sie morgens mit neuer Kraft auf der Straße aussteigen wollen. Die obere Ebene des Kanals ist die Kaufzone.
Die untere Ebene des Kanals ist die Verkaufszone. Die Ziele der Wanderung sind oben und unten farbig markiert.
Der Indi

Insider Scalper Binary
103 USD Yaroslav Varankin
Insider Scalper Binary This tool is designed to trade binary options.
for short temporary spends. to make a deal is worth the moment of receiving the signal and only 1 candle if it is m1 then only for a minute and so in accordance with the timeframe.
the accuracy of this tool is about 80% ....
recommended currency pairs eur | usd, usd | jpy ....
the indicator is already configured, you just have to add it to the chart and trade ....

ZigZag Lines MTF
30 USD Taras Slobodyanik
Multitimeframe ZigZag indicator. It displays the support/resistance lines and their breakouts, as well as draws the current targets of the market. It can also display lines of the Fractals indicator and candles from other periods (up to Quarterly). The indicator redraws the last (current) point, and in some cases can change the last 2-3 points. This version is for MT4 only. All lines are drawn as objects ( not indicator buffers, but there is a possibility to receive the data for the EA ).
Wh

Trend Ray
59 USD Andriy Sydoruk
The indicator shows the potential trend direction by cyclical-wave dependence. Thus, all the rays of the intersection will be optimal rays, in the direction of which the price is expected to move, taking into account the indicator period. Rays can be used as a direction for potential market movement. But we must not forget that the approach must be comprehensive, the indicator signals require additional information to enter the market.

Moving Average Acceleration
30 USD DMITRII GRIDASOV
Forex Indicator MA Acceleration for MT4, No Repaint. MA Acceleration - is scalping indicator, designed as auxiliary indicator for MA SPEED (this is my another product) I offer you to upgrade your trading methods with new indicator for MT4: MA Acceleration (MA - moving average). The calculation of this indicator is based on equations from physics. It will show you the acceleration of moving average line. There are plenty of opportunities to upgrade even standard strategies with MA Acceleration.

Adaptive RSI
33 USD Rasoul Mojtahedzadeh
Relative Strength Index (RSI) is one of the most popular and accurate oscillators widely used by traders to capture overbought and oversold areas of price action. Although the RSI indicator works fine for a period of market, it fails to generate profitable signals when market condition changes, and hence produces wrong signals which results in big losses. Have you ever thought about an adaptive RSI indicator that adapts its period of calculation based on the market conditions? The presented indi
Käufer dieses Produkts erwarben auch

Entry Points Pro
125 USD Yury Orlov
This is a trend indicator for MT4 providing accurate signals to enter a trade without redrawing or delays.
It can be applied to any financial assets: forex, cryptocurrencies, metals, stocks, indices . The best results are on the timeframe M15+
Our Telegram group | MT5 version of the indicator
IMPORTANT! Contact me after your purchase to get the detailed guide and bonus. Video (6:22) - one signal that made a profit equal to triple the price of the indicator. Video (4:4

Advanced Supply Demand
148 USD Bernhard Schweigert
CURRENTLY 33% OFF !! Best Solution for any Newbie or Expert Trader! This indicator is a unique, high quality and affordable trading tool because we have incorporated a number of proprietary features and a new formula. With this update, you will be able to show double timeframe zones . You will not only be able to show a higher TF but to show both, the chart TF, PLUS the higher TF: SHOWING NESTED ZONES . All Supply Demand traders will love it. :) Important Information Revealed
Maximize th

Advanced Currency Strength28 Indicator
148 USD Bernhard Schweigert
CURRENTLY 26% OFF Best Solution for any Newbie or Expert Trader! This Indicator is a unique, high quality and affordable trading tool because we have incorporated a number of proprietary features and a new formula. With only ONE chart you can read Currency Strength for 28 Forex pairs! Imagine how your trading will improve because you are able to pinpoint the exact trigger point of a new trend or scalping opportunity? User manual: click here That's the first one, the original! Don't buy a worthle

PipFinite Breakout EDGE
98 USD Karlo Wilson Vendiola
The Missing Edge You Need To Catch Breakouts Like A Pro. Follow a step-by-step system that detects the most powerful breakouts!
Discover market patterns that generate massive rewards based on a proven and tested strategy.
Unlock Your Serious Edge
Get it here www.mql5.com/en/blogs/post/723208
Have access to the game changing indicator that will take your trading to the next level!
How To Trade
Execute your trades in 3 Easy Steps!
Step 1: Trade Setup Enter a signal if Success Rate is

Best Currency Strength Indicator
149 USD Tumelo Rakotsoane
Advanced Currency Strength Indicator
The Advanced Divergence Currency Strength Indicator. Not only it breaks down all 28 forex currency pairs and calculates the strength of individual currencies across all timeframes , but, You'll be analyzing the WHOLE forex market in 1 window (In just 1 minute) . This indicator is very powerful because it reveals the true movements of the market. It is highly recommended to analyze charts knowing the performance of individual currencies or the countries ec

VR Sync Charts
52 USD Vladimir Pastushak
VR Sync Charts is a program designed as an indicator for the MetaTrader trading terminal. The program solves the problem of synchronization of chart windows by drawing a trend line in one chart window. the program copies and synchronizes the line with another chart in the MetaTrader terminal. Syncing will occur regardless of which period is set in the other chart. In the picture below, you can see how the trader manages the trend line, and the program synchronizes the line in another chart. The

PipFinite Trend PRO
98 USD Karlo Wilson Vendiola
Breakthrough Solution For Trend Trading And Filtering With All Important Features Built Inside One Tool! Trend Pro's smart algorithm detects the trend, filters out market noise and gives entry signals with exit levels. The new features with enhanced rules for statistical calculation improved the overall performance of this indicator.
Important Information Revealed Maximize the potential of Trend Pro, please visit www.mql5.com/en/blogs/post/713938 Test the demo version and explore its feature

FX Volume
75 USD Daniel Stein
You want to become a constantly profitable 5-star forex trader? 1. Read the basic description of our simple trading system & and it's major strategy update in 2020 2. Send a screenshot of your purchase to get your personal invitation to our exclusive trading chat
Following the smart money is finally possible! FX Volume is the FIRST and ONLY volume indicator that provides a REAL insight into the market sentiment from a broker's point of view. It provides awesome insights into how ins

Bermaui Deviation Percent
50 USD Muhammad Elbermawi
Or ( BD% ) which is a volatility index that measures volatility in percent rather than points. The idea of BD% is to make an index depending on the Classic Standard Deviation (CSD) that moves between 0 and 100 percent.
You can use BD% to compare volatility for the same security in different time periods or different time-frames. In addition, you can use BD% to compare volatility between different securities in different markets in terms of percent rather than points.
The idea behind th

FX Power
75 USD Daniel Stein
️️️️️ You want to become a constantly profitable 5-star forex trader? ️️️️️ 1. Read the basic description of our simple trading system & and it's major strategy update in 2020 2. Send a screenshot of your purchase to get your personal invitation to our exclusive trading chat
FX Power is the first currency strength meter with a complete history across all time frames.
It analyzes the momentum and strength of all major currencies to determine high probability trades. Key Fe

Nasdaq100 Power Indicator
149 USD Teboho Edgar Rakotsoane
The NASDAQ 100 Power Indicator serves with TREND and trend reversals indication using automated arrows that indicates buy or sell at that price and has built-in signal provider across all time frames with alerts and provides also the automated support and resistance that can draw technical analysis patterns like double bottom, double top, head and shoulders etc using closing and open prices, in assistance for if a trader did not see the pattern sooner for their technical analysis. The indicator

Infinity TrendLine PRO
120 USD Evgenii Aksenov
PROMO: Buy Trend Line PRO today and contact me to get for free:
1) User's Manual about the indicator and built in pop-up Scanner 2) Settings files for Bitcoin, GOLD, EURUSD, GBPUSD 3) HTF Histogram (basement indicator) which shows Higher TimeFrame trend in the bottom of chart Contact me after purchased to receive useful files: profitcamp@mail.ru
TrendLine PRO indicator is based on the analysis of the strength of bulls and bears. TrendLine PRO never repaint and does not change the

Advanced Currency IMPULSE with ALERT
78 USD Bernhard Schweigert
CURRENTLY 39% OFF !! Best Solution for any Newbie or Expert Trader! This indicator is a unique, high quality and affordable trading tool because we have incorporated a number of proprietary features and a secret formula. With only ONE chart it gives Alerts for all 28 currency pairs . Imagine how your trading will improve because you are able to pinpoint the exact trigger point of a new trend or scalping opportunity! Built on new underlying algorithms it makes it even easier to identify an

True Direction Oscillator
60 USD Muhammad Elbermawi
Or (TDO) which is an index that measures the price rate of change using the principle of " Pure Momentum ".
When a security price advances from 10 to 15 then the price rate of change is 150% but when it declines back from 15 to 10 then price rate of change is 33.3% only. That is why technical analysis indicators like "Price Rate of Change" (ROC) or "Momentum" gives higher readings for ascending price movements than that given to descending ones. TDO fixes this problem to help traders at

Buy Sell zones x2
99 USD Andrii Malakhov
Индикатор "Buy Sell zones x2" основан на принципе "остановка/разворот после сильного движения". Поэтому, как только обнаруживается сильное безоткатное движение, сразу после остановки - рисуется зона покупок/продаж. Зоны отрабатывают красиво. Или цена ретестит зону и улетает в космос, или пробивает зону насквозь и зона отрабатывается с другой стороны так же красиво. Работает на всех таймфреймах.
Лучше всего выглядит и отрабатывает на Н1.
Может использоваться как: индикатор зон, где лучше

Heiken Ashi Scanner
50 USD Philip Pankaj
Heikin-Ashi charts , developed by Munehisa Homma in the 1700s. Munehisa Honma was a rice merchant from Sakata, Japan who traded in the Dojima Rice market in Osaka during the Tokugawa Shogunate. He is considered to be the father of the candlestick chart. Th e man who invented the use of candlestick charts for finding and profiting from chart patterns.He was a billionaire trader on those days if we compared his net-worth with todays dollar . Heikin Ashi Scanner is an Multi-Currency and Multi

TMA Currency Meter
59 USD Paul Geirnaerdt
TMA Currency Meter is the ultimate currency meter. Based on the Triangular Moving Average of all available symbols, this indicator shows which currencies are strong, strengthening, weak or weakening. Experienced as well as novice traders will see the strong and weak currencies in the blink of an eye, and know which trade possibilities to explore further. TMA Currency Meter is a true Multi Timeframe indicator. It is easy to show the currency strengths for a higher timeframe than the chart timefra

Trading Chaos Map
125 USD Andrey Sinegovskiy
For those who studies Bill Williams' books "New Trading Dimensions" and "Trading Chaos (Second Edition)" and tries trading using these methods, it becomes evident that the standard set of indicators is not sufficient for full-fledged work. The Trading Chaos Map indicator draws the "market map", thus allowing you to the charts the same way as the author of the trilogy. Parameters provide options for enabling and disabling each signal. You can use any of the methods, or use them in conjunction. Yo

VR Small Chart
59 USD Vladimir Pastushak
The indicator displays a separate mini chart in a working window similar to МТ5 mini charts. You can expand/collapse the chart, change the chart symbol, period, as well as time and price scales. The app works in the strategy tester and you can switch the period of a mini chart.
Settings Select symbols - All Symbols: all symbols provided by a broker, Only market watch: only the symbols present in the Market Watch Prefix - two letters for distinguishing between a few indicator copies (if more th

Best And Worst Dashboard
100 USD Chantal Sala
Best and worst Dashboard was born from the idea to have a panel that includes all the symbols in a chart. It is very importance to understand which symbols are both positive and negative. In the past, we realized the single indicator Best and Worst ( https://www.mql5.com/en/market/product/11784 ), now thanks to the upgrading of the Metatrader the dashboard displays all the instruments simultaneously. A great revolution. This Dashboard is able to calculate performance at any time frame and clicki

TickUnit Scalper Currency Strength28 PRO
148 USD Bernhard Schweigert
CURRENTLY 26% OFF !! This indicator is a super combination of both our main indicators ( Advanced Currency Strength 28 and Advanced Currency IMPULSE with ALERT ). It shows Currency Strength values for TICK-UNITS and alert signals for 28 Forex pairs. 11 different Tick-Units can be used. Those are 1, 2, 3, 4, 5, 6, 10, 12, 15, 20, and 30 Seconds. The Tick-Unit bar in the sub-window will be shown and shifted to the left when there is at least 1 tick within the second’s timer. With only ONE

Advanced Dashboard for Currency Strength and Speed
199 USD Bernhard Schweigert
CURRENTLY 20% OFF !! Best Solution for any Newbie or Expert Trader! This dashboard software is working on 28 currency pairs. It is based on 2 of our main indicators (Advanced Currency Strength 28 and Advanced Currency Impulse). It gives a great overview of the entire Forex market. It shows Advanced Currency Strength values, currency speed of movement and signals for 28 Forex pairs in all (9) timeframes. Imagine how your trading will improve when you can watch the entire market using a sin

Blahtech Supply Demand
124 USD Blahtech Limited
Supply Demand uses previous price action to identify potential imbalances between buyers and sellers. The key is to identify the better odds zones, not just the untouched ones. Blahtech Supply Demand indicator delivers functionality previously unavailable on any trading platform. This 4-in-1 indicator not only highlights the higher probability zones using a multi-criteria strength engine, but also combines it with multi-timeframe trend analysis, previously confirmed swings and engulfing detector

Lighthouse
75 USD Daniel Stein
You want to become a constantly profitable 5-star forex trader? 1. Read the basic description of our simple trading system & and it's major strategy update in 2020 2. Send a screenshot of your purchase to get your personal invitation to our exclusive trading chat
Lighthouse is an amazing precise and reliable support and resistance indicator.
It displays the most important trading levels and draws them according to their relevance.
If a level is clearly broken, it changes its rol

FX Trend
75 USD Daniel Stein
️️️️️ You want to become a constantly profitable 5-star forex trader? ️️️️️ 1. Read the basic description of our simple trading system & and it's major strategy update in 2020 2. Send a screenshot of your purchase to get your personal invitation to our exclusive trading chat
FX Trend displays the trend direction, duration, intensity and the resulting trend rating for all time frames in real time.
You'll see at a glance at which direction the trends are running, how long

TPA True Price Action MT4 Indicator
168 USD InvestSoft
Der Forex TPA Indikator deckt die wahren Aktionen der Marktmacher auf, immer dann wenn sie passieren. "Kämpfe nicht gegen die Marktmacher an, sondern folge ihnen", ist wohl der beste Rat, den ein Trader bekommen kann. Der TPA Indikator zeigt jedesmal seine Signale an wenn die Bullen definitiv stärker sind als die Bären und umgekehrt. Dieser Indikator wurde VON Tradern FÜR Trader gemacht und ist 100% NICHT NACHZEICHNEND! Signale werden STRENG am Schluss einer Kerze generiert . Das sagen unsere

Bermaui Pin Bars
50 USD Muhammad Elbermawi
Bermaui Pin Bars
Or (BPB) is an indicator that find Pin Bars price action pattern on the chart. Pin Bars is a shortcut for "Pinocchio Bars" which is a classic bar pattern alternative to Japanese candlesticks with tall upper or lower shadows and very small bodies like Hammer, Inverted-Hammer, Hanging Man, Shooting Star, Dragon Fly Doji or Grave Stone Doji. Bermaui Pin Bars indicator find this pattern depending on a formula that can be explained in the next steps:
At first BPB calculate the

Naked Forex Kangaroo Tail
147 USD Renaud Candel
Kangaroo Tail Indicator is a pattern recognition indicator for Forex, Stocks, Indices, Commodities, Metals, Cryptos. The Kangaroo Tail is a simple and very effective pattern to trade. The strategy that comes with the Kangaroo Tail is purely based on price action. Inputs of the indicator are : Distance: distance in pixel relative to top or bottom of candle to display the arrow symbol MaxBars: number of bars back used to calculate the indicator TradeDirection (Long/Short/LongAndShort): filter sign

Bermaui Bands
50 USD Muhammad Elbermawi
Bermaui Bands (BB) is a technical analysis tool that helps filter between ranging and trending price movements. The idea behind this indicator can be explained in the next steps: Calculate Standard Deviation as an oscillator that moves between 0 and 100. I will name it Bermaui Deviation percent (BD %). If "BD %" is near zero then volatility is at its extreme. In addition, if "BD %" is near 100 then volatility is very low. High volatility means a great probability for a trending market, whi

Semafor 3LZZ Scanner Dashboard
60 USD Abir Pathak
3 Level ZZ Semafor Scanner:
This is a Dashboard indicator which uses 3LZZ Indicator in the background to find semafors. It will give priority to the semafors3 because they specify a strong signal. You can go through this video tutorial to see how it works: https://youtu.be/Z4v4h8U6RiM Get all extra Indicators/Template from here: https://abiroid.com/extras/semafor-3lzz-scanner-dashboard
To use this template just specify "3LZZ" in Dashboard Property: "Use Template For New Window" (without the
Weitere Produkte dieses Autors

Accurate Arrows
49 USD Natasha Diedericks
Accurate Arrows will help you trade your strategy more confidently. Uses a special algorithm to plot the arrows. Perfect for channel trading. Features: Alert functions. MALinePeriod for MA line. (Change to your preference.) How to use: Simply attach to any chart. Blue Arrows and blue MA line cross below price for buy entries. Red Arrows and red MA line cross above price for sell entries. Best results when checking two or more time frames before entering trades.
Use as you see fit for your strat

Turning Point Ticks
49 USD Natasha Diedericks
This indicator is shown in a separate window and ticks off the movement of the price.
Great when looking for new trading opportunities when the oversold or overbought zones are reached, and there are clear signs of the ticks turning the opposite direction. Uses a special algorithm to plot the ticks. Features alert functions.
Parameter TrendPeriod for the user to change. How to use: Simply attach to any chart. When the ticks reach the upper or lower extreme of the indicator window, the price is

Trend Tracker Helper
49 USD Natasha Diedericks
Easily track how the price moves in a separate indicator window with this trend indicator. Great for scalping or long-term trading. Helps you find best entry points for your trades after reaching a certain level, and easily identify where you can exit your trades. This indicator can be used on all time frames and pairs. Features alert function.
No need to set up the indicator.
How to use: Simply attach to any chart. NB : Look to the extreme zones (oversold/overbought) when looking for new tra

Masar
39 USD Natasha Diedericks
Your friend when it comes to identifying strong trends. Takes input from the Parabolic Sar (PSar). Helps you find best entry points for your trades after reaching a certain level, and easily identify where you can exit/re-enter your trades. Features alert function.
No need to set up the indicator.
How to use: Simply attach to any chart. When the blue line crosses below the red line and blue arrow appears, buy. When the red line crosses above the blue line and red arrow appears, sell. Best res

Top Bottom Protruder
39 USD Natasha Diedericks
Gives an early warning visual for new trading opportunities when the line extends outward at the upper or lower extremes (oversold/overbought) zones of the indicator window, and clear signs of a peak or trough is forming when the line becomes angled. (3rd and 4th pics below) Features alert function.
Can be used on all time frames. No need to set up the indicator.
How to use: Simply attach to any chart. When the blue line stops below the red line, and the red line protrudes/extends out, it sig

Accurate Arrows Trend Helper
30 USD Natasha Diedericks
A helper in identifying trend direction. Best results in channels when trading from oversold/overbought levels. Alert functions. Parameter TrendPeriod for the user to change. How to use: Simply attach to any chart.
Blue Arrows for buy entries. Red Arrows for sell entries. Best results when checking two or more time frames before entering trades.
Best results on Major Pairs, but can also be used on other pairs.
Important to note: Please do not use this indicator on its own, but combine it int

SR Channel
39 USD Natasha Diedericks
This channel takes input from Support and Resistance levels, combined with a special trend algorithm. Great for scalping or long-term trading. Features alert function.
Parameter TrendPeriod. (Change to your preference) How to use: Simply attach to any chart with default settings. When the blue SR line is below the price, buy. When the blue SR line is above the price, sell. Best results when looking at two or more time frames before entering trades. Best results on Major Pairs, but can also be u

Parabolic Sar Line Alert
39 USD Natasha Diedericks
This indicator is great when looking for strong trends. Takes input from the Parabolic Sar.
You get alerted on the trend direction while the price moves. Perfect for channels. No need to set up the indicator. How to use: Simply attach to any chart.
When the blue line crosses below the price and blue arrow appears, buy.
When the red line crosses above the price and red arrow appears, sell. B est results when checking two or more time frames. (See trade setup example in comment #1) Best results

Trend Tracker SR Channel
49 USD Natasha Diedericks
Easily track how the price moves in this trend channel, while trading between Support and Resistance lines. Features alert function.
Input parameter TrendLinePeriod for user to change.
How to use: Simply attach to any chart. When blue SR line, trend line below price and blue dot, buy. When blue SR line, trend line above price and yellow dot, Sell. See below pictures. Best results when checking two or more time frames. Use as you see fit for your strategy. Best results on Major Pairs, but can

ProSar
59 USD Natasha Diedericks
Displayed in a separate indicator window to easily identify where the price is heading. Uses a special trend algorithm to plot the lines. Features alert function. Parameter MAPeriod for the trend line. Change to your preference.
How to use: Simply attach to any chart with default settings. Sell on Red Arrow, Red Line, and Yellow MA line crosses above Red line. Buy on Blue Arrow, Blue Line, and Aqua MA line crosses below Blue line. Best results when taking higher time frames into consideration

BB Trender
49 USD Natasha Diedericks
The algorithm used in this indicator takes input from the Moving Average and Bollinger Bands indicators. Features alert function. Parameters: MAPeriodTrendLine BBPeriod BBDeviations BandShift Shift MAPeriodCrossForArrows
How to use: Simply attach to any chart with default settings. Buy on Blue Arrow after confirming MA trend line (light blue) crossing below price, and position of price within BB. Sell on Red Arrow after confirming MA trend line (orange) crossing above price, and position of p

Envelope Sniper
39 USD Natasha Diedericks
The algorithm used in this indicator takes input from the Envelopes indicator. Displayed in a separate indicator window to help you identify where the price is heading. Features alert function. Parameters: MAPeriodOnCrossForArrows MAPeriodOnCrossForTrendLine
Alerts EnvelopePeriod Deviation
How to use: Simply attach to any chart with default settings. Recommended for H1 and above. It's good to have the audible alerts on when using this indicator. Buy on Blue Arrow, with aqua envelope and blue

MA Cross Arrows
39 USD Natasha Diedericks
This indicator gives you Arrows on crossings of the Moving Average above/below the price. It also gives you an MA line that can be set separately. Parameters: MAPeriodForLine (Change to your preference). MAPeriodForArrow (C hange to your preference). Alerts. How to use: Simply attach to any chart. Default settings recommended but can be changed. You can set the MA line to a higher period than the Arrows for more effective trading. Use as you see fit for your strategy. Blue Arrow and Blue MA line

Trend Radar Chart Tracker
39 USD Natasha Diedericks
Easily track and trade with the trend using this indicator. Uses a circle and line to indicate the trend direction. Excellent for channels. Features alert function.
Parameter TrendPeriod can be changed to your preference. How to use: Simply attach to any chart. Blue circle plus blue line cross below price = Buy. Red circle plus red line cross above price = Sell. Best results when taking higher time frames into consideration before entering a trade. (Hint: Wait for the radar/circle to appear on

Envelopes and MA Chart
49 USD Natasha Diedericks
This indicator takes input from the Envelopes indicator. Great for determining trend direction. Parameters: Alerts Envelopes Period Deviation MA Period for MA line (Change to your preference)
How to use: Simply attach to any chart with default settings, or change to your preference. Recommended for H1 and above. Buy when blue envelope and blue MA line cross below the price. Sell when red envelope and red MA line cross above the price. Best results when taking higher time frames into considerat

High Low Arrows
49 USD Natasha Diedericks
Gives you a trend visual of peaks and troughs, making it easier to determine where the price is heading, and easier to identify tops/highs and bottoms/lows, when the chart is zoomed out completely. Uses a special trend algorithm to determine trend change, and plots arrows to indicate the direction change. Features alert function.
No need to set up the indicator.
How to use: Simply attach to any chart. Sell on yellow arrow. Buy on aqua arrow. Best results when checking the higher time frames b

Radar High Low
49 USD Natasha Diedericks
Combines the ZigZag indicator with a Trend filter to help identify highs and lows. Uses a special trend algorithm to determine trend change, and plots circles to indicate the direction change. Features alert function.
No need to set up the indicator.
How to use: Simply attach to any chart. Sell on red circle. Buy on blue circle. Best results when checking the higher time frames as well, i.e., radars appear on the current and higher 2 time frames. E.g., for a buy, look for blue circle to appea

ZigZag Bullets
49 USD Natasha Diedericks
This indicator takes input from the ZigZag and ADX indicators, combined with a special trend algorithm. You also get a Moving Average on the chart to determine trend direction. Great for scalping. Perfect for channels. Features alert functions.
Parameter TrendLinePeriod for the MA line. Change to your preference.
How to use: Simply attach to any chart. Sell on red bullets, with red MA line above price. Enter on bullets closest to this line. Buy on blue bullets, with blue MA line below price.

Trend Alligator
49 USD Natasha Diedericks
This indicator takes input from the Alligator indicator. Great for scalping or long-term trading. (See comment #1 for trade setup example) Great for identifying new trends. This indicator can be used on all time frames and pairs. Features alert functions.
Parameters: Alerts JawsPeriod JawsShift TeethPeriod TeethShift LipsPeriod LipsShift
How to use: Simply attach to any chart with default settings. Sell when all 3 red lines cross above white line. Buy when all 3 blue lines cross below white l

Trend SR
69 USD Natasha Diedericks
This indicator takes input from Support and Resistance levels, combined with a special trend filter. Easily spot tops and bottoms, and trade with more confidence. Great for scalping or long-term trading. This indicator can be used on all time frames and pairs. Features alert function.
No need to set up the indicator.
How to use: Simply attach to any chart. Red histogram line color = Selling opportunities. Blue histogram line color = Buying opportunities. See pictures below. To spot highs/tops

SRT Channel
69 USD Natasha Diedericks
This channel is displayed in a separate indicator window with a histogram to easily keep track of price movements. Uses a special algorithm to plot the channel and histogram lines. Can be used on all time frames and pairs. Features alert function.
No need to set up the indicator.
How to use: Simply attach to any chart. Red histogram line and red channel line = Sell Blue histogram line color and blue channel line = Buy See pictures below. Best results when checking the higher time frames as w

Trendy AO
39 USD Natasha Diedericks
This indicator combines the Awesome Oscillator and a special trend algorithm. Can be used on all time frames and pairs. Features alert function.
No need to set up the indicator.
How to use: Simply attach to any chart. Red color = Sell Blue color = Buy Best results when opening buys just above the zero line and sells just below the zero line. Best results when checking the higher time frames as well. Use as you see fit for your strategy. Best results on Major Pairs, but can also be used on ot

Sniper Line
39 USD Natasha Diedericks
This line uses a special algorithm to track price movement and plots bullets to indicate direction change. Great for scalping or long-term trading. Features alert function.
Parameter TrendPeriod.
How to use: Simply attach to any chart with default settings. Sell on red bullets. Buy on blue bullets. Best results when checking the higher time frames before entering trades, i.e., bullets appear on the current and higher 2 time frames. E.g., for a sell, look for red bullets to appear on H1,

Trend Outliner
39 USD Natasha Diedericks
This indicator uses a special trend algorithm to track and determine trend direction. Features: - White outliner line to track price movement. - Helps you identify new trends with red and blue histogram color. - Helps you identify highs/tops and lows/bottoms when chart is zoomed out completely. - Great for scalping or long-term trading. - Can be used on all time frames and pairs. - Features alert functions.
- No need to set up the indicator.
How to use: Simply attach to any chart. Sell on red

SR Arrows
49 USD Natasha Diedericks
This indicator gives you arrows, two SR lines and a white trend line. Uses a special trend algorithm to plot the arrows, combined with support and resistance inputs. Perfect for channel trading. Features alert functions.
Parameter TrendArrowPeriod. (<=12 recommended) Parameter TrendLinePeriod. (Change to your preference) How to use: Simply attach to any chart with default settings. Zoom in the chart, to see the two blue SR lines and arrows more clearly. It is very important to wait for a new bl

Trend Line Pro
59 USD Natasha Diedericks
This line uses a special algorithm to track the trend and plots a white price following line, as well as a trend line that crosses below and above the white line, to indicate direction change. Great for scalping or long-term trading. This indicator can be used on all time frames and pairs. Features alert function.
Parameter TrendPeriod. (Change to your preference)
How to use: Simply attach to any chart with default settings. Sell when red line crosses above white price following line. Buy whe

Three Moving Trender
39 USD Natasha Diedericks
This indicator gives you a modified version of three Moving Averages. Features: Alert functions Period1 Period2 Period3 How to use: Simply attach to any chart with default settings. Buy when the three lines cross below the price. Sell when the three lines cross above the price. Best results when looking at two or more time frames, and the three lines have just started out below or above the price, crossing together closely.
Use as you see fit for your strategy. Best results on Major pairs, but

ZigZag Sniper
39 USD Natasha Diedericks
This indicator gives you a modified ZigZag, combined with a special algorithm. Great for scalping. Perfect for channel trading. Parameter TrendPeriod. Features alert functions. How to use: Simply attach to any chart with default settings. Buy when the line crosses below the price. Sell when the line crosses above the price. It helps to keep the audible alert set to true. Best results when checking two or more timeframes before entering trades. (See comment #1 for example MTF trade setup) Use as

Moving Line Alert
30 USD Natasha Diedericks
This indicator is great when looking for scalping or long-term opportunities. The lines will help you keep track of price movement. You also get alerted. Great for channels and trading from oversold/overbought zones.
Use as you see fit for your strategy. If you use this indicator on its own, make sure to check the higher time frames for trend direction before entering trades. You can change the TrendPeriod parameter to your liking. When the blue line extends out below the price, buy. When the

MA with PSar Crossings
39 USD Natasha Diedericks
This indicator gives you PSar crossings in the form of blue and yellow dots on the chart, as well as a Moving Average. Parameters: MAPeriod (Change to your preference) Alerts PSarStep PSarMaximum How to use: Simply attach to any chart with default settings. Sell on yellow dots, with white MA line above price. Buy on blue dots, with white MA line below price. Best results when checking the higher time frames before entering trade. Best results on Major Pairs, but can also be used on other pairs.
Auswahl:
Keine Bewertungen
Version 1.4
2021.03.22
Input Signal Update.
Version 1.3
2021.01.15
Indicator updated.
Version 1.2
2021.01.12
M30 added as higher TF.
Line enhancements.
Indicator performance update.
Line enhancements.
Indicator performance update.
Version 1.1
2021.01.12
Audible Alert added for the current chart's trend line.