MACDmaxmin
- Indicadores
- Carlos Andrés Moya Erazo
- Versión: 1.10
- Actualizado: 9 marzo 2022
- Activaciones: 20
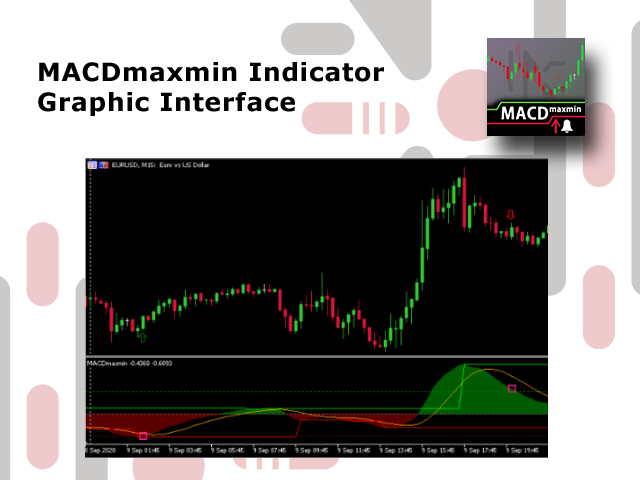
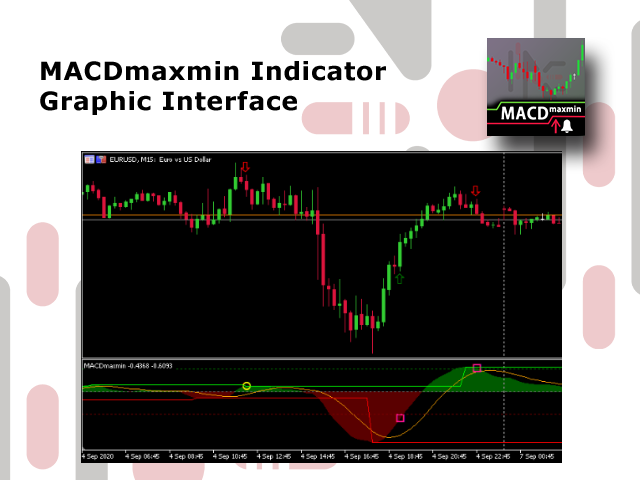
El indicador muestra cuando hay sobreprecios y divergencias sobre un MACD normalizado
Además, muestra señales con alertas configurables, niveles de sobreprecios dinámicos autorregulados y una configuración e interfaz simple
El indicador que calcula automáticamente los rangos de sobreprecio!
MACDmaxmin es un indicador basado en el oscilador MACD que identifica de manera efectiva cambios de tendencias en el precio, ya que es un indicador de momentum que captura la tendencia y muestra la relación entre dos medias móviles del precio.
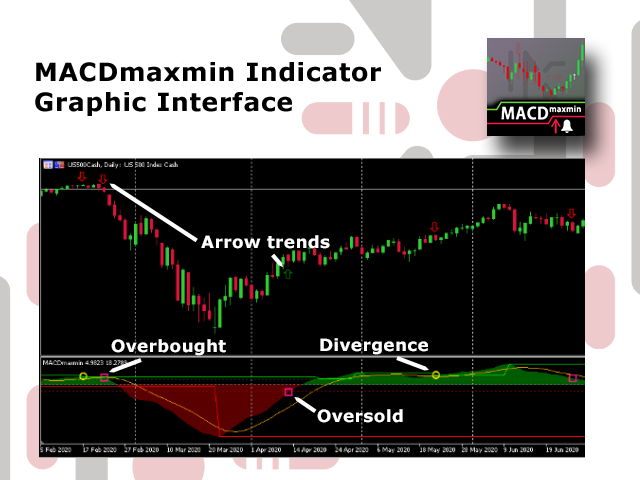
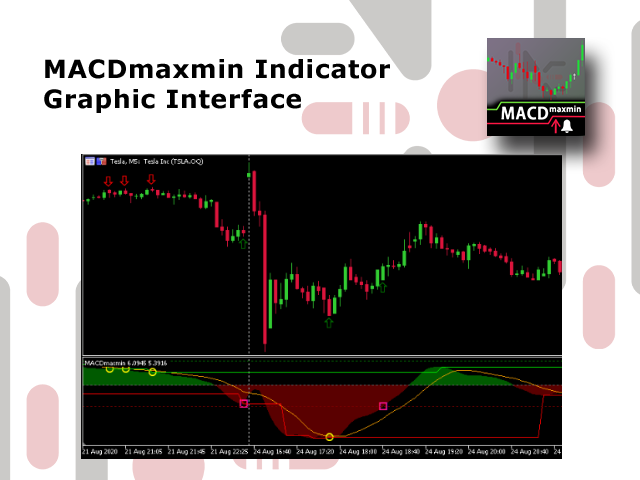
MACDmaxmin proporciona valiosa información de mercado y señales de sobreprecios, y divergencias que detecta automáticamente. Estas señales son representadas en el oscilador como círculos para los puntos de divergencias y cuadrados para puntos de sobreprecios. Inmediatamente puede recibir alertas configurables de estas señales.
Además este indicador tiene dos características únicas
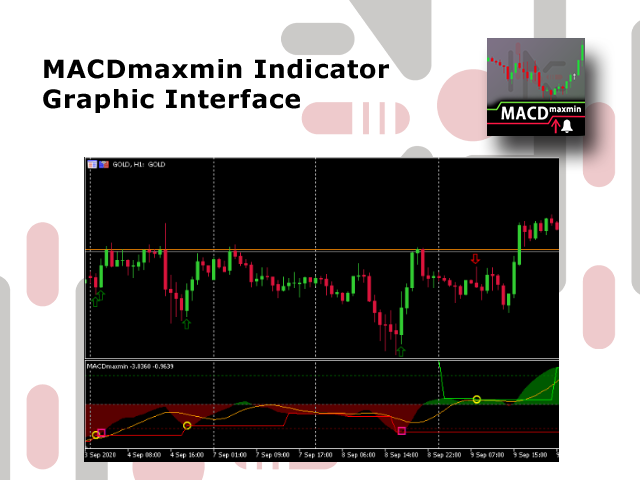
Grafica niveles de soporte y resistencia dinámicos que calcula automáticamente según el mercado al cual ha sido aplicado y los parámetros de entrada configurados convenientemente por el trader. Los niveles de sobrecompra y sobreventa también se calculan automáticamente para cada gráfico optimizando los resultados.
La segunda singularidad de MACDmaxmin es que presenta valores normalizados en una escala de -100 a 100 para tener una idea global sobre el movimiento real del mercado.
Características de MACDmaxmin
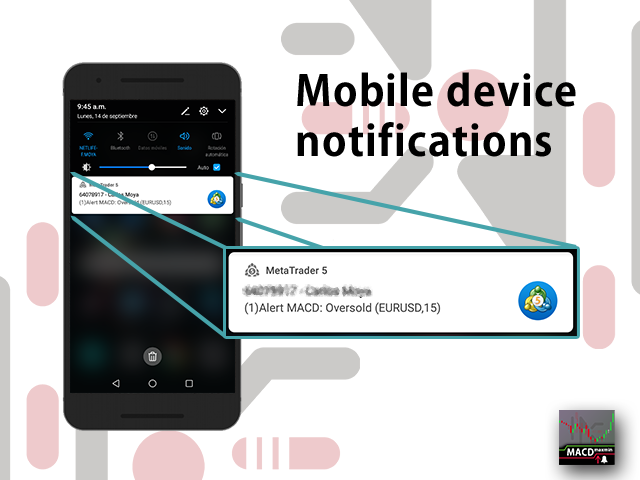
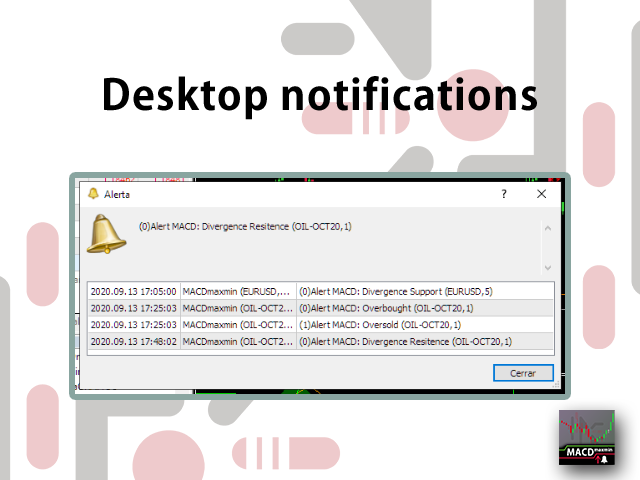
- El indicador permite generar alertas en diferentes configuraciones (aplicación móvil - Push, email, aplicación desktop) cuando se detecte divergencias y sobreprecios
Próximamente se implementará más estrategias para tener una gran variedad de señales y explotar al máximo las posibilidades de este indicador
- Las alertas se pueden repetir para un mismo evento para garantizar o para reconocer el indicador MACDmaxmin
- El indicador simplifica al máximo los parámetros, para evitar al trader complejas configuraciones
- El indicador es válido para cualquier activo y cualquier horizonte temporal
- Se puede utilizar en estrategias basadas únicamente en este indicador o se puede combinar con otros indicadores
- Puede configurar el color de las líneas de tendencias del indicador.
- Algoritmo optimizado y probado para garantizar que siempre este en servicio
Comprende:
- Un área positiva y una negativa que representa el movimiento MACD
- Línea oscilatoria como señal de fuerza de la tendencia
- 2 líneas de niveles dinámicos de soportes y resistencias en la señal del oscilador
- Dos líneas de niveles dinámicos, resist y support
Parámetros del Indicador MACDmaxmin
- Fast MACD Period periodo de velas utilizado para calcular la media móvil rápida del oscilador MACD
- Slow MACD Period periodo de velas utilizado para calcular la media móvil lenta del oscilador MACD
- Signal Period periodo utilizado para calcular la señal MACD
- Tolerance valor utilizado como condición para aceptar un pico como nuevo máximo o minimo
- Kind price calculation puede utilizar todas las formas de cálculo del precio incluido HL/2, HLC/3 y HLCC/4
- View divergence (circle) visualizar en el oscilador círculos en los puntos donde se produjo divergencias
- View overprice (square) visualizar en el oscilador cuadrados en los puntos donde se detecta sobreprecios
- View trend in chart (arrow) ver en el gráfico de velas una flecha indicando la posible tendencia según oscilador RSImaxmin
- View support and resist levels ver el soporte y la resistencia calculada automáticamente
- Alert Settings permite elegir las alertas que desea recibir con respecto al indicador. Estas pueden ser:
- alerts_off
- maxmin_Divergences
- max_Divergences
- min_Divergences
- overbought
- oversold
- overbought_sold
- all_alerts
- Alert Kind son las opciones que permite el programa para notificarle de un evento. Estas pueden ser:
- Mobile (debe tener activada esta opción en su plataforma MT5)
- Email (debe configurar su plataforma MT5 para poder recibir correos)
- Desktop
- Alls
- Alert repetition per event son las veces que puede repetir una alerta para un mismo evento. Puede repetir una alarma 1, 3, 5 y 10 veces según crea necesario


Ótimo indicador, recomendo.