Di Napoli Preferred Stochastic MT5
- Indicadores
- Samil Bozuyuk
- Versión: 1.1
- Actualizado: 13 mayo 2023
Non-proprietary study of Joe Dinapoli used for trend analysis. The indicator gives trend signals when the fast line penetrates the slow line. These signals remain intact until another penetration occurs. The signal is confirmed at the close of the period. It is applicable for all timeframes.
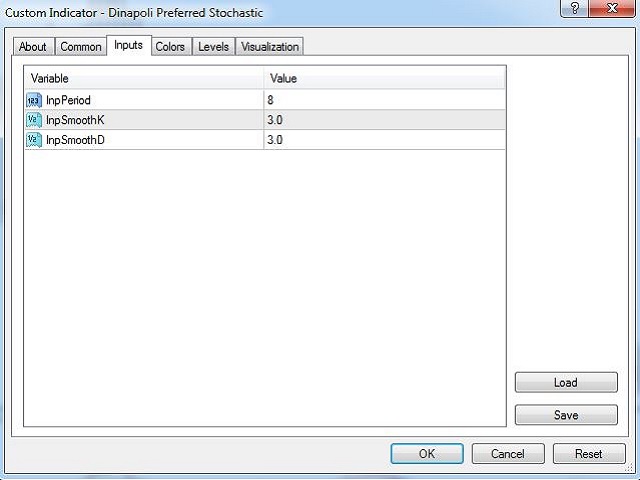
Inputs
- lnpPeriod: Period of moving average.
- lnpSmoothK: %K period.
- lnpSmoothD: %D period.
*********************************************************************************
You can also check Dinapoli's most popular MACD predictor indicator if you are looking for an advanced trend indicator.
Please visit ► https://www.mql5.com/en/market/product/52623
*********************************************************************************
For My Other Products;
Please visit ► https://www.mql5.com/en/users/samil34
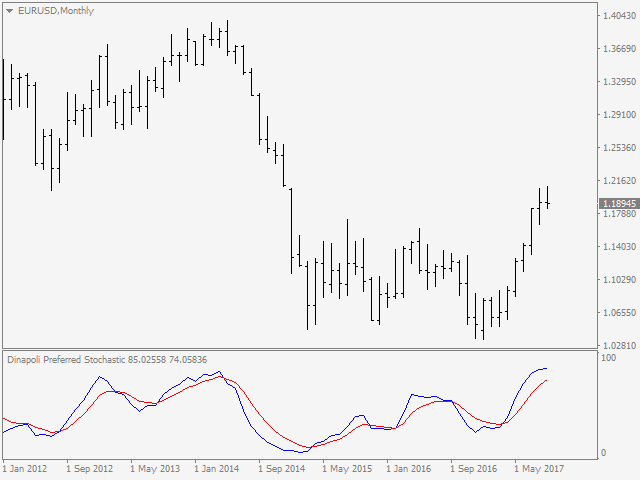
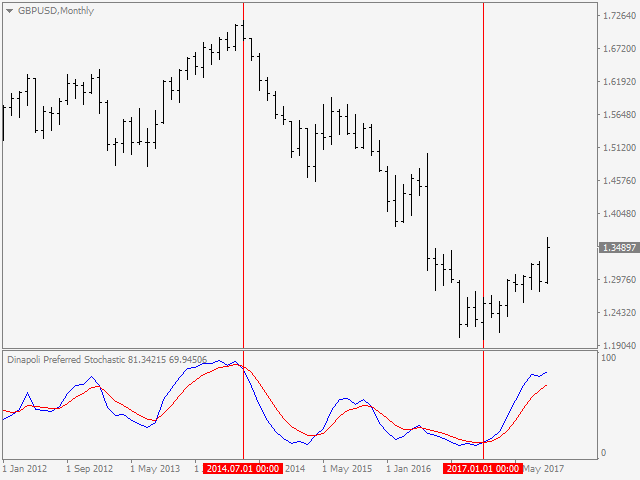
Legit Dinapoli Stochastic. Comparable with other popular Dinapoli Stochastic on TradingView