• Información general
  • Comentarios
  • Discusión

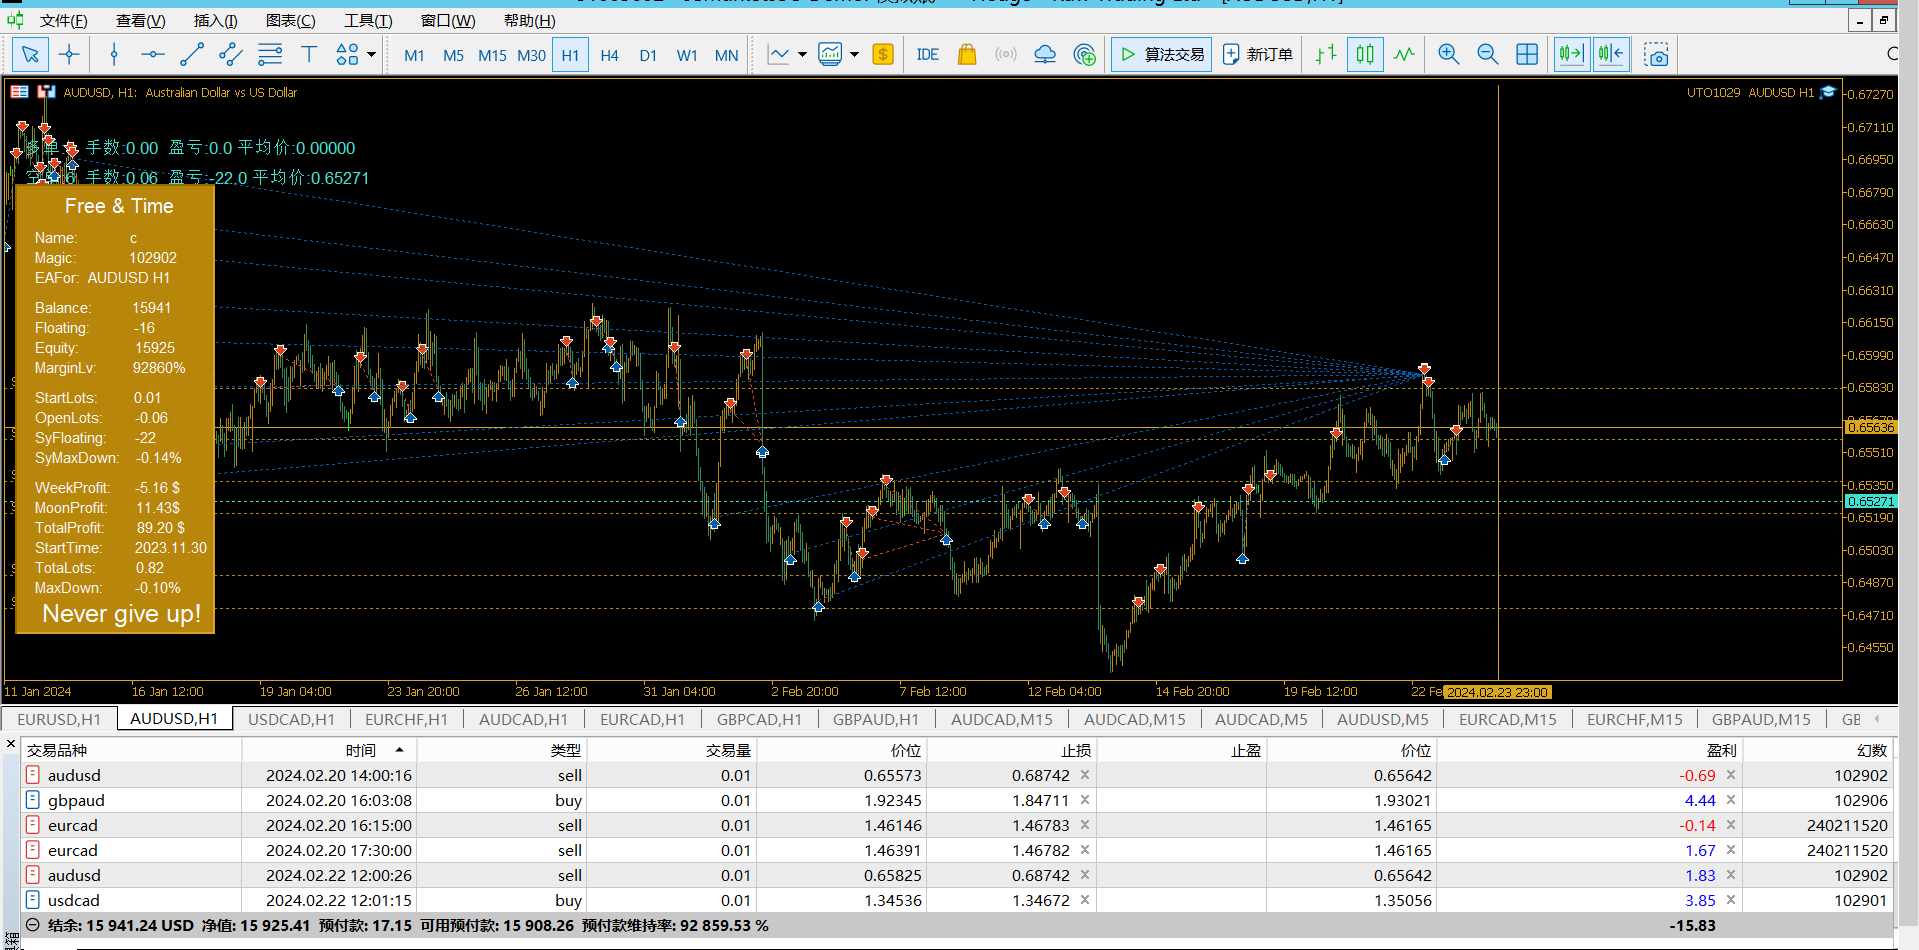
EA transaction statistics table

This indicator can use EAMagic to statistics EA since the operation of the revenue data and the current trading volume and trade data statistics, now the first version, should be slowly updated. When using, you must enter the number of EA's Magic when loading, in order to receive EA's transaction data. The part of the input currency pair and cycle can be filled in by the user to more clearly understand the currency pair and cycle that is currently being traded, and to facilitate the screenshot to share the results of the transaction.

In the subsequent version, functions will be reduced or increased according to the actual use experience. I hope this indicator is concise and effective. The driving force of the design is to understand EA usage more easily and clearly and to easily understand current account usage. I also hope that buyers can express the functions and ideas you want to me, and evolve this indicator to be more perfect, but I will not necessarily update the indicator, because I found that many functions are not actually needed, if not necessary, do not add entities.

This indicator is the unexpected product of EA writing, I hope my EA can also write it, go! go! go!!

Productos recomendados
Amihud studies the positive relationship between absolute returns and illiquidity. In particular, he computes the daily price response associated with one dollar of trading volume, and argues its value is a proxy of price impact. Despite its apparent simplicity, Hasbrouck [2009] found that daily Amihud’s lambda estimates exhibit a high rank correlation to intraday estimates of effective spread.  This indicator is based on Advances in Financial Machine Learning 2018 - Marcos Lopez de Prado book,
Save your time . Select area and the trend line will draw automatically . Draw a support and resistance line for the selected range with two mouse clicks .  If you need to, you can also draw a line for support and resistance based on separate areas. The resistance trend line is drawn based on the first and last highs inside the selected area; The support trend line is drawn based on first and last lows inside the selected area;
It is one of the famous indicator in TradingView platform. Supertrend indicator shows the trend of the market intuitively . You can use it for understanding the trend or get insight about the market. ------- Value & Color -------- You can change the colour (line, filled). Default value is the same as Tradingview Supertrend default value ( period 10, ATR multiplier 3.0)
Break out Magic Season
Mohammadal Alizadehmadani
<< See how it works on YouTube >> Possibilities: Arrow signal to buy, sell and hit the targets Alert signal send mail Execute custom audio file The Break Out Magic indicator monitors price fluctuations over a set period of time (adjustable rectangle). Then, according to the maximum and minimum price, in the second rectangle, it determines the outline break lines. And sets 3 goals to exit from each side. In the settings we have: Start Time: Start time of range End Time: The end of range tim
KT SSL Indicator MT5
KEENBASE SOFTWARE SOLUTIONS
SSL stands for Semaphore Signal Level channel. It consists of two moving averages applied to high and low, respectively, to form a price following envelope. Buy Signal: When the price closes above the higher moving average. Sell Signal: When the price closes below the lower moving average. Features It comes with a multi-timeframe scanner that scans for the new signals across all the timeframes. A straightforward personal implementation of the classic SSL effortlessly finds the trend directio
ATTENTION: the utility cannot work in the Strategy Tester, if you want to try the demo version for free for a week, or have any questions, write me an email! You can find my address on my user profile. TrendLine Auto Executor is a software capable of identifying the trendlines you have drawn on the chart and opening orders as soon as they are touched or exceeded. The software allows you to manage two orders at a time for each chart by tracking two groups of trendlines, one for each order, and
This is HTF (or MTF) of original Kolier SuperTrend indicator. On this version, you can use 4 Lines of supertrend to define the trend, it will be more powerful. Remade signals on smalls timeframes, the indicator will not repaint if used on small timeframes.
ChartColorMT5
Thomas Pierre Maurice Moine
Customize your charts with this simple utility. Choose in the 24 pre-built color sets, or use your own colors, save them to re-use them later. You can also add a text label on your chart. --- Chart Colors-- Color Set : 24 prebuilt color sets (select "Custom" to use colors below) Background color Foreground color Grid color Chart Up color Chart Down color Candle Bull color Candle Bear color  Line color Volumes color --- Label--- Text Label : Type the text you want to appear on the chart Label
The Better Volume indictator improves the comprehension on volume by coloring the classical histogram bars . The colors point out differents nature of volume . The Better Volume OnOff   allows to  open/close the subwindow   through  a botton   or using the keyboard   only.  There is the possibility to customize 3 symbols  and assign them  different parameters   for each time frame . The indicator   improves the comprehension   on volume by coloring the classical histogram bars : CLIMAX UP -
The Multicharts Crosshair draws a cross hair in any linked chart. The indicator can be used for comparison of symbol price levels in different time frame or to compare candles of different instruments in the same time frame How it works: It can works from every linked charts where the indicator is installed towards the others or from the chart where is istalled towards the following linked charts . It can be shown just pressing a the key of keyboard. After installing the indicators in the cha
Channel Creator
Ross Adam Langlands Nelson
The auto-channel indicator creates a top line and bottom line that encloses a channel within which the symbol has been trading.  The channel is created by finding high points for the top line and low points for the bottom line, these points are shown with arrows. A line of best fit is then plotted through these points and extended until the end of the chart. This indicator is useful for trading both within the channel and for breakouts. Inputs: MAPeriod - The moving average period over which the
Indicadores de la hora del mercado Forex, incluidos Sydney, Tokio, Londres, Nueva York 4 horas de mercado Considerando el cambio de horario de verano del servidor y el cambio de horario de verano en cada mercado input ENUM_DST_ZONE InpServerDSTChangeRule = DST_ZONE_US; // Reglas de cambio de horario de verano del lado del servidor Según Nueva York o Europa input int InpBackDays = 100; // días máximos de sorteo, por razones de rendimiento input bool InpShowTextLabel = true; // muestra la
Be notified of every color change of Heiken Ashi (HA) candles. The indicator will trigger past and new signals every time that HA candles change their colors. ( Note : this tool is based on the code of Heiken Ashi indicator developed by MetaQuotes Software Corp.) Features The signals are triggered at closing of last bar/opening of a new bar; Any kind of alerts can be enabled: Dialog Box, Email message, SMS notifications for smartphones and tablets, and Sound alerts; By default, up arrows are p
An ICT fair value gap is a trading concept that identifies market imbalances based on a three-candle sequence. The middle candle has a large body while the adjacent candles have upper and lower wicks that do not overlap with the middle candle. This formation suggests that there is an imbalance where buying and selling powers are not equal. Settings Minimum size of FVG (pips) -> FVGs less than the indicated pips will be not be drawn Show touched FVGs Normal FVG color -> color of FVG that hasn't
FREE
Ticks Bands
Andrej Nikitin
The Bollinger Bands indicator drawn using a tick chart. After launching it, wait for enough ticks to come. Parameters: Period - period of averaging. Deviation - deviation from the main line. Price levels count - number of displayed price levels (no levels are displayed if set to 0). Bar under calculation - number of bars on the chart for the indicator calculation. Buffer indexes: 0 - BASE_LINE, 1 - UPPER_BAND, 2 - LOWER_BAND, 3 - BID, 4 - ASK.
The " Session Control " indicator is designed to display trading sessions on a price chart. This allows the trader to see at what points of activity the most important trading sessions occur: Pacific, European, American and Asian. Each of these sessions is characterized by a certain volatility and activity in the market, which is important for making trading decisions. Peculiarities: Displaying sessions : The indicator shows time periods on the price chart corresponding to different trading s
El índice DYJ Peak Valley es un avanzado sistema de negociación promedio. Contiene líneas de tendencia futuras y ángulos de tendencia, así como la visualización del ángulo de cada valle de pico. Al final del punto más alto de la media, hay una tendencia a la baja. En la parte inferior de la línea media, hay una tendencia al alza. Por favor, descargue el archivo de plantilla de parámetros en el área de comentarios ( Link ) Nota: Establezca el parámetro inmediatamente después de ejecutar el ind
FiveMoon Pattern
Ian David Emmanuel Bello
Cet indicateur technique affiche la tendance du marché ainsi que les niveaux de support et de résistance tracés aux points extrêmes de l'indicateur ZigZag standard. Il classe les formes à cinq points en fonction de l'ordre des points de haut en bas. Le motif dynamique est basé sur les quatre premiers zigzags droits. Dans cet indicateur, tous les motifs sont considérés comme dynamiques. Pour respecter cette condition, le concept de mutation du marché a été artificiellement introduit et l'algor
Flexible HVTF Feat Alert MT5
Sa No Tsuyoshi Kokorozashi
Description This is a Utility tool for MT5 which will keep us away from a chart in a nice manner, letting us know only a good trading opportunity. It is said that from novice to experts, one of the common and obviously the most important things to do is to “WAIT” for good trading opportunities to come.   On the other hand, it is not always that case that we are sitting in front of the chart when the trading opportunity comes. Thinking about chart analysis, at the same time, major tools used t
El indicador   Spread Pulse MT5   es una herramienta eficaz que proporciona a los operadores información sobre el diferencial actual en el gráfico. El diferencial es la diferencia entre el precio de compra y el precio de venta de un instrumento. El indicador se presenta en forma de texto que se muestra en el gráfico. Esto permite al comerciante rastrear fácilmente el diferencial actual. Una de las principales ventajas del indicador Spread Pulse es su visualización en color. Dependiendo del
PnL Calendar
Keni Chetankumar Gajanan -
Monitoring your trades over time helps you build up your account balance and shows when you miss your goals. Viewing the closed trades of a symbol on the chart can help you adjust your strategy for better results. Maintaining a trade book allows you to record the applied strategy and note the reason for taking each trade. It helps you to evaluate and refine strategies based on its profitability. A possibility to download the Account history as a text file with delimited fields, allows upload to
Order Book, known also as Market Book, market depth, Level 2, - is a dynamically updated table with current volumes of orders to buy and to sell specific financial instument at price levels near Bid and Ask. MetaTrader 5 provides the means for receiving market book from your broker, but in real time only, without access to its history. The indicator OrderBook Cumulative Indicator accumulates market book data online and visualizes them on the chart. In addition, the indicator can show the market
Easley et al. [2011] proposed a high-frequency estimate of PIN, which they named volume-synchronized probability of informed trading (VPIN). This procedure adopts a volume clock, which synchronizes the data sampling with market activity. For additional details and case studies of VPIN, see Easley et al. [2013]. A number of studies have found that VPIN indeed has predictive power: Abad and Yague [2012], Bethel et al. [2012], Cheung et al. [2015], Kim et al. [2014], Song et al. [2014], Van Ness et
Tick StdDev
Andrej Nikitin
The Standard Deviation (StdDev) indicator drawn using a tick chart. After launching it, wait for enough ticks to come. Parameters: Period - period of averaging. Method - method of averaging. calculated bar - number of bars for the indicator calculation.
This indicator displays MTF (Multi-Time Frame) Candles on your Chart. It helps to see the overall Trend of Market.. It also help to MTF Analysis in fast way because you dont need look in many Time-Frames.. You get 4TF Bars/Candles on your current chart.. It can help you to identify trend or Reversal early as you get overall picture at one place... Customizable Settings are : 1. Where to place MTF Candles..  2. Show or Hide for each Candle 2. Time-Frame for each Candle
FREE
Correlation indicator
Hendrikus Alberto Lauricella
Correlation indicator is a trading indicator that compares price correlations on up to 8 different instruments simultaneously. This indicator is designed to be very versatile. It can be used to trade many different strategies from scalping to hedging to simple trend-following based on an average trend direction of multiple currency pairs or it can signal only when all the pairs correlate on the same side of a particular moving average. The indicator automatically applies the same moving average
Ticks CCI
Andrej Nikitin
The Commodity Channel Index(CCI) indicator drawn using a tick chart. After launching it, wait for enough ticks to come. Parameters: period - number of single periods used for the indicator calculation. calculated bar - number of bars for the indicator calculation. The following parameters are intended for adjusting the weight of CCI signals (from 0 to 100). You can find their description in the Signals of the Commodity Channel Index section of MQL5 Reference. The oscillator has required directio
TrailingStop
Andrej Nikitin
5 (6)
This utility is used to visually choose an indicator for trailing stop and select its parameters. The Expert Advisor modifies the Stop Loss order position opened for the instrument of the current chart based on indicator values. Uses indicators Parabolic SAR , NRTR (Nick Rypock Trailing Reverse) , Moving Average or linear regression channel. The indicators are added to or removed from the chart using the 'show' checkbox. The following options are available: Parabolic - trailing stop based on t
According to trading experience: Some symbols are easy to reverse on certain days, such as Monday, or afternoon, and so on. So comparing the current price with the corresponding historical moment price is valuable. If the price coordinate system uses a logarithmic price, you will get a lot of valuable information. 1. What is this? This program can convert the symbol price and add it to your Chart. You can compare it with your major chart. The DEMO version Link: https://www.mql5.com/en/market/p
Normalized Volume 99% of indicators are based on price analysis. This indicator is based on volume. Volume is overlooked piece of information in most trading systems. And this is a big mistake since volume gives important information about market participants. Normalized Volume is an indicator that can be used to confirm reversal points. The indicator code volume with colors indicating high, normal and low volume. You could enhance dramatically your trading system using volume analysis
Los compradores de este producto también adquieren
Atomic Analyst MT5
Issam Kassas
5 (13)
En primer lugar, vale la pena enfatizar que este Indicador de Trading no repinta, no redibuja y no se retrasa, lo que lo hace ideal tanto para el trading manual como para el automatizado. Manual del usuario: configuraciones, entradas y estrategia. El Analista Atómico es un Indicador de Acción del Precio PA que utiliza la fuerza y el impulso del precio para encontrar una mejor ventaja en el mercado. Equipado con filtros avanzados que ayudan a eliminar ruidos y señales falsas, y aumentan el poten
Primero que todo, vale la pena enfatizar que este Sistema de Trading es un Indicador No Repintado, No Redibujado y No Retrasado, lo que lo hace ideal tanto para el trading manual como para el automatizado. Curso en línea, manual y descarga de ajustes preestablecidos. El "Sistema de Trading Inteligente MT5" es una solución completa de trading diseñada para traders nuevos y experimentados. Combina más de 10 indicadores premium y presenta más de 7 estrategias de trading robustas, lo que lo convie
Dragon Multi Indicator MT5
Mansour Babasafary
5 (1)
74% discount for the next 10 buyers (original price $605): 1 left Get a 50% bonus by buying (or even renting) any of our products. After buying (or renting), send a message for more information. 3 Indicators in 1 indicator Strategy based on price action Made specifically for the best forex currency pairs Can be used in the best time frame of the market at a very reasonable price This indicator is basically 3 different indicatos . But we have combined these 3 indicators in 1 indicator so th
Quantum Trend Sniper
Bogdan Ion Puscasu
5 (39)
Introduciendo       Indicador Quantum Trend Sniper   , el innovador indicador MQL5 que está transformando la forma en que identificas y negocias los cambios de tendencia. Desarrollado por un equipo de comerciantes experimentados con experiencia comercial de más de 13 años,       Indicador de francotirador de tendencia cuántica       está diseñado para impulsar su viaje comercial a nuevas alturas con su forma innovadora de identificar cambios de tendencia con una precisión extremadamente alta.
FX Volume MT5
Daniel Stein
4.94 (17)
Obtenga su actualización diaria del mercado con detalles y capturas de pantalla a través de nuestro Morning Briefing aquí en mql5 y en Telegram ! FX Volume es el PRIMER y ÚNICO indicador de volumen que proporciona una visión REAL del sentimiento del mercado desde el punto de vista de un bróker. Proporciona una visión impresionante de cómo los participantes institucionales del mercado, como los brokers, están posicionados en el mercado Forex, mucho más rápido que los informes COT. Ver esta info
Ante todo, vale la pena enfatizar que esta Herramienta de Trading es un Indicador No Repintado, No Redibujado y No Retrasado, lo que la hace ideal para el trading profesional. Curso en línea, manual del usuario y demostración. El Indicador de Conceptos de Acción del Precio Inteligente es una herramienta muy potente tanto para traders nuevos como experimentados. Combina más de 20 indicadores útiles en uno solo, combinando ideas avanzadas de trading como el Análisis del Trader del Círculo Inte
A key element in trading is zones or levels from which decisions to buy or sell a trading instrument are made. Despite attempts by major players to conceal their presence in the market, they inevitably leave traces. Our task was to learn how to identify these traces and interpret them correctly. Reversal First Impulse levels (RFI)   -  Version MT4                  INSTRUCTIONS                 RUS                 ENG                         R ecommended to use with an indicator   -  TREND PRO  
TPSpro TRENDPRO  - is a trend indicator that automatically analyzes the market and provides information about the trend and each of its changes, as well as giving signals for entering trades without redrawing! The indicator uses each candle, analyzing them separately. referring to different impulses - up or down impulse. Exact entry points into transactions for currencies, crypto, metals, stocks, indices!  -  Version MT4                  DETAILED DESCRIPTION        /       TRADING SETUPS       
Trend Screener Pro MT5
STE S.S.COMPANY
4.87 (62)
Desbloquee el poder del comercio de tendencias con el indicador Trend Screener: ¡su solución definitiva para el comercio de tendencias impulsada por lógica difusa y un sistema multidivisa!Mejore su comercio de tendencias con Trend Screener, el revolucionario indicador de tendencias impulsado por lógica difusa. Es un poderoso indicador de seguimiento de tendencias que combina más de 13 herramientas y funciones premium y 3 estrategias comerciales, lo que lo convierte en una opción versátil para co
Introduciendo       Quantum Breakout PRO   , el innovador indicador MQL5 que está transformando la forma en que comercia con Breakout Zones. Desarrollado por un equipo de comerciantes experimentados con experiencia comercial de más de 13 años,       Desglose cuántico PRO       está diseñado para impulsar su viaje comercial a nuevas alturas con su innovadora y dinámica estrategia de zona de ruptura. El indicador de ruptura cuántica le dará flechas de señal en las zonas de ruptura con 5 zonas
Quantum Heiken Ashi PRO MT5
Bogdan Ion Puscasu
4.5 (8)
Presentamos el   Quantum Heiken Ashi PRO Diseñadas para brindar información clara sobre las tendencias del mercado, las velas Heiken Ashi son reconocidas por su capacidad para filtrar el ruido y eliminar las señales falsas. Diga adiós a las confusas fluctuaciones de precios y dé la bienvenida a una representación gráfica más fluida y confiable. Lo que hace que Quantum Heiken Ashi PRO sea realmente único es su fórmula innovadora, que transforma los datos de velas tradicionales en barras de colore
AW Trend Predictor MT5
AW Trading Software Limited
4.77 (56)
La combinación de niveles de tendencia y ruptura en un sistema. Un algoritmo de indicador avanzado filtra el ruido del mercado, determina la tendencia, los puntos de entrada y los posibles niveles de salida. Las señales indicadoras se registran en un módulo estadístico, que le permite seleccionar las herramientas más adecuadas, mostrando la efectividad del historial de señales. El indicador calcula las marcas Take Profit y Stop Loss. Manual e instrucciones ->   AQUÍ   / Versión MT4 ->   AQUÍ Có
ICT, SMC, SMART MONEY CONCEPTS, SMART MONEY, Smart Money Concept, Support and Resistance, Trend Analysis, Price Action, Market Structure, Order Blocks, BOS/CHoCH,   Breaker Blocks ,  Momentum Shift,   Supply&Demand Zone/Order Blocks , Strong Imbalance,   HH/LL/HL/LH,    Fair Value Gap, FVG,  Premium  &   Discount   Zones, Fibonacci Retracement, OTE, Buy Side Liquidity, Sell Side Liquidity, BSL/SSL Taken, Equal Highs & Lows, MTF Dashboard, Multiple Time Frame, BigBar, HTF OB, HTF Market Structure
FX Power MT5 NG
Daniel Stein
5 (5)
Obtenga su actualización diaria del mercado con detalles y capturas de pantalla a través de nuestro Morning Briefing aquí en mql5 y en Telegram ! FX Power MT5 NG es la nueva generación de nuestro popular medidor de fuerza de divisas, FX Power. ¿Y qué ofrece este medidor de fuerza de nueva generación? Todo lo que le encantaba del FX Power original PLUS Análisis de fuerza de ORO/XAU Resultados de cálculo aún más precisos Períodos de análisis configurables individualmente Límite de cálculo persona
Professional Scalping Tool on Deriv Attention! The indicator will be sold in limited quantities!!! The previous 5 copies were sold for $250 The remaining 4 copies will be sold for $350 The next price is $500 Description: This trading indicator is designed for professional traders focused on scalping. Designed with the market in mind, it provides highly accurate spike trading signals. It works on the M1 timeframe and supports the following symbols: Boom 300 Index, Boom 500 Index, Boom 1000 I
IX Power MT5
Daniel Stein
5 (3)
IX Power   lleva por fin la insuperable precisión de FX Power a los símbolos que no son de Forex. Determina con exactitud la intensidad de las tendencias a corto, medio y largo plazo de tus índices, acciones, materias primas, ETF e incluso criptodivisas favoritas. Puede   analizar todo lo   que su terminal le ofrece. Pruébalo y experimenta cómo   tu timing mejora significativamente   a la hora de operar. Características principales de IX Power Resultados de cálculo 100% precisos y sin rep
TrendDecoder Premium MT5
Christophe, Pa Trouillas
5 (2)
Identifique los rangos y los próximos movimientos probables  |  Obtenga las señales más tempranas y la fuerza de las Tendencias   |  Obtener salidas claras antes de reversión   |  Detecte los niveles de Fibo que el precio pondrá a prueba   |  Indicador no repintado y no retardado - ideal para la trading manual y automatizada - adecuado para todos los activos y todas las unidades temporales 69$   para el lanzamiento - luego de nuevo a >>   $ 149 Después de la compra,   póngase en contacto con mi
Conviértase en un Breaker Trader y obtenga beneficios de los cambios en la estructura del mercado a medida que se invierte el precio. El indicador de ruptura de bloque de órdenes identifica cuándo una tendencia o movimiento de precio se acerca al agotamiento y está listo para revertirse. Le alerta sobre cambios en la estructura del mercado que generalmente ocurren cuando una reversión o un retroceso importante están a punto de suceder. El indicador utiliza un cálculo patentado que identific
Introducing the South African Sniper indicator created by a small group of traders with a few years trading trading the financial market profitably . This is a plug and play indicator that provides you with  BUY and SELL (SNIPER ENTRY) signals with TARGET and trail stops. The indicator Works with all MT5 trading instruments. The indicator uses previous  chart data as receipt to speculate on future market moves.
El indicador de reversión de ADR le muestra de un vistazo dónde se cotiza actualmente el precio en relación con su rango diario promedio normal. Recibirá alertas instantáneas a través de una ventana emergente, correo electrónico o push cuando el precio exceda su rango promedio y los niveles por encima de su elección para que pueda saltar rápidamente a retrocesos y reversiones. El indicador dibuja líneas horizontales en el gráfico en los extremos del rango promedio diario y también extensiones p
Auto Order Block with break of structure based on ICT and Smart Money Concepts Futures Break of Structure ( BoS )             Order block ( OB )            Higher time frame Order block / Point of Interest ( POI )    shown on current chart           Fair value Gap ( FVG ) / Imbalance   ,  MTF      ( Multi Time Frame )    Volume Imbalance     ,  MTF          vIMB Gap’s Equal High / Low’s     ,  MTF             EQH / EQL Liquidity               Current Day High / Low           HOD /
RelicusRoad Pro MT5
Relicus LLC
4.82 (22)
Ahora $ 147 (aumentando a $ 499 después de algunas actualizaciones) - Cuentas ilimitadas (PC o Mac) Manual de usuario de RelicusRoad + Videos de capacitación + Acceso al grupo privado de Discord + Estado VIP UNA NUEVA MANERA DE VER EL MERCADO RelicusRoad es el indicador comercial más poderoso del mundo para divisas, futuros, criptomonedas, acciones e índices, y brinda a los comerciantes toda la información y las herramientas que necesitan para mantenerse rentables. Brindamos análisis téc
Blahtech Supply Demand MT5
Blahtech Limited
4.57 (14)
Was: $299  Now: $99   Supply Demand uses previous price action to identify potential imbalances between buyers and sellers. The key is to identify the better odds zones, not just the untouched ones. Blahtech Supply Demand indicator delivers functionality previously unavailable on any trading platform. This 4-in-1 indicator not only highlights the higher probability zones using a multi-criteria strength engine, but also combines it with multi-timeframe trend analysis, previously confirmed swings
Was: $249  Now: $99   Market Profile defines a number of day types that can help the trader to determine market behaviour. A key feature is the Value Area, representing the range of price action where 70% of trading took place. Understanding the Value Area can give traders valuable insight into market direction and establish the higher odds trade. It is an excellent addition to any system you may be using. Inspired by Jim Dalton’s book “Mind Over Markets”, this indicator is designed to suit the
Este es un genial indicador para MT5 que ofrece señales precisas para entrar en una transacción sin redibujar. Se puede aplicar a cualquier activo financiero: fórex, criptomonedas, metales, acciones, índices. Nos dará valoraciones bastante precisas y nos dirá cuándo es mejor abrir y cerra una transacción. Eche un vistazo  al vídeo  (6:22), ¡contiene un ejemplo de procesamiento de una sola señal que ha amortizado el indicador! La mayoría de los tráders mejoran sus resultados comerciales durante l
Advanced Supply Demand MT5
Bernhard Schweigert
4.53 (15)
¡Actualmente con 33% de descuento! ¡La mejor solución para cualquier tráder principiante o experto! Este indicador es una herramienta comercial única, de alta calidad y asequible, porque incorpora una serie de características patentadas y una nueva fórmula. Con esta actualización, podrá mostrar zonas de doble marco temporal. No solo podrá mostrar un marco temporal más alto, sino también mostrar ambos, el marco temporal del gráfico MÁS el marco temporal más alto: MOSTRANDO ZONAS ANIDADAS. A todos
TrendLine PRO MT5
Evgenii Aksenov
4.78 (50)
El indicador Trend Line PRO es una estrategia comercial independiente. Muestra el cambio de tendencia, el punto de entrada a la transacción, así como calcula automáticamente tres niveles de Take Profit y la protección contra la pérdida de Stop Loss Trend Line PRO es perfecto para todos los símbolos de Meta Trader: monedas, metales, criptomonedas, acciones e índices Ventajas de Trend Line PRO: Nunca vuelve a dibujar sus señales Posibilidad de utilizar como estrategia independiente Tiene tres niv
Antes que nada, vale la pena enfatizar que este Sistema de Trading es un Indicador No Repintado, No Redibujado y sin Retardos, lo que lo hace ideal para el trading profesional. Curso en línea, manual del usuario y demostración. El "Sistema de Trading de Soporte y Resistencia Inteligente" es un indicador avanzado diseñado para traders nuevos y experimentados. Empodera a los traders con precisión y confianza en el mercado de divisas. Este sistema integral combina más de 7 estrategias, 10 indicado
Trend Forecaster
Alexey Minkov
5 (3)
The Trend Forecaster indicator utilizes a unique proprietary algorithm to determine entry points for a breakout trading strategy. The indicator identifies price clusters, analyzes price movement near levels, and provides a signal when the price breaks through a level. The Trend Forecaster indicator is suitable for all financial assets, including currencies (Forex), metals, stocks, indices, and cryptocurrencies. You can also adjust the indicator to work on any time frames, although it is recommen
Matrix Arrow Indicator MT5
Juvenille Emperor Limited
5 (14)
Matrix Arrow Indicator MT5   es una tendencia única 10 en 1 que sigue un indicador   100% sin repintado   de marcos temporales múltiples que se puede usar en todos los símbolos/instrumentos:   divisas ,   materias primas ,   criptomonedas ,   índices ,   acciones .  Matrix Arrow Indicator MT5  determinará la tendencia actual en sus primeras etapas, recopilando información y datos de hasta 10 indicadores estándar, que son: Índice de movimiento direccional promedio (ADX) Índice de canales de prod
Filtro:
No hay comentarios
Respuesta al comentario