• Información general
  • Comentarios (4)
  • Discusión (1)
  • Novedades

ON Trade Optuma Astro

5

Por supuesto, aquí tienes la traducción al español:

Presentamos el Indicador de Astronomía para MT4: Tu Compañero Celestial Definitivo en el Trading

¿Estás listo para elevar tu experiencia de trading a alturas celestiales? No busques más allá de nuestro revolucionario Indicador de Astronomía para MT4. Esta innovadora herramienta trasciende los indicadores de trading tradicionales, aprovechando el poder de algoritmos complejos para proporcionarte una visión astronómica sin igual y cálculos de precisión.

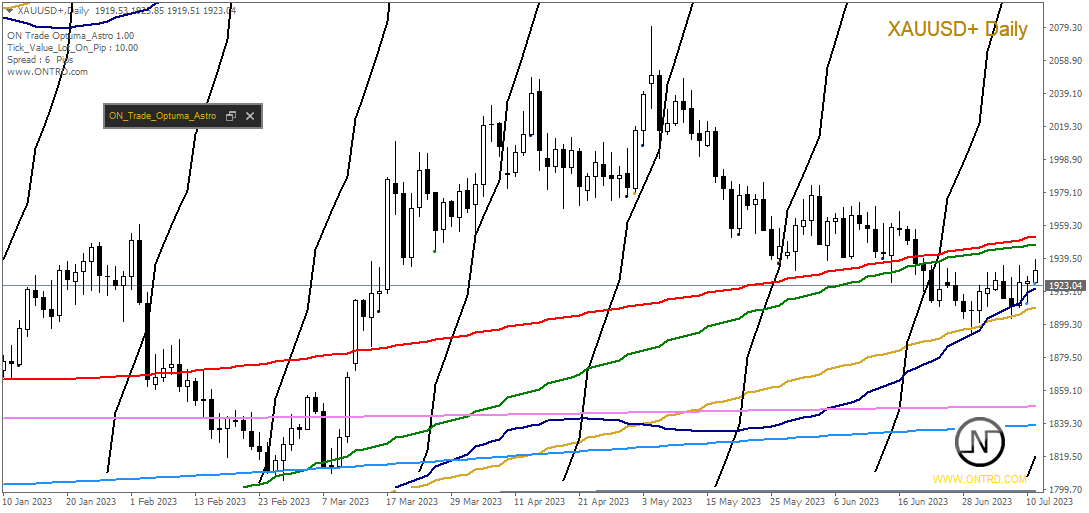
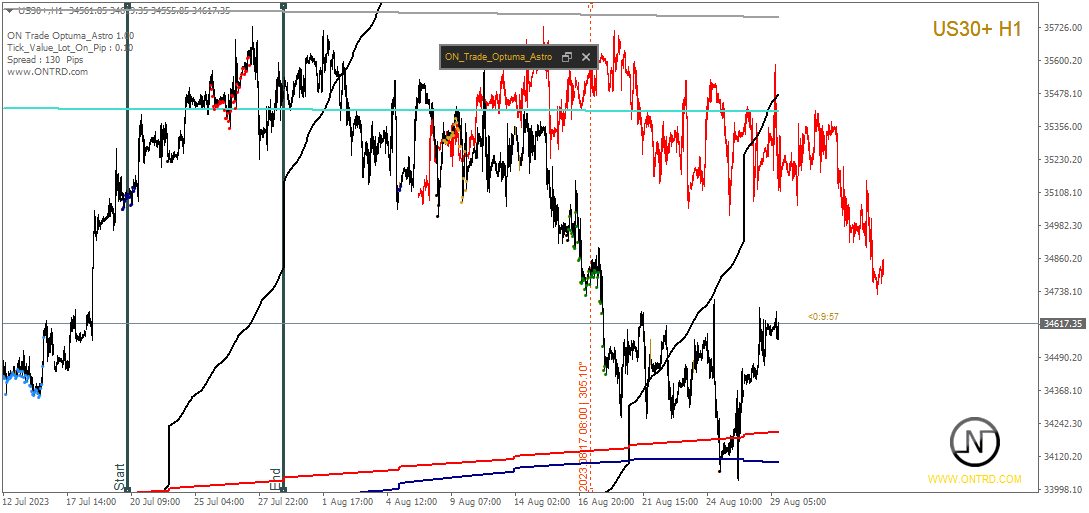
Un Universo de Información a tu Alcance: Contempla un panel completo que revela un tesoro de datos astronómicos. Observa las coordenadas geo/heliocéntricas de los planetas, la distancia entre el sol y la tierra, magnitudes, elongaciones, constelaciones, coordenadas eclípticas y ecuatoriales, e incluso coordenadas horizontales; cada detalle calculado meticulosamente y presentado de manera hermosa. La línea vertical generada por el indicador corresponde al valor del tiempo, brindándote una perspectiva cósmica en tu trayecto de trading.

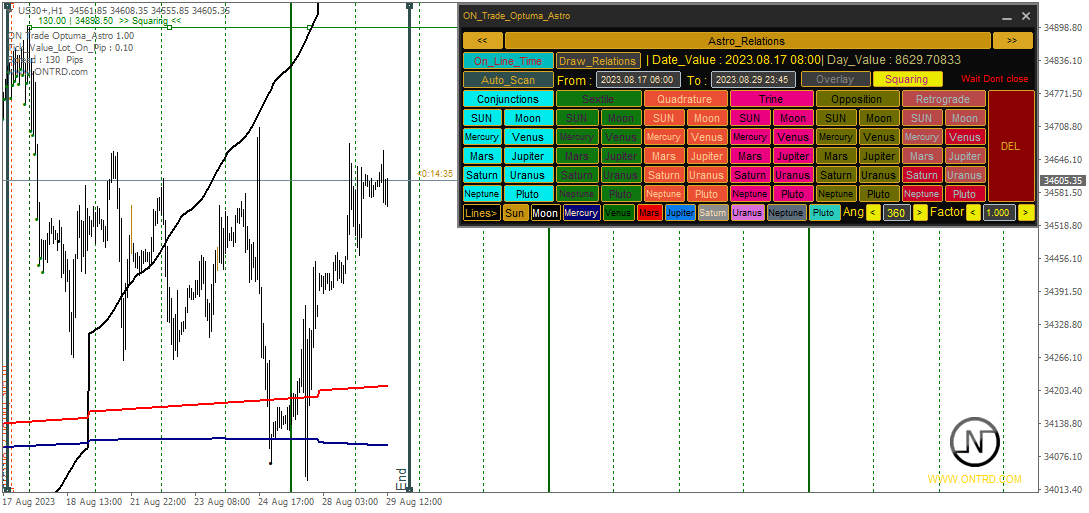
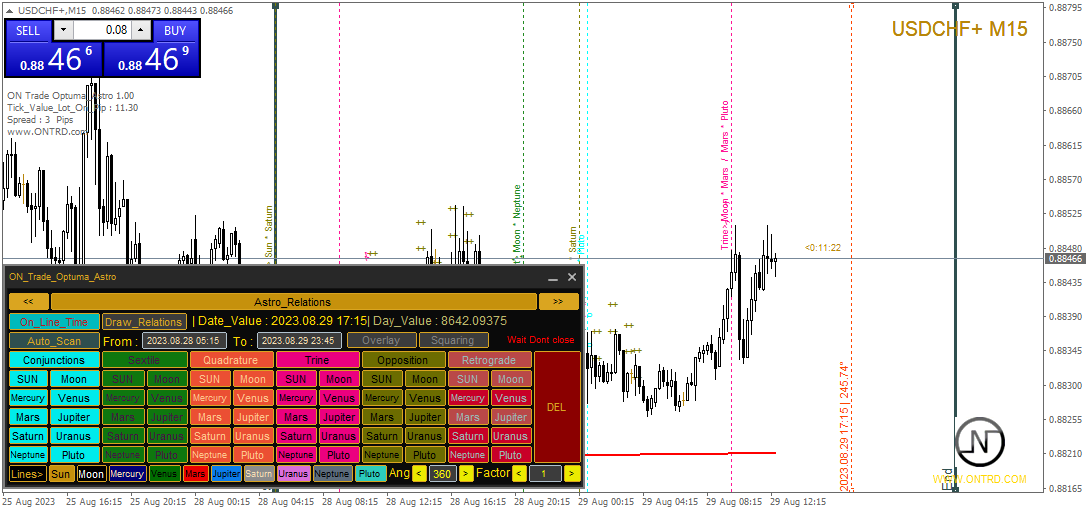
Líneas y Relaciones Planetarias: Experimenta la magia de las líneas planetarias que adornan tus gráficos, con escalas y ángulos personalizables. Cambia sin esfuerzo la visibilidad de la línea de cada planeta a través del panel de control intuitivo. Descubre el arte de las relaciones planetarias con indicadores de conjunciones, sextiles, cuadraturas, trígonos, oposiciones y retrógrados. Explora estas configuraciones cósmicas dentro del rango de tiempo que elijas, empoderándote para identificar oportunidades de trading significativas.

Desbloqueando la Sabiduría de Gann: Revela el futuro con líneas verticales de cuadratura inspiradas en Gann que revelan posibles momentos de reversión. Esta modificación innovadora da vida a los principios probados por el tiempo de Gann, ayudándote a adelantarte a los giros y tendencias del mercado.

Guía Lunar: Navega por las fases lunares con elegancia mientras la Luna Nueva y la Luna Llena adornan tus gráficos. Los ciclos lunares desempeñan un papel vital en el trading, y nuestro indicador garantiza que nunca te pierdas un detalle.

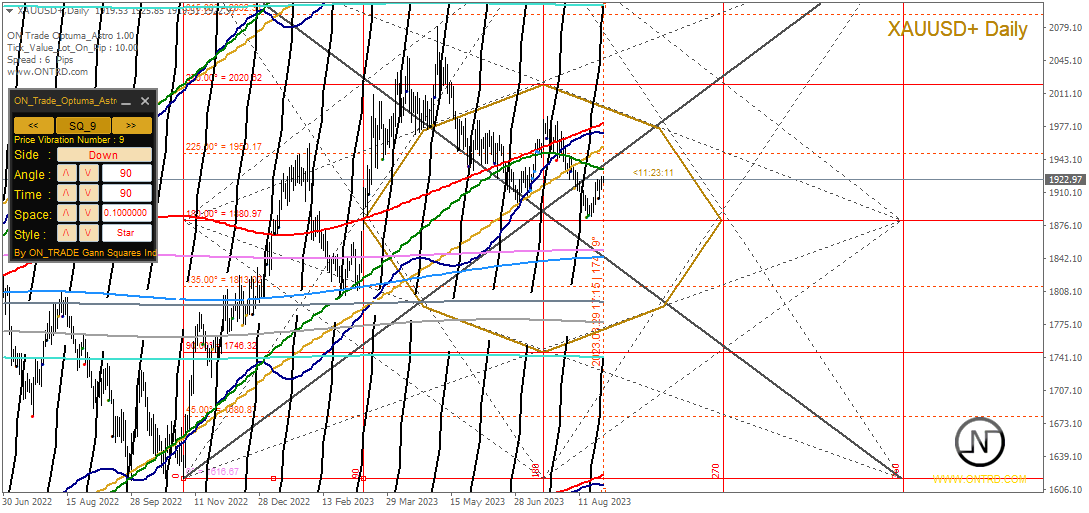
La Ventaja del Cuadro de Nueve: Aprovecha el panel del Cuadro de Nueve para enriquecer tus análisis astronómicos. Esta herramienta antigua se ha integrado perfectamente para empoderarte con perspectivas únicas sobre las relaciones entre precio y tiempo.

Tiempo de Grados Planetarios: Embárcate en un viaje a través de los cielos con la función de Tiempo de Grados Planetarios. Ajusta los ángulos sin esfuerzo y sumérgete en el cosmos, alineando tus decisiones de trading con la sabiduría celestial.

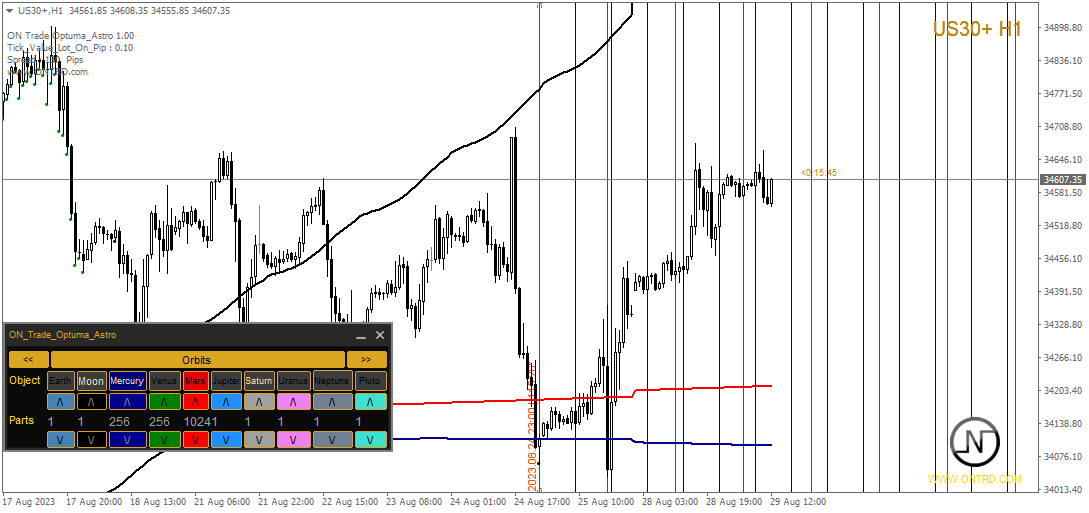
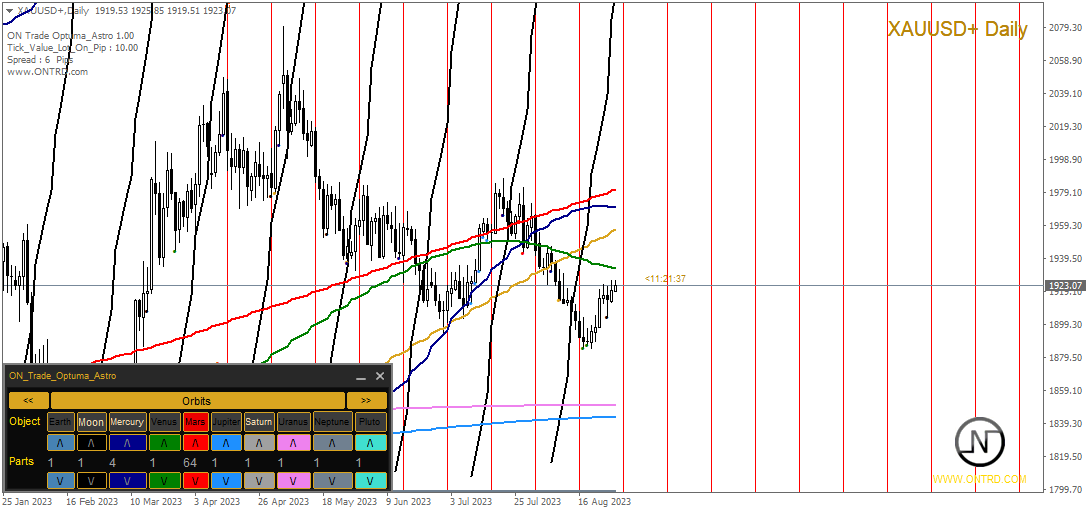
Órbitas y Más: Observa la función de órbitas, una característica ingeniosa que dibuja separadores de tiempo de órbita en tu gráfico, ya sea diario o actual. El panel de información de la cuenta del indicador complementa sus funciones con una potente calculadora de lotes y una función de alarma, asegurándote que estés siempre en control.

Aprovecha las Estrellas: Navega por el universo del trading con una función de superposición que ofrece claridad y precisión. Cada característica es accesible de manera fluida a través del panel de control intuitivo, permitiéndote guardar tus configuraciones preferidas para un trayecto de trading personalizado.

Un Futuro Brillante te Espera: Este Indicador de Astronomía marca el amanecer de una nueva era. A medida que abraces su potencial, recuerda que es solo el comienzo. Hay actualizaciones en el horizonte, con la visión de establecerlo como la oferta líder e insuperable en el mercado.

Una Nota Importante: Aunque el indicador no es compatible con las pruebas retrospectivas, ten la seguridad de que su funcionalidad ha sido capturada meticulosamente en un video e imágenes adjuntas. Observa sus capacidades dinámicas en acción.

Tu Opinión Importa: A medida que emprendes este viaje de trading cósmico, comparte amablemente tus experiencias a través de reseñas. Tu retroalimentación impulsa nuestra búsqueda de la excelencia.

Abraza las estrellas, captura los planetas y navega por el cosmos con confianza. El Indicador de Astronomía para MT4 es tu luz guía en el mundo del trading, fusionando lo profundo con lo práctico en una danza armónica de precisión celeste y astucia financiera.


Comentarios 4
ahmed nabil
23
ahmed nabil 2023.09.29 14:15 
 

good one

rumbacillo
24
rumbacillo 2023.09.20 09:34 
 

This indicator is priceless and provides solid guidance to trade every symbol. Thanks for coding it

Productos recomendados
Forex Gump
Andrey Kozak
2.83 (6)
Forex Gump is a fully finished semi-automatic trading system. In the form of arrows, signals are displayed on the screen for opening and closing deals. All you need is to follow the instructions of the indicator. When the indicator shows a blue arrow, you need to open a buy order. When the indicator shows a red arrow, you need to open a sell order. Close orders when the indicator draws a yellow cross. In order to get the most effective result, we recommend using the timeframes H1, H4, D1. There
69 USD
Position
Jinxiong Yuan
Positon index is the cyclical index of market trend movement, and Positon's value ranges from 0 to 100. When Positon value is below 10, it means that the market is in extreme decline, the market atmosphere is extremely pessimistic, and the market is about to hit bottom and turn around. When Positon value is above 80, it means that the market is in extreme excitement, the market atmosphere is extremely bullish, the market is about to peak and there is a sharp decline.
30 USD
Sto Signal AM
Andriy Matviyevs'kyy
This indicator displays Stochastic osc signals on the price chart and allows the user to receive notifications of such signals. The Stochastic indicator is a classic and proven indicator of the technical analysis of the markets. Despite its age, it is still relevant today. Depending on the settings, the indicator allows you to work effectively on various TFs and any markets. Signals are given on fully formed bars and are not redrawn. Custom Parameters: Stochastic_Price (0-1) - The applied pric
FREE
Target Striking
Dmitriy Kashevich
Target Striking - One of the best binary options trading tools! It is set up so powerfully that you can trade not only on currency pairs, but also on raw gold oil! You can also try on cryptocurrency! Ideal for trading on currency pairs, the percentage of reliable transactions is more than + 75% The trading tool is already set for the best profit! Only Target Striking can unlock the potential of the trading market for you! With it, the signals are even and accurate without redrawing,
1 650 USD
Breakout Monster Mini
Abdulfattah Yahya Mohammed Alhazmi
It is a very profitable EA, to trade trends breakout, and manage trades, takeprofit, stoploss, move to breakeven, and trailing stop. I work with this EA, and the reversal/pullback version since 2014.  This is a demo   version of the full   Breakout Monster EA . It works on Real and Demo accounts. Demo version restrictions: Money Management is disabled. Lot size is restricted to 0.01 lots only (Or the minimum allowed by broker). Numerical, SL and TP set to 100 pips. They cannot be modified i
FREE
Trading is a trade war So traders are warriors. A warrior needs a weapon. The Scalping One Plus A1 is a powerful weapon. Extremely accurate This tool can be customized as you like. Who deserves such an accurate weapon? 1. People who want profits From binary options trading 2. Those who want to trade short, profit fast 3. People who want long-term can do it. 4. Beginners can use it. 5. Old hand works very well. How it works It works very easy. For binary options Time frame M1 or M5 and exp
399 USD
Infinity Trend Pro
Yaroslav Varankin
1 (1)
This is a trend indicator without redrawing Developed instead of the binary options strategy (by the color of the Martingale candlestick) Also works well in forex trading When to open trades (binary options) A signal will appear in the place with a candle signaling the current candle It is recommended to open a deal for one candle of the current timeframe M1 and M5 When a blue dot appears, open a deal up When a red dot appears, open a trade down. How to open trades on Forex. When a signal is rec
1 000 USD
Market Structure Zig Zag
Lesedi Oliver Seilane
4.69 (13)
Free Market structure zig zag to assist in price action trading the screenshots describe how to use and how to spot patterns new version comes with alerts, email alert and  push notification alert can be used on all pairs  can be used on all timeframes  you can add additional confirmation indicators the indicator shows you your higher high and low highs as well as your lower lows and lower highs  the indication makes price action analysis easier to spot.
FREE
Indicator for binary options arrow is easy to use and does not require configuration works on all currency pairs, cryptocurrencies buy signal blue up arrow sell signal red down arrow tips do not trade during news and 15-30 minutes before their release, as the market is too volatile and there is a lot of noise it is worth entering trades one or two candles from the current period (recommended for 1 candle) timeframe up to m 15 recommended money management fixed lot or fixed percentage of the depo
100 USD
BoB Candles AM
Andriy Matviyevs'kyy
The indicator improves the idea implemented in the standard Bulls and Bears indicator. The indicator colors candles by analyzing the divergence of the maximum and minimum prices of the current bar with the average value of the maximum and minimum prices over a longer period of time. The indicator does not re-paint on fully formed bars. The indicator is easy to set and efficient on trendy market segments. Adjustable parameters: i_Period - smoothing period for forming the channel; i_Method - smo
FREE
Shark Deal Book
Philip Pankaj Suthagar
4 (3)
Term  "shark"  in the business world denotes a high volume investor who just made a good investment in a highly Potential business deal.So, sharks are the ones who make the market move. In our case, if an American shark bought a Japanese company, he/she has to convert American dollars into Japanese yen to make the deal. So, the demand for the Japanese yen will increase sharply. Thus USD/JPY will go short rapidly if the deal was from the shark. Another example, In the case of forex, if fed increa
199 USD
RNN Pro
Shahryar Yeganeh Hajahmadi
Experience Revolutionary Trading with the Updated RNN Ai – Now with Enhanced Pattern Recognition [USDJPY 1M] We are thrilled to announce the newest update for the RNN Ai, a pinnacle of trading software renowned for its sustained performance over 48 months with minimal drawdowns. We've taken a bold step forward by transitioning from the grid strategy to a more refined pattern recognition approach, optimizing your trading experience to unprecedented levels. Explore the MT4 compatible version of RN
22 500 USD
Utility for show on charts the visual informations about: - a vertical line at start of each bar of selected timeframe - a vertical line at start of each day - a vertical line at start of each week - vertical lines at start / end of trading sessions selected - bid / ask prices, spread, money value for each point (of 1 standard lot) and last tick time recived" You can enable / disable each information and set the color for each line
FREE
SRP Pro
Farhad Kia
5 (1)
Strong Retracement Points Pro edition! SRP (Strong Retracement/Reversal Points) is a powerful and unique support and resistance indicator. It displays the closest important levels which we expect the price retracement/reversal! If all level are broken from one side, it recalculates and draws new support and resistance levels, so the levels might be valid for several days depending on the market! If you are still hesitating to start using this wonderful tool, you can check this link to see how ef
400 USD
RSI Currency Strength Meter uses RSI (Relative Strength Index) to monitor how strong a currency is, or in other words, if it's being bought or sold by the majority compared to the other currencies. It displays the strength-lines of the currencies of the pair (base and counter currency of the chart) with changeable solid lines. Also, you can add up to ONE additional currency (only 1 in the DEMO version, in REAL up to 5) to the "comparison pool" that already has the base and the profit (counter) c
FREE
Elliott Wave Trend was designed for the scientific wave counting. This tool focuses to get rid of the vagueness of the classic Elliott Wave Counting using the guideline from the template and pattern approach. In doing so, firstly Elliott Wave Trend offers the template for your wave counting. Secondly, it offers Wave Structural Score to assist to identify accurate wave formation. It offers both impulse wave Structural Score and corrective wave Structure Score. Structural Score is the rating to sh
200 USD
Gecko
Profalgo Limited
4.4 (10)
NEW PROMO: Only a few copies copies available at 349$ Next price: 449$ Make sure to check out our " Ultimate EA combo package " in our   promo blog ! Gecko runs a simple, yet very effective, proven strategy.  It looks for important recent high and lows and will trade the breakouts.  The actual execution of this strategy however, is what makes this EA truly shine.  Entry calculations and exit algorithms are not only unique but also very advanced. LIVE RESULTS: https://www.mql5.com/en/signals/7
149 USD
Chart Patterns Detect 15 patterns (Ascending Triangle, Descending Triangle, Rising Wedge, Falling Wedge, Bullish Flag, Bearish Flag, Bullish Rectangle, Bearish Rectangle Symmetrical triangle, Head and Shoulders, Inverted Head and Shoulders, Triple top, Triple Bottom, Double Top, Double Bottom) Use historical data to calculate the probability of each pattern to succeed (possibility to filter notification according to the chance of success) gives graphic indication about the invalidation level and
58 USD
Ticks Size
Viktor Kolmakov
This indicator displays in a separate window the difference between the number of points which increased the price, and the number of points that decreased the price during the time interval specified in the settings. The time interval for calculation is expressed as the number of bars of the chart the indicator is attached to. This approach allows you to evaluate the movement direction (growth or fall) of the instrument's price, the strength of the movement and the size of the movement in point
1 200 USD
This indicator Mega Super indicator.Indicator displays trend movement. Indicator helps to buy and sell.In dicator displays arrow and line. Features per - displays indicator period. How to understand the status: If the arrow color is green, trend is up. I f the arrow color is red, trend is down. //////////////////////////////////////////////////////////////////////////////////////////////////////////////////////////////////////////////////// //////////////////////////////////////////////
60 USD
This is the FXTraderariel TrendTrader .It analysis the trend and displays it, due to changing the changing the candle color. It took me over 12 Year to develop this system. But it shows the market perfect. Very easy to follow, even for beginners. It works on all Pairs and all Timeframes (however we advice only pro traders to trade smaller Timeframes, novice traders should stick to higher TF like H4 and D1). Depending on the settings it and trading style, it can be used for scalping or long-t
1 000 USD
LordAutoFibonnaci
Igor Pereira Calil
5 (1)
Lord Auto Fibonnaci is a free indicator for Meta Trader, in order to show the most famous chart in the financial market known as "Fibonnaci". As we can see in the images below, the fibonnaci table will automatically analyze the graph for you, with trend factors through percentage, almost infallible use, you can always work when the percentage is low or high, start shopping and sales on time, great for analyzing entries! In the images below we can see an example in gold in H4, where we are a
FREE
The indicator allows you to trade binary options. The recommended time frame is М1 and the expiration time is 1,2,3 minutes. The indicator suitable for auto and manual trading. A possible signal is specified as a arrows above/under a candle. You should wait until the candle closes! Arrows are not re-painted Trade sessions: TOKYO section (Half-end) Currency pairs: USD/JPY Working time frame: M1 Expiration time: 1,2,3 minutes. The indicator also shows good results when using the martingale strateg
FREE
When it comes to trading in the financial markets, there's no question that the banks have a major advantage. They have access to vast amounts of resources, including high-powered trading algorithms, in-depth market research, and teams of experienced traders. But what if you could level the playing field and trade like the banks do? That's exactly what our Smart Money Indicator allows you to do. By providing you with critical insights into market structure and supply and demand zones, you can ma
2 200 USD
"Este indicador detecta las entradas basadas en la teoría del patrón Bystra y proporciona valores de entrada para colocar órdenes limitadas con niveles de objetivo y stop. Esto te permite calcular tu porcentaje de riesgo. Notas: Este indicador tiene buffers que permiten su uso en Asesores Expertos (EAs). Es importante practicar una buena gestión de dinero mientras trabajas con este producto. Cuando cambias tu marco de tiempo, El indicador guardará la plantilla usada en tu última sesión. Si neces
88.20 USD
TPO Profile MT4
Kyra Nickaline Watson-gordon
5 (1)
Definition : TPO is a Time Price Opportunity. Instead of using bars or candles with an Open, High, Low, and Close price, each "bar" in a Market Profile is represented by horizontal bars against the price It is called Market Profile terminology. In other words time-price-opportunity (TPO) profiles are histograms of how much time was spent at each price within the span of the profile. By using a TPO chart, you are able to analyze the amount of trading activity, based on time, for each price lev
60 USD
Introduction to Chart Pattern MT Chart Pattern MT is a chart pattern scanner to detect the triangle pattern, falling wedge pattern, rising wedge pattern, channel pattern and so on. Chart Pattern MT uses highly sophisticated chart pattern detection algorithm. However, we have designed it in the easy to use with intuitive user interface. Chart Pattern MT will show all the patterns in your chart in the most efficient format for your trading. You do not have to do tedious manual pattern detection an
180 USD
InitialBalance. Universal business tool from professional traders that helps to visualize interest market situations. It previews markets using a price action and sentiment in the market. Tool necessary to understand the market situation and the anticipation of further movement. Finally, you will see how traders estimate the market. Who knows the first steps in the market can estimate the point where the market will stop and reflect! With this tool, you will see important supports and resistance
44 USD
反转K线指标! 指标将主图的K线在副图中进行反转显示. 交易实用必备工具指标 波浪自动计算指标,通道趋势交易 完美的趋势-波浪自动计算通道计算 , MT4版本 完美的趋势-波浪自动计算通道计算 , MT5版本 本地跟单复制交易 Easy And Fast Copy , MT4版本 Easy And Fast Copy , MT5版本 本地跟单复制交易 模拟试用 Easy And Fast Copy , MT4 模拟账号运行 Easy And Fast Copy , MT5 模拟账号运行 The indicator of the attached figure shows that it is a mirror image of the candlestick chart of the main chart. The ordinate of the figure indicator is mirrored with the main image, and the coordinate value is a negative number. For graphic reference o
30 USD
The principle of this indicator is very simple: detecting the trend with Moving Average, then monitoring the return point of graph by using the crossing of Stochastic Oscillator and finally predicting BUY and SELL signal with arrows, alerts and notifications. The parameters are fixed and automatically calculated on each time frame. Example: If you install indicator on EURUSD, timeframe M5: the indicator will detect the main trend with the Moving Average on this timeframe (for example the Moving
135 USD
Los compradores de este producto también adquieren
TrendMaestro
Stefano Frisetti
5 (1)
note: this indicator is for METATRADER4, if you want the version for METATRADER5 this is the link: TRENDMAESTRO recognizes a new TREND in the bud, he never makes mistakes. The certainty of identifying a new TREND is priceless. DESCRIPTION TRENDMAESTRO identifies a new TREND in the bud, this indicator examines the volatility, volumes and momentum to identify the moment in which there is an explosion of one or more of these data and therefore the moment in which prices have strong probability of f
397 USD
¡Actualmente 20% OFF ! ¡La mejor solución para cualquier novato o trader experto! Este software funciona con 28 pares de divisas. Se basa en 2 de nuestros principales indicadores (Advanced Currency Strength 28 y Advanced Currency Impulse). Proporciona una gran visión general de todo el mercado de divisas. Muestra los valores de Advanced Currency Strength, la velocidad de movimiento de las divisas y las señales para 28 pares de divisas en todos los (9) marcos temporales. Imagine cómo mejorar
199 USD
FX Power MT4 NG
Daniel Stein
5 (2)
Obtenga su actualización diaria del mercado con detalles y capturas de pantalla a través de nuestro Morning Briefing aquí en mql5 y en Telegram ! FX Power MT4 NG es la nueva generación de nuestro popular medidor de fuerza de divisas, FX Power. ¿Y qué ofrece este medidor de fuerza de nueva generación? Todo lo que le encantaba del FX Power original PLUS Análisis de fuerza de ORO/XAU Resultados de cálculo aún más precisos Períodos de análisis configurables individualmente Límite de cálculo persona
169 USD
Cycle Sniper
Elmira Memish
4.41 (34)
NEW YEAR SALE PRICE FOR LIMITED TIME!!! Please contact us after your purchase and we will send you the complimentary indicators to complete the system . Cycle Sniper is not a holy grail but when you use it in a system which is explained in the videos, you will feel the difference. If you are not willing to focus on the charts designed with Cycle Sniper and other free tools we provide, we recommend not buying this indicator. We recommend watching the videos about the indiactor and system befor
199 USD
FX Volume
Daniel Stein
4.59 (34)
Obtenga su actualización diaria del mercado con detalles y capturas de pantalla a través de nuestro Morning Briefing aquí en mql5 y en Telegram ! FX Volume es el PRIMER y ÚNICO indicador de volumen que proporciona una visión REAL del sentimiento del mercado desde el punto de vista de un bróker. Proporciona una visión impresionante de cómo los participantes institucionales del mercado, como los brokers, están posicionados en el mercado Forex, mucho más rápido que los informes COT. Ver esta info
249 USD
CFF Banks Liquidity
Abdalla Mohamed Kandil
CFF Banks Liquidity     Entry signals without repainting or delays     Error-free opening of trades     Provides signals for any direction sell & Buy Join Our Public Telegram Channel for latest updates and set files.   | Our Telegram Channel How does the CFF Banks Liquidity Works? Our CFF Banks Liquidity trading system based on a very accurate "Trend-Following" Trading Strategy. Here's how to Start using our System 1.      Buy and install the indicator in your terminal. Ask the guide.
313 USD
TPA True Price Action indicator reveals the true price action of the market makers through 100% non-repainting signals (except early signals mode) strictly at the close of a candle! TPA shows entries and re-entries, every time the bulls are definitely stronger than the bears and vice versa. Not to confuse with red/green candles. The shift of power gets confirmed at the earliest stage and is ONE exit strategy of several. There are available now two free parts of the TPA User Guide for our custo
168 USD
Price Action Entry Alerts
Stephen Sanjeeve Sahayam
5 (2)
Este indicador analiza cada barra en busca de presión de compra o venta e identifica 4 tipos de patrones de velas con el volumen más alto. Estas velas luego se filtran utilizando varios filtros lineales para mostrar señales de compra o venta. Las señales funcionan mejor, junto con una dirección de marco de tiempo más alta y cuando se negocian durante horas de alto volumen. Todos los filtros son personalizables y funcionan de forma independiente. Puede ver señales de una sola dirección con el cli
225 USD
Enigmera
Ivan Stefanov
5 (1)
ENIGMERA: El núcleo del mercado https://www.enigmera.com Introducción Este indicador y sistema de negociación es un enfoque extraordinario de los mercados financieros. ENIGMERA utiliza los ciclos fractales para calcular con precisión los niveles de soporte y resistencia. Muestra la auténtica fase de acumulación y proporciona dirección y objetivos.  Un sistema que funciona tanto si estamos en una tendencia como en una corrección.  ¿Cómo funciona? ENIGMERA consta de tres líneas: la línea de s
1 800 USD
Smart Ai Levels  Accumulation & Distribution indicator Smart Ai Levels are Ai controlled indicator which is based on Wyckoff Price cycle theory . It automatically scans the Accumulation & Distribution phases on chart and Ai draws the possible areas before Mark up and Mark down which acts as hot zones and can be traded with confirmation to catch those big price movements . It's a great tool for both Reversal and Breakout Trades suitable to all Trading Styles such as Scalping - Intraday - Swing 
249 USD
Introduction to Fractal Pattern Scanner Fractal Indicator refers to the technical indicator that makes use of the fractal geometry found in the financial market. Fractal Pattern Scanner is the advanced Fractal Indicator that brings the latest trading technology after the extensive research and development work in the fractal geometry in the financial market. The most important feature in Fractal Pattern Scanner is the ability to measure the turning point probability as well as the trend probabi
180 USD
"Supply / Demand Zones" The concepts of supply and demand zones   are undoubtedly two of the most highly discussed attributes of technical analysis. Part of analysing chart of pattern , these terms are used by traders   to refer to price levels i n charts that tend to act as barriers, preventing the price of an asset from getting pushed in a certain direction. At first, the explanation and idea behind identifying these levels seems easy, but as you'll find out, supply and demand zones can co
199 USD
Volume by Price MT4
Brian Collard
5 (14)
The Volume by Price Indicator for MetaTrader 4 features Volume Profile and Market Profile TPO (Time Price Opportunity). Get valuable insights out of currencies, equities and commodities data. Gain an edge trading financial markets. Volume and TPO histogram bar and line charts. Volume Footprint charts. TPO letter and block marker charts including split structures. Positioning and styling options to suit the user's needs and context. Highlight Volume Profile and Market Profile TPO Point of Contro
259 USD
Difícil de encontrar y escasa en frecuencia, las divergencias son uno de los escenarios comerciales más confiables. Este indicador busca y escanea las divergencias regulares y ocultas automáticamente usando su oscilador favorito. [ Guía de instalación | Guía de actualización | Solución de problemas | FAQ | Todos los productos ] Fácil de comerciar Encuentra divergencias regulares y ocultas Admite muchos osciladores bien conocidos Implementa señales comerciales basadas en rupturas Muestra n
249 USD
Full STO
Roman Smoroda
Indicador STO completo (incluye todas las versiones de tres indicadores STO: Premium, Gold, Silver) - STABLE TRADE OPTION está diseñado para el comercio automático de opciones binarias.  ¡¡¡¡¡LEA CUIDADOSAMENTE!!!!! IMPORTANTE En un terminal cree dos plantillas con diferentes vencimientos, una plantilla para las 18:01, 18:02 con vencimientos de 1 a 15 minutos y una plantilla para las 22:00 con vencimientos de 10 a 20 minutos. Winrate: 71% en los últimos 5 años Gestión del dinero: 0,3% d
500 USD
ECM Channel MT4
Paulo Rocha
3 (1)
ECM Elite Channel is a volatility-based indicator, developed with a specific time algorithm, which consists of finding possible corrections in the market. This indicator shows two outer lines, an inner line (retracement line) and an arrow sign, where the channel theory is to help identify overbought and oversold conditions in the market. The market price will generally fall between the boundaries of the channel. If prices touch or move outside the channel, it's a trading opportunity. The
250 USD
Hello Dear Trader, Today Im Telling You About The "Golden Scalp System V1 " Metatrader4 Golden Scalp System Scalper with EMA   This is a  Scalper strategy   based on ( Exponential moving average) EMA . Time frame: H1 Pair: EUR/USD, GBP/USD,AUD/USD XAU/USD Platform Mt4   Indicators for Scalper with Ema: 300  EMA (Exponential Moving Average) ; 500 EMA (Expontial Moving Average); Stochastic   (5,3,3)   Long Entry 1) 300  EMA   > 500  EMA . 2) Find significant levels of support. 3) Wait for
500 USD
This indicator will help you identify the key zones needed for The Silver Bullet Strategy which are:  The three time-windows the ICT mentioned in the strategy Window 1: 3 AM and 4 AM New York time Window 2: 10 AM and 11 AM New York Time Window 3: 2 PM to 3 PM New York Time Bullish and bearish supply and demand zones which will help you identify FVG inside those time windows T he previous day's high and low, draw on liquidity The indicator does not plot the FVGs to avoid cluttering the chart  Exi
200 USD
¡Este indicador es un indicador de análisis automático de ondas perfecto para el comercio práctico! La definición estandarizada de la banda ya no es una ola de personas diferentes, y se elimina el dibujo de interferencia provocada por el hombre, que juega un papel clave en el análisis riguroso del enfoque. =>Increase the choice of international style mode, (red fall green rise style)             ¡Descuento de compra actual!   Contenido del índice: 1.         Onda básica:   Primero, enco
188 USD
Estrategia de francotirador creada para brindarle los mejores puntos de entrada para todos los pares y todos los marcos de tiempo y siempre moviéndose con la dirección de la tendencia basada en la acción del precio. una vez que domine la estrategia, le permitirá tener más confianza con su operación para que sepa cuándo abrir y cerrar su operación con el máximo beneficio porque muestra el comienzo de la tendencia con entradas múltiples, por lo que si pierde la entrada al comienzo de La estrate
750 USD
**Presentando el Sistema Inteligente Binario: Tu Compañero Definitivo de Trading** El Sistema Inteligente Binario no es solo un indicador; es una herramienta de trading sofisticada diseñada meticulosamente para empoderar a los traders con precisión precisa y señales oportunas en diversos mercados. Construido sobre una base de algoritmos de vanguardia y una exhaustiva colección de indicadores técnicos, este sistema es tu clave para desbloquear el éxito en el trading. **Componentes del Indica
450 USD
Introduction Excessive Momentum Indicator is the momentum indicator to measure the excessive momentum directly from raw price series. Hence, this is an extended price action and pattern trading. Excessive Momentum Indicator was originally developed by Young Ho Seo. This indicator demonstrates the concept of Equilibrium Fractal Wave and Practical Application at the same time. Excessive Momentum detects the market anomaly. Excessive momentum will give us a lot of clue about potential reversal and
200 USD
A. ¿Qué es A2SR ?   * Es un indicador técnico líder (sin repintado, sin retraso).   * Special event :  https://c.mql5.com/1/263/A2SR_Discount_35_percent_in_August_2023.png -- Guía : -- en https://www.mql5.com/en/blogs/post/734748/page4#comment_16532516 -- y https://www.mql5.com/en/users/yohana/blog A2SR tiene una técnica especial para determinar los niveles de Soporte (demanda) y Resistencia (oferta). A diferencia de la forma ordinaria que vimos en la red, A2SR tiene un concepto original
276 USD
BinaryScalping
Andrey Spiridonov
BinaryScalping is a professional indicator for trading binary options and scalping. The algorithm of the indicator is based on the calculation of pivot points for each time period separately, the location of the price of the trading instrument relative to the pivot points is analyzed and the probability of a trading operation is calculated. The indicator has a built-in filter of trading signals based on the global trend. The indicator is installed in the usual way and works with any trading inst
1 200 USD
Scientific trade
Aleksey Ivanov
5 (1)
An extremely convenient indicator that truly makes the process of making money on the exchange easy. It is based on the scientifically rigorous theory of the market developed by the author, the beginning of which is presented here .                The full algorithm of this indicator operation is presented in the article .               The indicator calculates the most probable price movement trajectory and displays it on the chart. Based on the predicted price movement trajectory
179 USD
Supply and Demand Dashboard PRO
Bernhard Schweigert
4.81 (21)
¡Actualmente 20% OFF ! Este tablero de instrumentos es una pieza muy poderosa de software de trabajo en múltiples símbolos y hasta 9 marcos de tiempo. Se basa en nuestro indicador principal (Mejores críticas: Advanced Supply Demand ).  El tablero de instrumentos da una gran visión general. Se muestra:  Valores filtrados de Oferta y Demanda, incluyendo la calificación de fuerza de la zona, Pips distancias a / y dentro de las zonas, Destaca las zonas anidadas, Da 4 tipos de alertas para los s
199 USD
Please send me Direct message on MQL5 CHAT after purchasing the Indicator for Training and Installation Support There are some additional files that is important to use with the Indicator . So be sure to contact me after purchasing the Indicator So that I can add you for training and support . If you find any difficulty with installation then send me Direct message here So that I can connect with you via Anydesk or Teamview for the product installation. " Smart Order Block Indicator " to find
249 USD
Introducción: En el mundo acelerado del trading de opciones binarias y forex, tener las herramientas y estrategias adecuadas a su disposición puede marcar la diferencia entre el éxito y el fracaso. Una de estas herramientas es el sistema de indicadores binarios Black Blue BBB, un enfoque revolucionario para el trading que aprovecha una combinación de patrones de gráficos, medias móviles y volumen de trading para ayudar a los traders a tomar decisiones informadas. En esta guía completa, profundiz
450 USD
En el acelerado mundo de los mercados financieros, cada segundo cuenta y cada decisión puede ser decisiva para una operación. Entra en el indicador Binary Hacker, una herramienta innovadora que está preparada para transformar la forma en que los traders analizan los movimientos de los precios, minuto a minuto. Revelando la precisión en el trading: El indicador Binary Hacker no es una herramienta de trading ordinaria. Funciona como un analizador en tiempo real, diseccionando cada minuto del gráfi
450 USD
Título: Revelando el indicador MT4 GOLDEN SUN 123 TREND_Dashboard_With_Alert En el mundo en constante evolución de los mercados financieros, los operadores buscan constantemente herramientas que les proporcionen una ventaja competitiva. En medio de esta búsqueda de precisión y rentabilidad, el indicador MT4 GOLDEN SUN 123 TREND_Dashboard_With_Alert brilla como un faro de oportunidad. Este notable indicador, diseñado para la plataforma MetaTrader 4, encapsula la esencia del comercio estratégico c
430 USD
Otros productos de este autor
El Indicador de Cuadrados de Gann es una herramienta poderosa de análisis de mercado basada en el artículo "Fórmula Matemática para Predicciones de Mercado" escrito por W.D. Gann, que se basa en conceptos matemáticos para el análisis. Incorpora elementos de las técnicas de Gann relacionadas con los cuadrados de 144, 90 y 52, así como el cuadrado de 9. Además, incluye el método del sobre cómo combinar el cuadrado de 9 con canales y patrones de estrellas. Manual del Usuario y Modo de Uso: Antes de
133 USD
Shepherd Harmonic Pattern
Abdullah Alrai
4.68 (59)
Este indicador detectará patrones armónicos que se dibujen en el gráfico mediante métodos manuales y automáticos. Puede consultar el manual del usuario en el siguiente enlace: Agregue su opinión y contáctenos para obtenerlo Existe una versión gratuita para probar este producto en mt4. Puede utilizarlo para detectar patrones de Gartley y Nenstar: https://www.mql5.com/en/market/product/30181 Puede comprar la versión completa de MT4 en: https://www.mql5.com/en/market/product/15212 Notas El indicad
133 USD
El Indicador de Cuadrados de Gann es una herramienta poderosa de análisis de mercado basada en el artículo "Fórmula Matemática para Predicciones de Mercado" escrito por W.D. Gann, que se basa en conceptos matemáticos para el análisis. Incorpora elementos de las técnicas de Gann relacionadas con los cuadrados de 144, 90 y 52, así como el cuadrado de 9. Además, incluye el método del  sobre cómo combinar el cuadrado de 9 con canales y patrones de estrellas. Manual del Usuario y Modo de Uso: Antes d
133 USD
Este indicador ha sido diseñado para integrarse con la teoría de las Ondas de Elliott, proporcionando dos métodos distintos de operación: Trabajo Automático: En este modo, el indicador opera de manera autónoma al detectar las cinco ondas motrices en el gráfico de acuerdo con la teoría de las Ondas de Elliott. Ofrece predicciones e identifica zonas potenciales de reversión. Además, tiene la capacidad de generar alertas y mensajes push para notificar a los traders sobre desarrollos significativos
88.20 USD
Indicador de Patrón de Vela Marubozu de ON Trade El patrón de vela Marubozu es un patrón de vela poderoso y directo que puede proporcionar información valiosa sobre el sentimiento del mercado y posibles cambios de tendencia. Se caracteriza por una vela con una sombra (mecha) muy pequeña o inexistente en un extremo y un cuerpo largo que se extiende en la dirección de la tendencia predominante. Este patrón representa un fuerte desequilibrio entre compradores y vendedores, lo que sugiere que el imp
FREE
Descubre un enfoque revolucionario para el trading con el Indicador Shepherd Numerology Levels. Esta innovadora herramienta combina la antigua sabiduría de la numerología con técnicas de trading de vanguardia para ayudarte a identificar niveles clave de soporte y resistencia en tus gráficos. Al utilizar el poder del método Cuadrado de Nueve, este indicador ofrece una perspectiva única sobre la dinámica del mercado, permitiéndote tomar decisiones de trading más informadas. Características Clave y
88.20 USD
Shepherd Gann Squares Free
Abdullah Alrai
4.86 (37)
Este indicador es un método de análisis de mercado basado en el artículo "Fórmula matemática para predicciones de mercado" escrito por W.D. Gann según los métodos del cuadrado de nueve y el cuadrado de 144. Manual de usuario: Add Your review And contact us to get it Puede comprar la versión MT5 completa en: https://www.mql5.com/en/market/product/28669 Puede probar en MT4 gratis: https://www.mql5.com/en/market/product/15316 Este producto puede dibujar para usted un cuadrado de
FREE
Este indicador tiene el propósito de representar visualmente el canal Donchian en tu gráfico de trading. El canal Donchian es una herramienta técnica sencilla utilizada para representar el rango entre el punto más alto y el punto más bajo durante un período específico. Este indicador mejora el análisis visual de los movimientos de precios, ofreciendo perspicacia en puntos potenciales de ruptura y continuación de tendencias. El canal Donchian puede aplicarse tanto al marco de tiempo actual como a
FREE
This indicator will detect harmonic patterns that are drawn on the chart by manual and automatic methods. You can see user manual from this link: https://www.mql5.com/en/blogs/post/719257 There is a free version (it detect only Gartley and Nenstar Patterns) to try this product. You can buy the full MT4 version from: https://www.mql5.com/en/market/product/104689 Notes When you use this indicator and change the settings, add indicators like Moving Average or Bollinger Bands, this indicator will
FREE
Indicador de Soporte y Resistencia Basado en Numerología para MetaTrader Introducción: Desbloquea una nueva dimensión en el análisis técnico con nuestro Indicador de Soporte y Resistencia Basado en Numerología para MetaTrader. Esta herramienta única aprovecha el poder de la numerología para identificar niveles clave de soporte y resistencia en tus gráficos, brindándote valiosas perspectivas sobre posibles movimientos de precios. Conceptos Clave: Numerología en el Trading: La numerología es el es
FREE
Introducing the Pivot Point Selector Indicator: Your Ultimate Tool for Custom Pivot Levels Are you ready to take your trading to the next level? Say hello to the Pivot Point Selector Indicator, a game-changing tool that puts you in control of your pivot levels. This innovative indicator empowers you to choose three specific points that will determine the pivot level calculations, giving you unparalleled customization and precision in your trading strategy. Key Features and Benefits: Custom Pivo
FREE
Presentamos el Indicador Maravilla Square: Tu Asistente para el Trading Predictivo Descubre el Indicador Maravilla Square, tu clave para el trading predictivo. Esta herramienta única ofrece conocimientos sobre las inversiones de precios, presentando una línea de tendencia que puede ajustarse entre los puntos altos y bajos. Dinámica de la Línea de Tendencia: El Indicador Maravilla Square introduce la línea de tendencia, que puedes adaptar a los puntos altos y bajos en el gráfico. Esta característ
FREE
El patrón de velas japonés Hikkake es un indicador especializado diseñado para identificar y detectar Patrones de Acción del Precio Hikkake que se están formando en un gráfico. Estos patrones se basan en el concepto de una falsa ruptura de una barra interna, lo que a menudo conduce a oportunidades de negociación potenciales. La función principal del indicador es analizar las últimas cinco velas en el gráfico y determinar si exhiben las características del patrón Hikkake. Cuando este patrón se co
30 USD
This indicator offers a comprehensive and efficient solution for traders seeking optimal entries in scalping strategies. Leveraging moving averages and stochastic indicators, it employs a systematic approach to identify favorable trade opportunities. The indicator goes beyond mere analysis, actively drawing clear and actionable entry points on your chart, denoted by arrows. Moreover, it provides the convenience of alerts to ensure you never miss these potential setups. Key Features and Benefits:
FREE
Presentando el Indicador Calculadora de Precio del Gramo de Oro ¿Le interesa estar siempre al tanto del precio del oro en su moneda local? No busque más, el Indicador Calculadora de Precio del Gramo de Oro le ofrece una innovadora herramienta que le permite calcular el precio en tiempo real del gramo de oro en su moneda local preferida. Con este indicador, puede aprovechar la perspicacia financiera para tomar decisiones informadas. Características Clave: Precio Localizado del Oro: El Indicador C
FREE
ON Trade Pivots is A technical indicator that Draws all Pivot levels depending on time frame that defined in settings. Notes It will be good tool for all traders who use pivot levels in their trades. Let me inform you that this indicator draw this level as buffers not as objects then you can connect it easily to EA. This indicator allow you to find pivots levels for any time frame not only daily you are free to choose time frame from settings. Parameters Use_System_Visuals - Enable /Disable
FREE
"Este indicador es una herramienta simple para detectar tendencias. Puedes utilizarlo junto a tu estrategia para obtener buenas entradas, como en el modo de scalping. Dibujará un canal alrededor del precio, que se expandirá a medida que aumente el tiempo. En períodos personalizados, volverá al punto de inicio de la expansión basándose en un algoritmo que considera el tiempo y el precio juntos. Puedes comprar en el límite inferior del canal después de que aparezcan signos de reversión. Y puedes
133 USD
Rsi Channel
Abdullah Alrai
5 (1)
This indicator displays the channel of Relative Strength Index. When you see that the price touches the red line and retreats from it many times, then you will know that the general trend is down. When it retreats from the blue line many times, that means that the general trend is up. This lines express the RSI values attributed to the price values on the main chart. You can add this indicator to your strategy, it will help you. This indicator will work best on 5 minutes and higher time frames.
38.20 USD
Este indicador ofrece un sólido método de análisis de mercado centrado en el concepto de 'Herramienta de Canal de Regresión'. Al aprovechar esta herramienta, los traders pueden obtener un control excepcional sobre el canal de regresión de sus gráficos, lo que les permite tomar decisiones comerciales más informadas. La Herramienta de Canal de Regresión es un instrumento poderoso en el arsenal de un trader. Está diseñada para proporcionar información valiosa sobre las tendencias de precios y los p
1 000 USD
"Presentamos nuestro poderoso indicador de Forex diseñado para mejorar tu estrategia de trading y proporcionarte precisiones en las tendencias del mercado. Esta herramienta de vanguardia emplea un algoritmo personalizado sofisticado que analiza meticulosamente las medidas de las velas, realizando ajustes para obtener una precisión óptima. ¿El resultado? Un conjunto de flechas hábilmente trazadas en tu gráfico, indicando puntos estratégicos de entrada. La genialidad detrás de este indicador radi
38.20 USD
Shepherd Gann Squares
Abdullah Alrai
4.9 (10)
Este indicador es un método de análisis de mercado basado en el artículo "Fórmula matemática para predicciones de mercado" escrito por W.D. Gann según los métodos del cuadrado de nueve y el cuadrado de 144. Manual de usuario: Add Your review And contact us to get it Puede comprar la versión MT5 completa en: https://www.mql5.com/en/market/product/28669 Puede probar en MT4 gratis: https://www.mql5.com/en/market/product/15320?source=Site +Profile+Seller#!tab=reviews Este producto
133 USD
El indicador está diseñado para detectar y visualizar las ondas de Gann en forma de diamante, un patrón específico derivado de la teoría de Gann. Proporciona a los operadores información sobre posibles inversiones del mercado al trazar puntos (P) basados en los puntos ABC del patrón. Además, el indicador traza líneas verticales desde los puntos predichos (P) para ayudar a los operadores a identificar puntos potenciales de inversión de manera más sencilla. Características del indicador: Use_Syste
61.80 USD
"Este indicador detecta las entradas basadas en la teoría del patrón Bystra y proporciona valores de entrada para colocar órdenes limitadas con niveles de objetivo y stop. Esto te permite calcular tu porcentaje de riesgo. Notas: Este indicador tiene buffers que permiten su uso en Asesores Expertos (EAs). Es importante practicar una buena gestión de dinero mientras trabajas con este producto. Cuando cambias tu marco de tiempo, El indicador guardará la plantilla usada en tu última sesión. Si neces
88.20 USD
El indicador "Fibo Star" está diseñado para visualizar los abanicos de Fibonacci en forma de estrella en tu gráfico de trading. Estos abanicos de Fibonacci son una herramienta poderosa para analizar los movimientos de precios y pueden ofrecer información sobre posibles niveles de soporte y resistencia. Este indicador cuenta con un panel de control de fácil uso, con el objetivo de simplificar el proceso de dibujo y configuración de los abanicos, ahorrándote tiempo y esfuerzo. Instrucciones de Uso
66 USD
El "Indicador de Fortaleza de Divisas" es una herramienta potente diseñada para brindar a los traders información sobre la fortaleza relativa de diversas monedas en el mercado de divisas. Al calcular y trazar la fortaleza de cada moneda en función de su marco temporal correspondiente, este indicador ofrece a los traders la oportunidad de identificar posibles oportunidades de trading, especialmente cuando se observan divergencias o cruces significativos. Características clave del indicador: 1. Cá
133 USD
Este indicador detectará patrones armónicos dibujados en el gráfico mediante métodos manuales y automáticos. Agrega tu comentario, por favor. Notas: El indicador tiene un panel de control y guardará cada configuración (gráfico y marco de tiempo). Puedes minimizarlo para tener más espacio en el gráfico y presionar el botón de cierre para ocultar todos los datos del indicador en el gráfico si prefieres trabajar con otras herramientas de análisis. Cuando uses este indicador y cambies las configurac
88.20 USD
Indicador Técnico para Detectar Patrones de Acción del Precio Fuertes: Pin Bar, Inside Bar y Outside Bar Introducción: En el ámbito del análisis técnico, los patrones de acción del precio son indicadores vitales de posibles movimientos en el mercado. Hemos desarrollado un sofisticado indicador técnico que agiliza la identificación de patrones sólidos de acción del precio en gráficos. Nuestro indicador se especializa en detectar tres patrones esenciales: el Pin Bar, el Inside Bar y el Outside Bar
38.20 USD
Unlock Hidden Insights with the Numerokh Indicator: Your Numerology-Based Support and Resistance Tool Introducing the Numerokh indicator, a revolutionary tool that brings the mystical world of numerology into the realm of trading. Imagine having the power to identify key support and resistance levels on your charts using the age-old wisdom of numerology. This indicator takes trading to a new dimension, offering you a unique way to analyze price movements and make informed trading decisions. Key
38.20 USD
Presentamos el Indicador ON Trade Numerology Mirror: Revelando Patrones de Reversión Ocultos a través de la Numerología Descubre una nueva dimensión en el análisis técnico con el Indicador ON Trade Numerology Mirror. Esta innovadora herramienta aprovecha la antigua sabiduría de la numerología para identificar niveles clave de reversión de precios en tus gráficos. Al reorganizar los números en posiciones espejadas, este indicador revela patrones ocultos que tienen el potencial de señalar importan
88.20 USD
Introducing the ON Trade Melad Pattern Indicator: Enhance Your Trading Strategy with Breakout Patterns Discover the power of the ON Trade Melad Pattern Indicator—an intuitive tool designed to elevate your trading decisions by detecting and highlighting breakout patterns on your charts. This indicator is your key to identifying crucial breakout points and potential trend shifts with simplicity and precision. Key Features: Breakout Pattern Detection: The ON Trade Melad Pattern Indicator foc
30 USD
Filtro:
ahmed nabil
23
ahmed nabil 2023.09.29 14:15 
 

good one

Abdullah Alrai
97839
Respuesta del desarrollador Abdullah Alrai 2023.09.29 14:19
Thanks
rumbacillo
24
rumbacillo 2023.09.20 09:34 
 

This indicator is priceless and provides solid guidance to trade every symbol. Thanks for coding it

Abdullah Alrai
97839
Respuesta del desarrollador Abdullah Alrai 2023.09.20 09:35
Thank you mr for your kind words
fligods
288
fligods 2023.09.12 20:54 
 

El usuario no ha dejado ningún comentario para su valoración

Abdullah Alrai
97839
Respuesta del desarrollador Abdullah Alrai 2023.09.12 20:55
Thank you sir
SALAH198889
15
SALAH198889 2023.09.06 12:52 
 

El usuario no ha dejado ningún comentario para su valoración

Abdullah Alrai
97839
Respuesta del desarrollador Abdullah Alrai 2023.09.06 12:57
Thank you mr Salah for your kind words
Respuesta al comentario
Versión 1.1 2023.10.21
- improvements