• 概述
  • 评论 (4)
  • 评论 (1)
  • 新特性

ON Trade Optuma Astro

5

当然可以!以下是您提供的文本的中文翻译:

引入 MT4 天文指标:您的终极天体交易伙伴

您准备好将交易体验提升到天文高度了吗?不用再寻找,就在我们的革命性 MT4 天文指标中。这个创新工具超越了传统的交易指标,利用复杂的算法提供无与伦比的天文洞察力和精确计算。

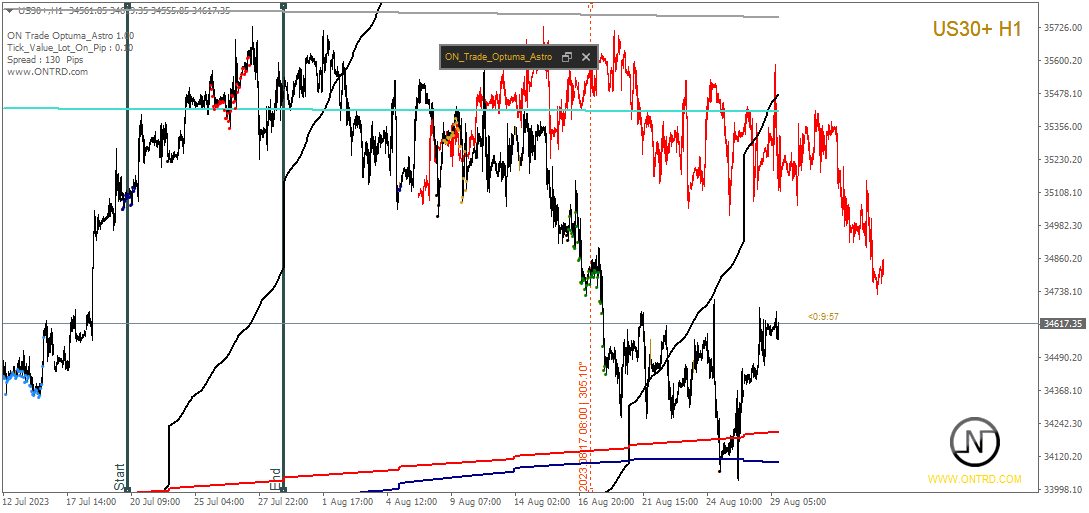
指尖上的宇宙信息: 瞻仰一个详尽的面板,展示了一宝藏般的天文数据。了解行星的地理/太阳心坐标,太阳/地球距离,亮度,伸长度,星座,黄道和赤道坐标,甚至是水平坐标——每个细节都经过精心计算并呈现得美轮美奂。指标生成的垂直线对应于时间值,为您的交易旅程提供了宇宙的视角。

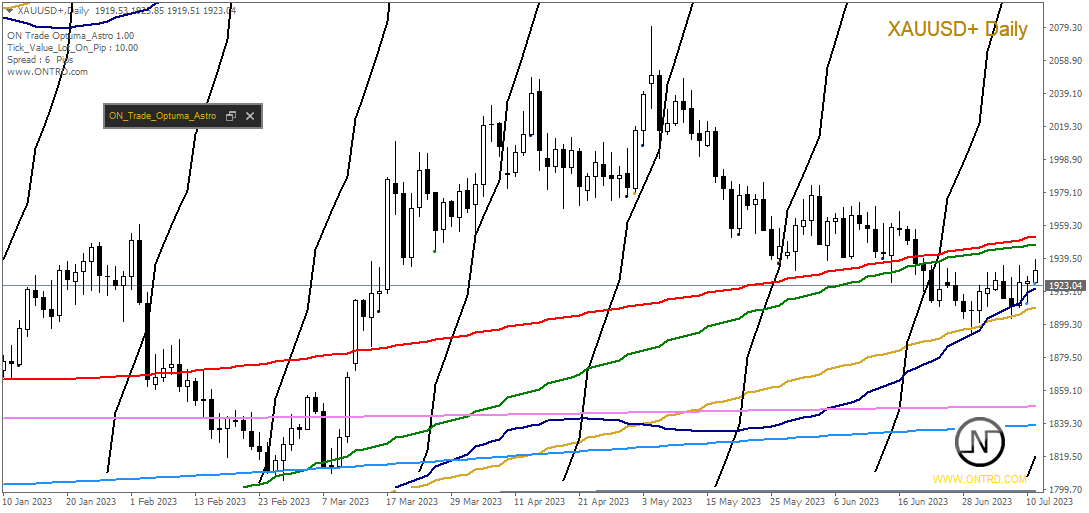
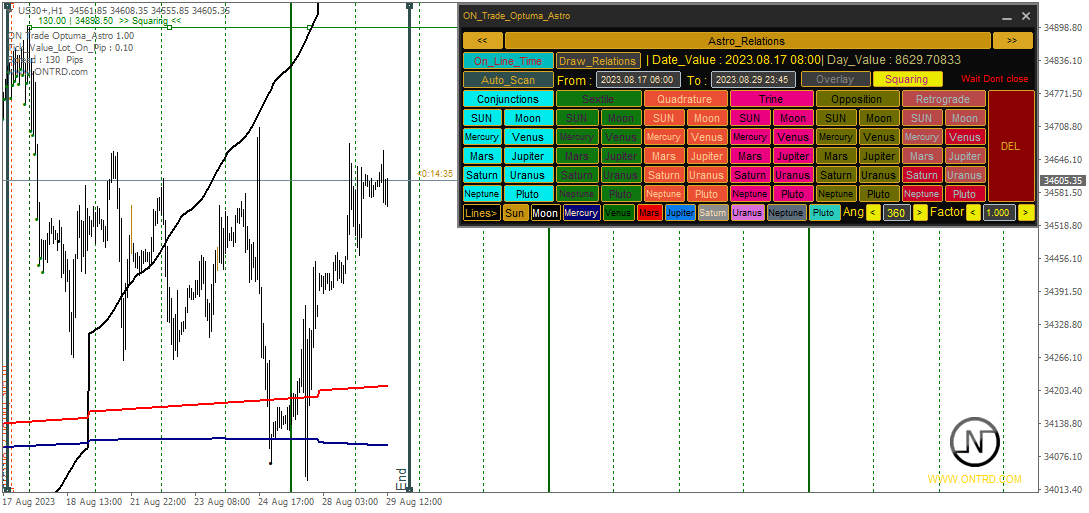
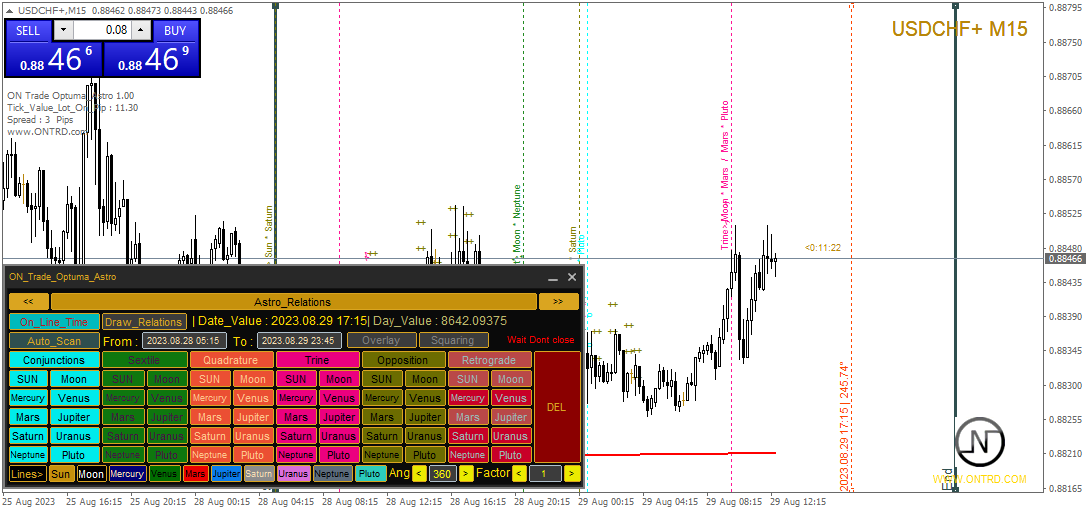
行星线条与关系: 在您的图表上欣赏行星线条的魔力,具有可自定义的比例和角度。通过直观的控制面板轻松切换每个行星线条的可见性。通过连结、六分、四分、三分、对冲和逆行等指标,发现行星关系的艺术。在您选择的时间范围内探索这些宇宙构造,使您能够识别重要的交易机会。

揭示甘恩的智慧: 通过受甘恩启发的平方垂直线揭示潜在的反转时机。这种创新修改将甘恩历经考验的原则带入现实,帮助您提前了解市场的转向和趋势。

月亮引导: 在您的图表上优雅地导航月相,因为新月和满月点缀其间。月亮周期在交易中发挥着重要作用,我们的指标确保您不会错过任何重要时刻。

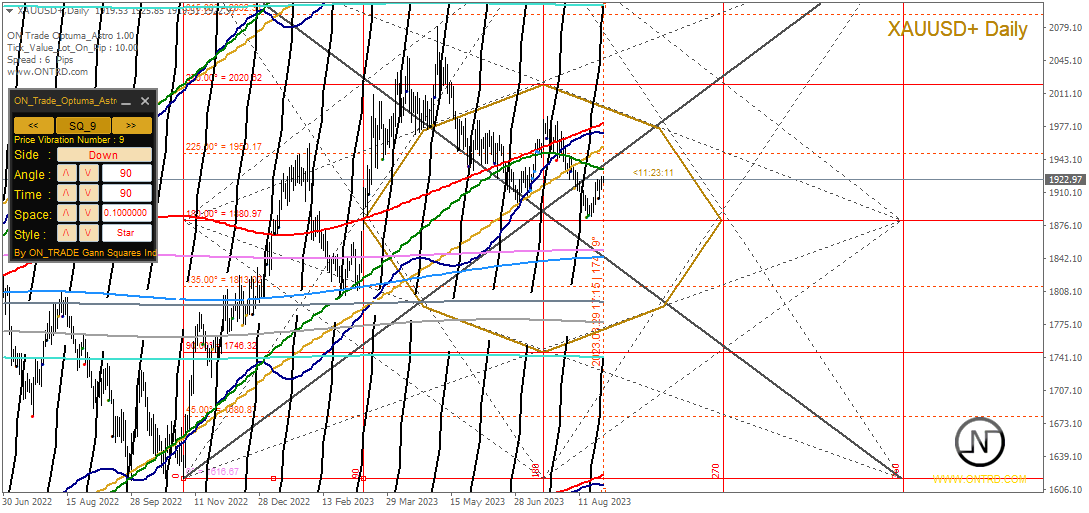
九宫格优势: 利用九宫格面板丰富您的天文分析。这个古老的工具已经无缝地融入,为您提供有关价格和时间关系的独特视角。

行星角度时间: 通过行星角度时间功能,踏上穿越天际的旅程。轻松调整角度,深入宇宙,将您的交易决策与天体智慧相结合。

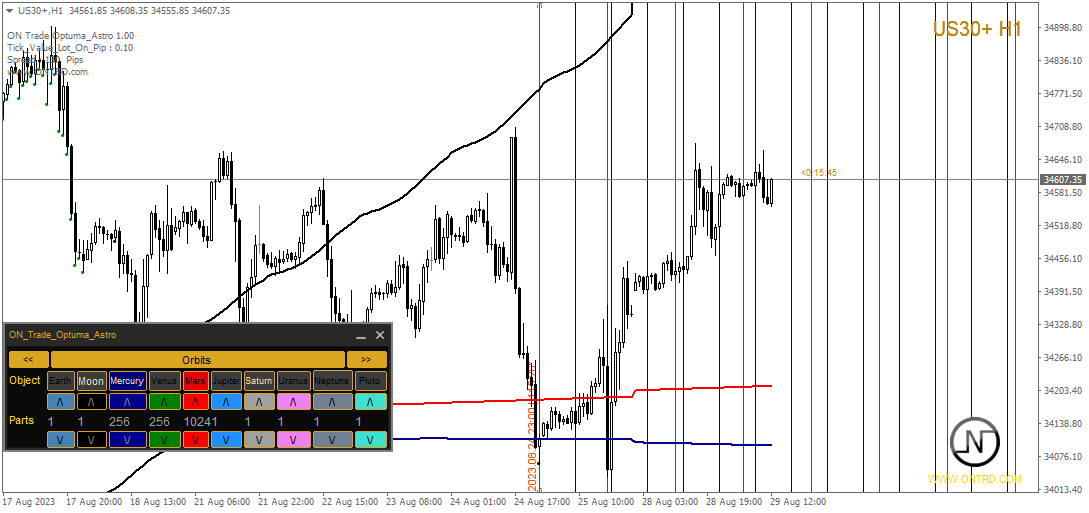
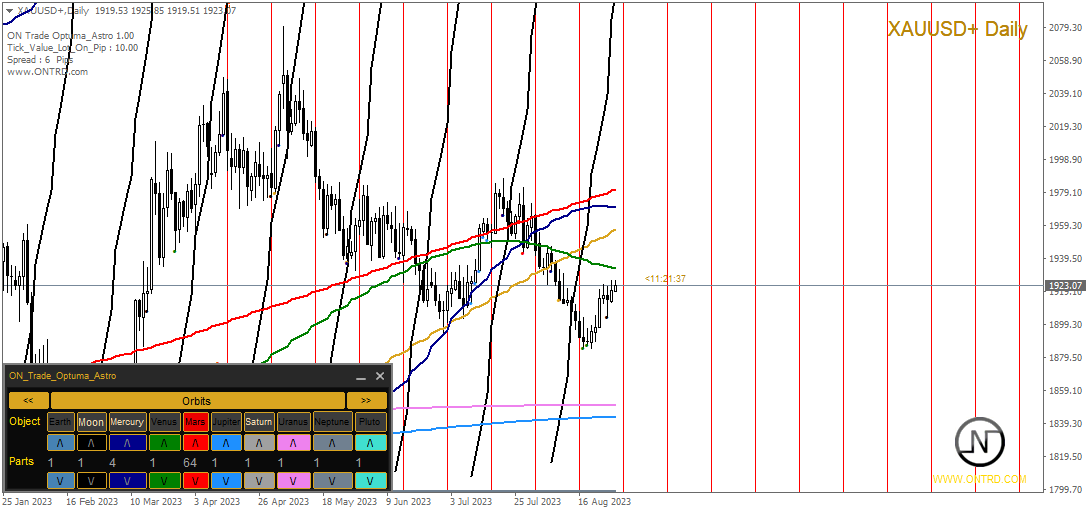
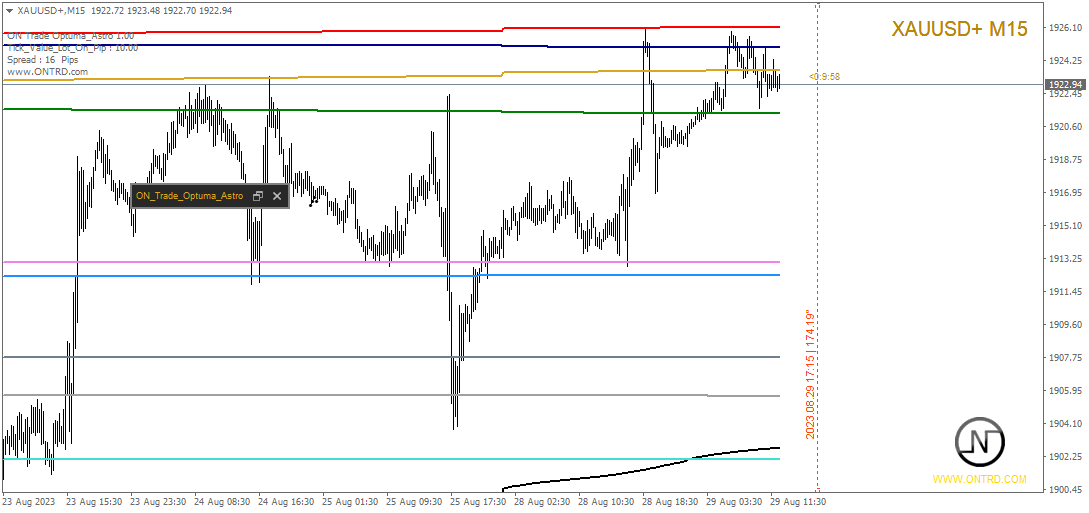
轨道与更多: 见证轨道功能的巧妙之处,它在图表上绘制出轨道时间分隔线,无论是日常还是当前图表。指标的账户信息面板通过强大的手数计算器和警报功能补充其特性,确保您始终掌控局势。

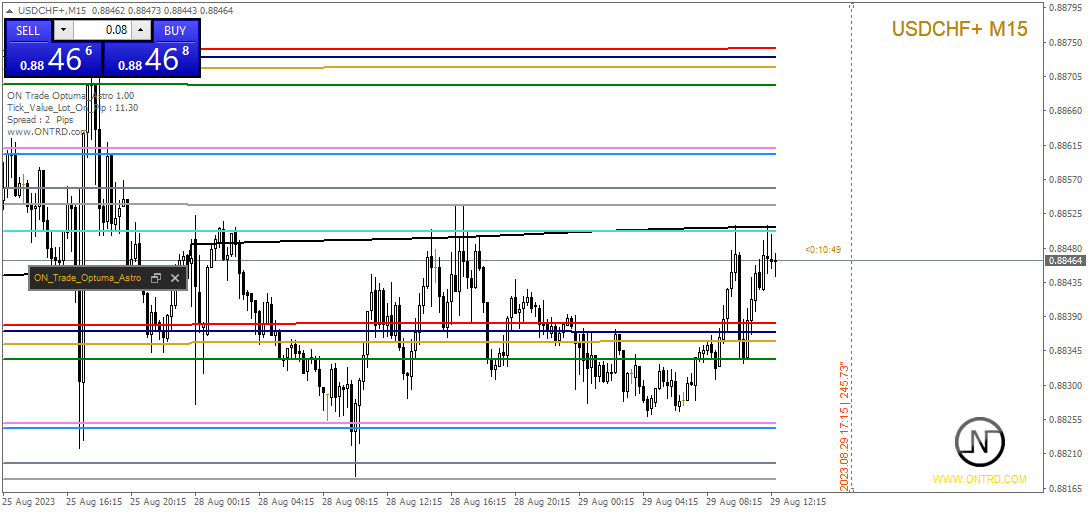
抓住星星: 通过提供清晰度和精确度的覆盖功能,驾驭交易宇宙。每个功能都可以轻松访问,通过直观的控制面板,您可以保存所选的首选设置,为个性化的交易旅程打下基础。

光明的未来在等待着: 这款天文指标标志着一个新时代的开始。在您充分发挥其潜力的同时,请记住这只是一个开始。更新正在前方,愿景是将其确立为市场中首屈一指且无与伦比的产品。

一点重要说明: 虽然该指标不支持回测,但请放心,其功能已经被准确地捕捉在附加的视频和图片中。在其中见证其动态能力。

您的评价至关重要: 当您踏上这个宇宙交易之旅时,请通过评价分享您的体验。您的反馈推动我们追求卓越。

拥抱星星,捕捉行星,自信地航行于宇宙之中。MT4 天文指标是您在交易世界中的指引之光,将深奥与实用融为一体,以天体精确性和财务敏锐度的和谐舞蹈方式,助您做出明智的交易决策。


评论 4
ahmed nabil
23
ahmed nabil 2023.09.29 14:15 
 

good one

rumbacillo
24
rumbacillo 2023.09.20 09:34 
 

This indicator is priceless and provides solid guidance to trade every symbol. Thanks for coding it

推荐产品
Forex Gump
Andrey Kozak
2.83 (6)
Forex Gump is a fully finished semi-automatic trading system. In the form of arrows, signals are displayed on the screen for opening and closing deals. All you need is to follow the instructions of the indicator. When the indicator shows a blue arrow, you need to open a buy order. When the indicator shows a red arrow, you need to open a sell order. Close orders when the indicator draws a yellow cross. In order to get the most effective result, we recommend using the timeframes H1, H4, D1. There
69 USD
Position
Jinxiong Yuan
Positon index is the cyclical index of market trend movement, and Positon's value ranges from 0 to 100. When Positon value is below 10, it means that the market is in extreme decline, the market atmosphere is extremely pessimistic, and the market is about to hit bottom and turn around. When Positon value is above 80, it means that the market is in extreme excitement, the market atmosphere is extremely bullish, the market is about to peak and there is a sharp decline.
30 USD
Sto Signal AM
Andriy Matviyevs'kyy
This indicator displays Stochastic osc signals on the price chart and allows the user to receive notifications of such signals. The Stochastic indicator is a classic and proven indicator of the technical analysis of the markets. Despite its age, it is still relevant today. Depending on the settings, the indicator allows you to work effectively on various TFs and any markets. Signals are given on fully formed bars and are not redrawn. Custom Parameters: Stochastic_Price (0-1) - The applied pric
FREE
Target Striking
Dmitriy Kashevich
Target Striking - One of the best binary options trading tools! It is set up so powerfully that you can trade not only on currency pairs, but also on raw gold oil! You can also try on cryptocurrency! Ideal for trading on currency pairs, the percentage of reliable transactions is more than + 75% The trading tool is already set for the best profit! Only Target Striking can unlock the potential of the trading market for you! With it, the signals are even and accurate without redrawing,
1 650 USD
Breakout Monster Mini
Abdulfattah Yahya Mohammed Alhazmi
It is a very profitable EA, to trade trends breakout, and manage trades, takeprofit, stoploss, move to breakeven, and trailing stop. I work with this EA, and the reversal/pullback version since 2014.  This is a demo   version of the full   Breakout Monster EA . It works on Real and Demo accounts. Demo version restrictions: Money Management is disabled. Lot size is restricted to 0.01 lots only (Or the minimum allowed by broker). Numerical, SL and TP set to 100 pips. They cannot be modified i
FREE
Trading is a trade war So traders are warriors. A warrior needs a weapon. The Scalping One Plus A1 is a powerful weapon. Extremely accurate This tool can be customized as you like. Who deserves such an accurate weapon? 1. People who want profits From binary options trading 2. Those who want to trade short, profit fast 3. People who want long-term can do it. 4. Beginners can use it. 5. Old hand works very well. How it works It works very easy. For binary options Time frame M1 or M5 and exp
399 USD
Infinity Trend Pro
Yaroslav Varankin
1 (1)
This is a trend indicator without redrawing Developed instead of the binary options strategy (by the color of the Martingale candlestick) Also works well in forex trading When to open trades (binary options) A signal will appear in the place with a candle signaling the current candle It is recommended to open a deal for one candle of the current timeframe M1 and M5 When a blue dot appears, open a deal up When a red dot appears, open a trade down. How to open trades on Forex. When a signal is rec
1 000 USD
Market Structure Zig Zag
Lesedi Oliver Seilane
4.69 (13)
Free Market structure zig zag to assist in price action trading the screenshots describe how to use and how to spot patterns new version comes with alerts, email alert and  push notification alert can be used on all pairs  can be used on all timeframes  you can add additional confirmation indicators the indicator shows you your higher high and low highs as well as your lower lows and lower highs  the indication makes price action analysis easier to spot.
FREE
Binary Option Signal
Yaroslav Varankin
Indicator for binary options arrow is easy to use and does not require configuration works on all currency pairs, cryptocurrencies buy signal blue up arrow sell signal red down arrow tips do not trade during news and 15-30 minutes before their release, as the market is too volatile and there is a lot of noise it is worth entering trades one or two candles from the current period (recommended for 1 candle) timeframe up to m 15 recommended money management fixed lot or fixed percentage of the depo
100 USD
Shark Deal Book
Philip Pankaj Suthagar
4 (3)
Term  "shark"  in the business world denotes a high volume investor who just made a good investment in a highly Potential business deal.So, sharks are the ones who make the market move. In our case, if an American shark bought a Japanese company, he/she has to convert American dollars into Japanese yen to make the deal. So, the demand for the Japanese yen will increase sharply. Thus USD/JPY will go short rapidly if the deal was from the shark. Another example, In the case of forex, if fed increa
199 USD
RNN Pro
Shahryar Yeganeh Hajahmadi
Experience Revolutionary Trading with the Updated RNN Ai – Now with Enhanced Pattern Recognition [USDJPY 1M] We are thrilled to announce the newest update for the RNN Ai, a pinnacle of trading software renowned for its sustained performance over 48 months with minimal drawdowns. We've taken a bold step forward by transitioning from the grid strategy to a more refined pattern recognition approach, optimizing your trading experience to unprecedented levels. Explore the MT4 compatible version of RN
22 500 USD
Utility for show on charts the visual informations about: - a vertical line at start of each bar of selected timeframe - a vertical line at start of each day - a vertical line at start of each week - vertical lines at start / end of trading sessions selected - bid / ask prices, spread, money value for each point (of 1 standard lot) and last tick time recived" You can enable / disable each information and set the color for each line
FREE
SRP Pro
Farhad Kia
5 (1)
Strong Retracement Points Pro edition! SRP (Strong Retracement/Reversal Points) is a powerful and unique support and resistance indicator. It displays the closest important levels which we expect the price retracement/reversal! If all level are broken from one side, it recalculates and draws new support and resistance levels, so the levels might be valid for several days depending on the market! If you are still hesitating to start using this wonderful tool, you can check this link to see how ef
400 USD
RSI Currency Strength Meter uses RSI (Relative Strength Index) to monitor how strong a currency is, or in other words, if it's being bought or sold by the majority compared to the other currencies. It displays the strength-lines of the currencies of the pair (base and counter currency of the chart) with changeable solid lines. Also, you can add up to ONE additional currency (only 1 in the DEMO version, in REAL up to 5) to the "comparison pool" that already has the base and the profit (counter) c
FREE
Elliott Wave Trend MT4
Young Ho Seo
4 (7)
Elliott Wave Trend was designed for the scientific wave counting. This tool focuses to get rid of the vagueness of the classic Elliott Wave Counting using the guideline from the template and pattern approach. In doing so, firstly Elliott Wave Trend offers the template for your wave counting. Secondly, it offers Wave Structural Score to assist to identify accurate wave formation. It offers both impulse wave Structural Score and corrective wave Structure Score. Structural Score is the rating to sh
200 USD
Gecko
Profalgo Limited
4.4 (10)
NEW PROMO: Only a few copies copies available at 349$ Next price: 449$ Make sure to check out our " Ultimate EA combo package " in our   promo blog ! Gecko runs a simple, yet very effective, proven strategy.  It looks for important recent high and lows and will trade the breakouts.  The actual execution of this strategy however, is what makes this EA truly shine.  Entry calculations and exit algorithms are not only unique but also very advanced. LIVE RESULTS: https://www.mql5.com/en/signals/7
149 USD
Chart Patterns Detect 15 patterns (Ascending Triangle, Descending Triangle, Rising Wedge, Falling Wedge, Bullish Flag, Bearish Flag, Bullish Rectangle, Bearish Rectangle Symmetrical triangle, Head and Shoulders, Inverted Head and Shoulders, Triple top, Triple Bottom, Double Top, Double Bottom) Use historical data to calculate the probability of each pattern to succeed (possibility to filter notification according to the chance of success) gives graphic indication about the invalidation level and
58 USD
Ticks Size
Viktor Kolmakov
This indicator displays in a separate window the difference between the number of points which increased the price, and the number of points that decreased the price during the time interval specified in the settings. The time interval for calculation is expressed as the number of bars of the chart the indicator is attached to. This approach allows you to evaluate the movement direction (growth or fall) of the instrument's price, the strength of the movement and the size of the movement in point
1 200 USD
Mega Super
Mati Maello
This indicator Mega Super indicator.Indicator displays trend movement. Indicator helps to buy and sell.In dicator displays arrow and line. Features per - displays indicator period. How to understand the status: If the arrow color is green, trend is up. I f the arrow color is red, trend is down. //////////////////////////////////////////////////////////////////////////////////////////////////////////////////////////////////////////////////// //////////////////////////////////////////////
60 USD
This is the FXTraderariel TrendTrader .It analysis the trend and displays it, due to changing the changing the candle color. It took me over 12 Year to develop this system. But it shows the market perfect. Very easy to follow, even for beginners. It works on all Pairs and all Timeframes (however we advice only pro traders to trade smaller Timeframes, novice traders should stick to higher TF like H4 and D1). Depending on the settings it and trading style, it can be used for scalping or long-t
1 000 USD
LordAutoFibonnaci
Igor Pereira Calil
5 (1)
Lord Auto Fibonnaci is a free indicator for Meta Trader, in order to show the most famous chart in the financial market known as "Fibonnaci". As we can see in the images below, the fibonnaci table will automatically analyze the graph for you, with trend factors through percentage, almost infallible use, you can always work when the percentage is low or high, start shopping and sales on time, great for analyzing entries! In the images below we can see an example in gold in H4, where we are a
FREE
EZ Binary USJP Pair
Tuan Anh Dao
4 (2)
The indicator allows you to trade binary options. The recommended time frame is М1 and the expiration time is 1,2,3 minutes. The indicator suitable for auto and manual trading. A possible signal is specified as a arrows above/under a candle. You should wait until the candle closes! Arrows are not re-painted Trade sessions: TOKYO section (Half-end) Currency pairs: USD/JPY Working time frame: M1 Expiration time: 1,2,3 minutes. The indicator also shows good results when using the martingale strateg
FREE
When it comes to trading in the financial markets, there's no question that the banks have a major advantage. They have access to vast amounts of resources, including high-powered trading algorithms, in-depth market research, and teams of experienced traders. But what if you could level the playing field and trade like the banks do? That's exactly what our Smart Money Indicator allows you to do. By providing you with critical insights into market structure and supply and demand zones, you can ma
2 200 USD
"该指标基于Bystra模式理论检测入场点,并提供放置限价单的入场值,带有目标和止损水平。这使您能够计算您的风险百分比。 注意事项: 该指标具有允许在专家顾问(EAs)中使用的缓冲区。 在使用此产品时,务必进行良好的资金管理。 当您更改时间框架时, 指标将保存在上次会话中使用的模板。 如果您需要一本书来学习这种方法,请在购买后与我们联系并分享您的评论。 参数: 使用系统视觉效果 - 启用/禁用此产品的视觉主题。 相对速度 - 启用/禁用仅在最后一波的快速运动中检测模式。 显示最后一根蜡烛计时器 - 启用/禁用蜡烛计时器。 蜡烛计时器颜色 - 蜡烛计时器文本的颜色。 多头模式颜色 - 多头模式的颜色。 空头模式颜色 - 空头模式的颜色。 发送警报 - 启用/禁用警报。 发送通知 - 启用/禁用移动平台的推送通知。 发送电子邮件 - 启用/禁用电子邮件警报。 显示目标 - 启用/禁用在图表上显示目标。 历史条数 - 最大历史条数。" 如果您有更多问题或需要进一步帮助,请随时问我!
88.20 USD
TPO Profile MT4
Kyra Nickaline Watson-gordon
5 (1)
Definition : TPO is a Time Price Opportunity. Instead of using bars or candles with an Open, High, Low, and Close price, each "bar" in a Market Profile is represented by horizontal bars against the price It is called Market Profile terminology. In other words time-price-opportunity (TPO) profiles are histograms of how much time was spent at each price within the span of the profile. By using a TPO chart, you are able to analyze the amount of trading activity, based on time, for each price lev
60 USD
Introduction to Chart Pattern MT Chart Pattern MT is a chart pattern scanner to detect the triangle pattern, falling wedge pattern, rising wedge pattern, channel pattern and so on. Chart Pattern MT uses highly sophisticated chart pattern detection algorithm. However, we have designed it in the easy to use with intuitive user interface. Chart Pattern MT will show all the patterns in your chart in the most efficient format for your trading. You do not have to do tedious manual pattern detection an
180 USD
InitialBalance. Universal business tool from professional traders that helps to visualize interest market situations. It previews markets using a price action and sentiment in the market. Tool necessary to understand the market situation and the anticipation of further movement. Finally, you will see how traders estimate the market. Who knows the first steps in the market can estimate the point where the market will stop and reflect! With this tool, you will see important supports and resistance
44 USD
反转K线指标! 指标将主图的K线在副图中进行反转显示. 交易实用必备工具指标 波浪自动计算指标,通道趋势交易 完美的趋势-波浪自动计算通道计算 , MT4版本 完美的趋势-波浪自动计算通道计算 , MT5版本 本地跟单复制交易 Easy And Fast Copy , MT4版本 Easy And Fast Copy , MT5版本 本地跟单复制交易 模拟试用 Easy And Fast Copy , MT4 模拟账号运行 Easy And Fast Copy , MT5 模拟账号运行 The indicator of the attached figure shows that it is a mirror image of the candlestick chart of the main chart. The ordinate of the figure indicator is mirrored with the main image, and the coordinate value is a negative number. For graphic reference o
30 USD
The principle of this indicator is very simple: detecting the trend with Moving Average, then monitoring the return point of graph by using the crossing of Stochastic Oscillator and finally predicting BUY and SELL signal with arrows, alerts and notifications. The parameters are fixed and automatically calculated on each time frame. Example: If you install indicator on EURUSD, timeframe M5: the indicator will detect the main trend with the Moving Average on this timeframe (for example the Moving
135 USD
This indicator converted from 5 min Buy and Sell Range Filter - guikroth version on TradingView original Script : Popularity of the Range Filter The Range Filter is a very popular and effective indicator in its own right, with adjustments to the few simple settings it is possible to use the Range Filter for helping filter price movement, whether helping to determine trend direction or ranges, to timing breakout or even reversal entries. Its practical versatility makes it ideal for integrat
39 USD
该产品的买家也购买
目前八折优惠! 对任何新手或专家交易者来说都是最好的解决方案! 这个仪表板软件适用于28种货币对。它基于我们的两个主要指标(高级货币强度28和高级货币冲动)。它对整个外汇市场提供了一个伟大的概述。它显示高级货币强度值,货币运动速度和28个外汇对在所有(9)时间段的信号。想象一下,当你可以使用图表上的单一指标观察整个市场,以确定趋势和或剥头皮的机会时,你的交易将得到改善 我们已经在这个指标中建立了一些功能,使你更容易识别强势和弱势货币,同时识别和确认潜在的交易。该指标以图形方式显示货币的强势或弱势是增加还是减少,以及它在所有时间段的表现。 增加的新功能是动态市场斐波那契水平,它适应当前的市场条件变化,这是一个已经在我们的高级货币强度28和高级货币冲动指标中使用的成熟的加分项。 在交易时,总是将弱势货币和强势货币配对,这个新指标将帮助你做到这一点。 用户手册:点击这里  https://www.mql5.com/en/blogs/post/708783 特点  显示每个时间段的ACS28和GAP-speed(冲动)的货币强度值。 列:颜色代码以7种颜色
199 USD
TrendMaestro
Stefano Frisetti
5 (1)
note: this indicator is for METATRADER4, if you want the version for METATRADER5 this is the link: TRENDMAESTRO recognizes a new TREND in the bud, he never makes mistakes. The certainty of identifying a new TREND is priceless. DESCRIPTION TRENDMAESTRO identifies a new TREND in the bud, this indicator examines the volatility, volumes and momentum to identify the moment in which there is an explosion of one or more of these data and therefore the moment in which prices have strong probability of f
397 USD
FX Power MT4 NG
Daniel Stein
5 (2)
通过 mql5 和 Telegram 上 的晨间简报获取每日市场更新,包括详细信息和屏幕截图 ! FX Power MT4 NG 是我们长期以来非常受欢迎的货币强度计算器 FX Power 的下一代产品。 这款下一代强度计算器能提供什么?您所喜爱的原版 FX Power 的所有功能 附加功能 黄金/XAU 强度分析 更精确的计算结果 可单独配置的分析周期 可自定义计算限制,以获得更好的性能 为希望查看更多信息的用户提供特殊的多实例设置 无尽的图形设置,可在每个图表中设置您最喜欢的颜色 无数的通知选项,让您再也不会错过任何重要信息 采用 Windows 11 和 macOS 风格的全新圆角设计 神奇的移动指标面板 FX Power 主要功能 所有主要货币的完整强势历史 所有时间框架内的货币强弱历史 所有经纪商和图表的计算结果完全相同 100% 可靠的实时计算 -> 无重绘 可通过下拉列表选择分析时段 通过自定义模式单独配置分析时段 可在一个图表中使用多个实例 可移动 FX Power 显示屏(通过拖放) 适用于高分辨率 QHD、UHD 和 4K 显示器 自动终端配置 针对平板电脑
169 USD
Cycle Sniper
Elmira Memish
4.41 (34)
NEW YEAR SALE PRICE FOR LIMITED TIME!!! Please contact us after your purchase and we will send you the complimentary indicators to complete the system . Cycle Sniper is not a holy grail but when you use it in a system which is explained in the videos, you will feel the difference. If you are not willing to focus on the charts designed with Cycle Sniper and other free tools we provide, we recommend not buying this indicator. We recommend watching the videos about the indiactor and system befor
199 USD
Weis Wave with Alert
Trade The Volume Waves Single Member P.C.
4.78 (18)
Rental/Lifetime Package Options and Privileges' * For optimum results the yearly or lifetime package is suggested due to live training and Discord  channel trading with the  creator! Rent Monthly Six Months   Yearly/Lifetime Weis Wave with Speed with Alert+Speed Index x x x Manual  x x x Quick Set up Video x x x Blog x x x Lifetime Updates x x x Setup and Training Material x x Free Rectangle Break Alert Tool      x Discord Access Channel "The SI traders" x 2-hour live methodology traini
599 USD
FX Volume
Daniel Stein
4.59 (34)
通过 mql5 和 Telegram 上 的 " 晨间简报 "获取每日市场更新,包括详细信息和屏幕截图 ! 外汇交易量(FX Volume)是第一个也是唯一一个从经纪商角度真正洞察市场情绪的交易量指标。 直接在您的图表上看到这些信息是真正改变游戏规则和突破性的交易解决方案。 受益于独特的市场数据洞察,如 比率(Ratios )显示货币多头和空头头寸的比率(百分比 比率变化 显示所选时间段内的多头比率及其百分比变化 总交易量 显示货币的总交易量(多头和空头),以手为单位 多头 交易量显示货币所有多头头寸的交易量 空头 交易量显示所有货币空头头寸的交易量 净多头 显示净多头交易量,即所有多头头寸减去所有空头头寸(以手为单位)。 净多头百分比 显示货币净多头交易量的变化 请阅读我们的基本教程 -> "如何使用外汇交易量进行交易 " 获取更多信息,如常见问题、交易技巧和教程视频,请访问我们的 外汇交易量公共信息频道 请 安装并运行 SI Connect 以建立与我们数据中心的持续连接 背景信息 我们都知道,外汇是一个分散的市场。这就是为什么我们必须打破常规思维,开发一个独
249 USD
TPA True Price Action indicator reveals the true price action of the market makers through 100% non-repainting signals (except early signals mode) strictly at the close of a candle! TPA shows entries and re-entries, every time the bulls are definitely stronger than the bears and vice versa. Not to confuse with red/green candles. The shift of power gets confirmed at the earliest stage and is ONE exit strategy of several. There are available now two free parts of the TPA User Guide for our custo
168 USD
Price Action Entry Alerts
Stephen Sanjeeve Sahayam
5 (2)
该指标筛选每个柱的买入或卖出压力,并识别 4 种具有最高交易量的蜡烛形态。然后使用多个线性过滤器过滤这些蜡烛以显示买入或卖出信号。结合更高的时间框架方向以及在高交易量时段进行交易时,信号效果最佳。所有过滤器都是可定制的并且独立工作。单击按钮即可查看单个方向的信号。 该指标还包含最重要的价格行为和智能货币概念,可以帮助您的决策过程。 信号和交易教育集于一工具之中。 特征 : 信号不会重新绘制。 识别吞没蜡烛、拒绝蜡烛、扩展范围蜡烛和 Pinbar 蜡烛。 显示每个有效信号的多个入场点、止损和多个止盈水平。 按高容量会话进行过滤。 按支撑/阻力位和蜡烛结构过滤。 按 MACD 柱状图过滤。 ICT 买方和卖方流动性水平(亚洲突袭/伦敦突袭/犹大摇摆)。 洁净空间或间隙检测。 识别停止搜寻级别。 基于纯粹的价格行为自动绘制支撑/阻力位。 前一日高点和前日低点。 心理数字和整点、半点和四分之一点的图表水平。 显示基于动态移动平均线的价格交叉和回调。 每日开盘价。 识别 HH、HL、LL 和 LH 点。 内置蜡烛倒计时和符号传播。 内置损益信息面板。 私人导师小组访问。 包括教育、分析和支
225 USD
Enigmera
Ivan Stefanov
5 (1)
ENIGMERA:市场核心 https://www.enigmera.com 简介 该指标和交易系统是金融市场的一种非凡方法。ENIGMERA 利用分形周期精确计算支撑位和阻力位。它能显示真实的累积阶段,并给出方向和目标。 该系统无论在趋势中还是在修正中都能发挥作用。 它是如何运行的? ENIGMERA 由三条线组成:支撑/阻力线、目标线和偏离线。与一般市场指标将过去的数据推断为现在和未来的情况不同,该系统能提供当前的完整情况。如果你处于支撑位,这意味着真正的支撑;如果你处于阻力位,这意味着真正的阻力。如果突破某一水平,则表示趋势发生变化。没有重绘。 由于市场在不断变化,ENIGMERA 不断调整其评估工具,定期修改策略。  这保证了每种情况都能得到全面评估。这一市场指标的独特性显而易见,其能力不言而喻。  ENIGMERA 为金融分析师和咨询师提供服务,他们需要可靠的见解与客户分享,也为投资者提供服务,他们需要最精确和最可靠的保证。 该系统能够达到最佳精度,使交易者能够自信、清晰地评估他们的选择。 ENIGMERA 将 20 年的交易专长和知识整合到一个综合软件
1 800 USD
Entry Points Pro
Yury Orlov
4.7 (224)
这是一款 MT4 的趋势指标,可提供准确的入场交易信号,且无重绘或延迟。 它可应用在任何金融资产:外汇、加密货币、贵金属、股票、指数。 最好的结果出现在 M15+ 的时间帧内。 指标的 MT5 版本 重要! 购买后请联系我,以便获取详细指南和奖励。 视频 (6:22) - 一个信号赢取的利润等于指标价格的三倍。 视频 (4:44) - 它如何在测试器中工作,我的提示和技巧。 视频 (1:44) - 有关它如何处理加密货币和指数的几句话。 大多数交易者在 Entry Points Pro 指标的帮助下,在第一个交易周内就改善了他们的交易结果。 Entry Points Pro 指标的益处 入场信号无重绘或延迟 如果信号出现,并得到确认(如果信号所在烛条已收盘),则它不会再消失;不像是重绘指标,它会导致重大的财产损失,因为它们可以在显示信号后再将其删除。 无差错开仓 指标算法可令您找到入场交易(买入或卖出资产)的理想时机,从而提高每位交易者的成功率。 Entry Points Pro 可操作任何资产 它允许您在 MT4 平台上交易任何经纪商提供的加密货币、股票、
249 USD
"Supply / Demand Zones" The concepts of supply and demand zones   are undoubtedly two of the most highly discussed attributes of technical analysis. Part of analysing chart of pattern , these terms are used by traders   to refer to price levels i n charts that tend to act as barriers, preventing the price of an asset from getting pushed in a certain direction. At first, the explanation and idea behind identifying these levels seems easy, but as you'll find out, supply and demand zones can co
199 USD
Introduction to Fractal Pattern Scanner Fractal Indicator refers to the technical indicator that makes use of the fractal geometry found in the financial market. Fractal Pattern Scanner is the advanced Fractal Indicator that brings the latest trading technology after the extensive research and development work in the fractal geometry in the financial market. The most important feature in Fractal Pattern Scanner is the ability to measure the turning point probability as well as the trend probabi
180 USD
Volume by Price MT4
Brian Collard
5 (14)
The Volume by Price Indicator for MetaTrader 4 features Volume Profile and Market Profile TPO (Time Price Opportunity). Get valuable insights out of currencies, equities and commodities data. Gain an edge trading financial markets. Volume and TPO histogram bar and line charts. Volume Footprint charts. TPO letter and block marker charts including split structures. Positioning and styling options to suit the user's needs and context. Highlight Volume Profile and Market Profile TPO Point of Contro
259 USD
PZ Divergence Trading
PZ TRADING SLU
5 (3)
棘手的发现和频率稀缺是最可靠的交易方案之一。该指标使用您喜欢的振荡器自动查找并扫描常规和隐藏的发散。 [ 安装指南 | 更新指南 | 故障排除 | 常见问题 | 所有产品 ] 容易交易 发现常规和隐藏的分歧 支持许多知名的振荡器 根据突破实现交易信号 显示适当的止损和获利水平 可配置的振荡器参数 可自定义的颜色和尺寸 按条形过滤大小差异 实现绩效统计 它实现了电子邮件/声音/视觉警报 为了提供广阔的市场前景,可以使用不同的振荡器在同一张图表中多次加载该指标,而不会产生干扰。该指标支持以下振荡器: RSI CCI MACD OSMA 随机 动量 很棒的振荡器 加速器振荡器 威廉姆斯百分比范围 相对活力指数 由于差异可能会扩大很多,尤其是在外汇市场中,因此该指标产生了转折:它在等待交易突破之前等待donchian突破确认差异。最终结果是带有非常可靠的交易信号的重新粉刷指示器。 输入参数 幅度:用于寻找差异的之字形周期 振荡器-选择要加载到图表的振荡器。 突破期-交易信号的突破期,以柱为单位。 发散类型-启用或禁用发散类型:隐藏,常规或两者。 最小散度单位为条形-最
249 USD
Full STO
Roman Smoroda
完整的 STO 指标(包括三个 STO 指标的所有版本:高级版、黄金版、白银版) - STABLE TRADE OPTION 专为自动二元期权交易而设计。 请仔细阅读!!!!! 重要事项 在一个终端中创建两个不同到期时间的模板,一个为 18:01、18:02,到期时间为 1 至 15 分钟的模板,另一个为 22:00,到期时间为 10 至 20 分钟的模板。 胜率:过去 5 年为 71 资金管理:存款的 0.3 此版本的指标仅用于莫斯科时间 18:01、18:02、22:00 的交易,白银和黄金的到期时间为 1 至 15 分钟,高级版本的到期时间为 10 至 20 分钟。信号出现在蜡烛内部并立即打开交易,如果您使用连接器,则在蜡烛内部打开一个标记。 该指标配置齐全,您无需自行更改。安装并交易 请勿在未经任何检查和测试的情况下购买该指标,我花了两年多时间在真实账户上检查所有版本的sto并查看结果。经过多年测试,我们选择了最佳参数。 应用算法 1. 将指标安装到信号顾问中,信号顾问会自动向经纪商平台发送信号。 - mt2trading.
500 USD
ECM Elite Channel is a volatility-based indicator, developed with a specific time algorithm, which consists of finding possible corrections in the market. This indicator shows two outer lines, an inner line (retracement line) and an arrow sign, where the channel theory is to help identify overbought and oversold conditions in the market. The market price will generally fall between the boundaries of the channel. If prices touch or move outside the channel, it's a trading opportunity. The
250 USD
CFF Banks Liquidity
Abdalla Mohamed Kandil
CFF Banks Liquidity     Entry signals without repainting or delays     Error-free opening of trades     Provides signals for any direction sell & Buy Join Our Public Telegram Channel for latest updates and set files.   | Our Telegram Channel How does the CFF Banks Liquidity Works? Our CFF Banks Liquidity trading system based on a very accurate "Trend-Following" Trading Strategy. Here's how to Start using our System 1.      Buy and install the indicator in your terminal. Ask the guide.
313 USD
Hello Dear Trader, Today Im Telling You About The "Golden Scalp System V1 " Metatrader4 Golden Scalp System Scalper with EMA   This is a  Scalper strategy   based on ( Exponential moving average) EMA . Time frame: H1 Pair: EUR/USD, GBP/USD,AUD/USD XAU/USD Platform Mt4   Indicators for Scalper with Ema: 300  EMA (Exponential Moving Average) ; 500 EMA (Expontial Moving Average); Stochastic   (5,3,3)   Long Entry 1) 300  EMA   > 500  EMA . 2) Find significant levels of support. 3) Wait for
500 USD
This indicator will help you identify the key zones needed for The Silver Bullet Strategy which are:  The three time-windows the ICT mentioned in the strategy Window 1: 3 AM and 4 AM New York time Window 2: 10 AM and 11 AM New York Time Window 3: 2 PM to 3 PM New York Time Bullish and bearish supply and demand zones which will help you identify FVG inside those time windows T he previous day's high and low, draw on liquidity The indicator does not plot the FVGs to avoid cluttering the chart  Exi
200 USD
Sniper Strategy
Mamoun M N Owda
狙击策略旨在为您提供所有货币对和所有时间框架的最佳入场点,并始终根据价格行为随趋势方向移动。 一旦你掌握了策略,它会让你对你的交易更有信心,这样你就知道何时以最大利润打开和关闭你的交易,因为它显示了多进场趋势的开始,所以如果你在开始时错过了入场趋势狙击策略将为您提供更多机会与最佳进场点以及趋势方向,但请注意,您必须始终在趋势开始时采取最佳进场,因为价格动能运动会随着更多利润而更强。 为什么是狙击策略?  它适用于所有时间框架和货币对。(更高的时间框架意味着更高的利润)  您将永远不会错过您最喜欢的货币对的任何交易。  它会让您在交易时更加放松和自信。  您不想在图表前花费更多时间,只需等待 Sniper Strategy Call。  适用于日内交易、剥头皮和波段交易 基于配对的最佳时间框架: 它适用于所有时间范围 指数 1M, 5M, &15M 货币对 15M 和 30M 注意:一旦您在 Instagram @forex_mission 上下载指标 DM 我们并附上您的购买收据,以获得合适的模板以及有关如何安装和使用高性能指标的更多信息。
750 USD
介绍二元智能系统:您的终极交易伴侣 二元智能系统不仅仅是一个指标,它是一个精心设计的复杂交易工具,为交易者提供精确的交易信号和市场洞察。该系统建立在先进的算法和广泛的技术指标基础上,是您解锁交易成功的关键。 指标组件: 移动平均百分比(MAP):   该组件计算多个移动平均线的加权平均值,为趋势识别提供强大的基础。MAP会根据市场条件动态调整,提供有关当前趋势方向的见解。 商品通道指标(CCI):   CCI通过分析价格偏离平均值来衡量超买和超卖情况。二元智能系统的CCI集成确保了从整体上识别潜在的反转点。 移动平均线收敛/发散(MACD):   系统中的MACD组件超越了简单的价格交叉。它评估MACD线和信号线的收敛和发散,揭示隐藏的交易机会并确认趋势强度。 平均方向指数(ADX):   使用ADX,二元智能系统量化趋势动量。它可以准确地识别强劲的趋势并帮助您避免弱势、不确定的市场阶段,从而增强您的交易决策。 多空力量:   通过这些指标,可以利用多空情绪的综合力量。这对市场情绪的全面了解有助于进行明智的交易入场。 随机指标:   二元智能系统中的随机指标有助于识别超买和超卖情况,并
450 USD
Smart Ai Levels
Aditya Jayswal
Smart Ai Levels  Accumulation & Distribution indicator Smart Ai Levels are Ai controlled indicator which is based on Wyckoff Price cycle theory . It automatically scans the Accumulation & Distribution phases on chart and Ai draws the possible areas before Mark up and Mark down which acts as hot zones and can be traded with confirmation to catch those big price movements . It's a great tool for both Reversal and Breakout Trades suitable to all Trading Styles such as Scalping - Intraday - Swing 
249 USD
Introduction Excessive Momentum Indicator is the momentum indicator to measure the excessive momentum directly from raw price series. Hence, this is an extended price action and pattern trading. Excessive Momentum Indicator was originally developed by Young Ho Seo. This indicator demonstrates the concept of Equilibrium Fractal Wave and Practical Application at the same time. Excessive Momentum detects the market anomaly. Excessive momentum will give us a lot of clue about potential reversal and
200 USD
A. 什么是 A2SR ?   * 这是一个领先的技术指标(没有重绘,没有滞后)。   * Special event :  https://c.mql5.com/1/263/A2SR_Discount_35_percent_in_August_2023.png  -  指导 : -- 在  https://www.mql5.com/en/blogs/post/734748/page4#comment_16532516 -- 和  https://www.mql5.com/en/users/yohana/blog A2SR 在确定支撑(需求)和阻力(供应)水平方面有一种特殊的技术。 与我们在网上看到的普通方式不同,A2SR 在确定实际 SR 级别时有一个独创的概念。 原技术不是从网上拿来的,也没有在网上公开过。 A2SR 将根据您的交易风格自动选择 SR 级别。 即使您正在更改时间范围,但 SR 级别仍将保留在其位置上。 因为实际的 SR 不是从你使用的时间范围内获得的。 A2SR 拥有完整的交易工具 。 实际支持(需求)和阻力(供应)的真正概念。 新闻事件和央行
276 USD
BinaryScalping
Andrey Spiridonov
BinaryScalping is a professional indicator for trading binary options and scalping. The algorithm of the indicator is based on the calculation of pivot points for each time period separately, the location of the price of the trading instrument relative to the pivot points is analyzed and the probability of a trading operation is calculated. The indicator has a built-in filter of trading signals based on the global trend. The indicator is installed in the usual way and works with any trading inst
1 200 USD
Scientific trade
Aleksey Ivanov
5 (1)
An extremely convenient indicator that truly makes the process of making money on the exchange easy. It is based on the scientifically rigorous theory of the market developed by the author, the beginning of which is presented here .                The full algorithm of this indicator operation is presented in the article .               The indicator calculates the most probable price movement trajectory and displays it on the chart. Based on the predicted price movement trajectory
179 USD
Supply and Demand Dashboard PRO
Bernhard Schweigert
4.81 (21)
目前八折优惠! 这个仪表板是一个非常强大的软件,可用于多个符号和多达9个时间段。 它是基于我们的主要指标(最佳评论:高级供应需求)。 Advanced Supply Demand 该仪表板提供了一个伟大的概述。它显示。   筛选后的供需值,包括区域强度评级。 区间内和区间外的点位距离。 它突出了嵌套的区域。 在所有(9个)时间段内,它对所选符号发出4种警报。 它是高度可配置的,以满足您的个人需求! 您的利益! 对每个交易者来说,最重要的问题是。 什么是入市的最佳水平? 在强大的供应/需求区域内或附近进入你的交易,以获得最佳的成功机会和风险/回报。 我的止损的最佳位置是哪里? 把你的止损放在强势供应/需求区的下方/上方是最安全的。 我的最佳盈利目标是什么? 你的退出策略和你的进入策略一样重要,了解更高的时间框架图可以帮助你。对于买入,使用下一个供应区作为目标,对于卖出,使用下一个需求区作为目标。在回撤到供应区或需求区时进场,以确保有足够的利润空间,达到更高的时间框架的供应和需求,将增加你的利润。 为什么我们要过滤强区和
199 USD
Please send me Direct message on MQL5 CHAT after purchasing the Indicator for Training and Installation Support There are some additional files that is important to use with the Indicator . So be sure to contact me after purchasing the Indicator So that I can add you for training and support . If you find any difficulty with installation then send me Direct message here So that I can connect with you via Anydesk or Teamview for the product installation. " Smart Order Block Indicator " to find
249 USD
简介: 在二元期权和外汇交易的快节奏世界中,拥有合适的工具和策略可以为您在成功和失败之间取得成功。其中一种工具是 BBB 黑蓝二元期权指标系统,这是一种革命性的交易方法,它利用图表模式、移动平均线和交易量来帮助交易者做出明智的决策。在本全面指南中,我们将深入探讨 BBB 系统的细节,解释其工作原理、何时使用以及如何潜在地增强您的交易表现。 BBB 指标系统简介: BBB 黑蓝二元期权指标系统是一款复杂的技术分析工具,旨在帮助交易者识别二元期权和外汇交易的最佳入场和退出点。它得名于其主要组成部分:“黑色”和“蓝色”,它们代表执行交易的关键信号。 图表模式: BBB 系统首先通过分析交易图表的已计数部分进行分析。这涉及识别价格走势中的特定模式或形态,例如支撑和阻力水平、趋势线和蜡烛图模式。这些图表模式为做出交易决策提供了关键的背景,是系统运行的基础。 移动平均线: 该系统使用两种不同类型的移动平均线进行比较:简单移动平均线 (SMA) 和指数移动平均线 (EMA)。这些移动平均线帮助交易者判断市场总体趋势和动量。 SMA(简单移动平均线): SMA 计算特定时间段内的平均价格,提供价格走势
450 USD
Binary Hacker Indicator
Ramzi Abuwarda
1 (1)
在快节奏的金融市场中,每一秒都至关重要,每一个决定都可能成败。进入 Binary Hacker Indicator,这是一个开创性的工具,将以每分钟为单位的方式改变交易者分析价格走势的方式。 揭示交易中的精准度: Binary Hacker Indicator 并非您的普通交易工具。它作为实时分析器运行,逐分钟分析图表,为交易者提供宝贵的见解。与需要大量手动分析的传统指标不同,Binary Hacker 消除了交易策略中的猜测,提供了一种基于纯粹数据的计算方法。 每一分钟的力量: 想象一下能够分析交易的每一分钟,了解买卖压力之间的微妙平衡。有了 Binary Hacker,这一愿景就变成了现实。这个巧妙的指标会持续监控市场并计算每一分钟的上升和下跌笔数,将价格走势的本质提炼为易于理解的信息。 独特的策略,无与伦比的结果: Binary Hacker Indicator 与众不同的是其独特的交易策略,这些策略经过精心调整,可以适应价格走势的细微差别。当您在图表上激活指标时,它会在每分钟的前十秒内耐心等待,让市场显示其初始情绪。如果上升笔数多于下跌笔数,则该指标会提示您考虑买入交易,反之亦
450 USD
作者的更多信息
Gann 方块指标是一种强大的市场分析工具,基于 W.D. Gann 在其“市场预测数学公式”一文中介绍的数学概念。该指标融合了与平方数(如 144、90 和 52)有关的 Gann 技术,以及平方 9。此外,它还融入了  关于如何将平方 9 与通道和星形图案结合使用的方法。 用户手册和使用方式: 在使用该指标之前,我们建议您阅读用户手册,并与我们联系以获得任何澄清。您可以在我们的网站上找到完整的用户手册。 该指标提供了 MT5 的完整版本供购买,也提供了 MT4 的免费版本供测试。提供了两个版本的链接供您方便使用。 主要特点和功能: Gann 方块指标为您的交易环境提供了全套工具,使您能够基于几何图案和 Gann 的概念做出明智的决策。以下是主要特点: 平方 9 分析: 该指标可以绘制与平方 9 有关的各种元素,包括水平线、星形图案、网格、Gann 扇形等。这在您的图表上提供了 Gann 的几何概念的视觉表示。 Gann 方块: 该指标绘制了 Gann 方块 52、90 和 144,使您能够可视化和分析它们与价格走势的关系。 自由 Gann 星形图案: 该指标使您能够直接在图表上绘制
133 USD
Shepherd Gann Squares MT5
Abdullah Alrai
5 (10)
該指標是一種市場分析方法,基於 W.D. Gann 撰寫的“市場預測的數學公式”文章,根據 9 的平方和 144 的平方方法。 用戶手冊: Add Your review And contact us to get it 您可以從以下位置購買完整的 MT4 版本: https://www.mql5.com/en/market/product/15316 您可以免費在 MT4 上進行測試: https://www.mql5.com/en/market/product/15320?source=Site +Profile+Seller#!tab=reviews 本產品可以為您繪製 9 的正方形作為級別 / 星星 / 網格 / 江恩迷 / 。 它還將繪製江恩平方:52 / 90 /144。 它將直接在圖表上繪製可移動的自由江恩星。 它也將繪製江恩菱形。 它有很多計算器,讓您能夠為您的條目計算最佳手數。 指標有一個面板,它允許您: 在 144/90/52 方格/9 方格/江恩自由星/江恩鑽石/命理工具/手數計算器和帳
133 USD
Shepherd Harmonic Pattern
Abdullah Alrai
4.68 (59)
这个指标将检测手动和自动方法在图表上绘制的谐波模式。 您可以从此链接查看用户手册: 添加您的评论并联系我们以获得它 有一个免费版本可以在mt4上尝试此产品。 您可以使用它来检测Gartley和Nenstar模式: https://www.mql5.com/en/market/product/30181 您可以从以下链接购买完整的MT4版本: https://www.mql5.com/en/market/product/15212 注意 指标具有控制面板,并将保存每个(图表和时间框架)设置。 您可以将其最小化以在图表上获得更多空间,并且如果您更喜欢使用其他分析工具,则可以按关闭按钮隐藏所有指标数据 当您使用此指标并更改设置,添加诸如移动平均线或布林带之类的指标时,此指标将自动保存您的模板编辑,并且您可以随时加载它们。 如果您使用的是Windows 10,请右键单击MetaTrader图标>兼容性>更改高DPI设置>系统(增强)以获得最佳屏幕设置(应在高清设备中完成)。 指标只是谐波交易理论的解释,用于检测图表上的谐波模式。 如果您想学习它,可以搜索Scott Carney的书,名为“Ha
133 USD
Gann 方块指标是一种强大的市场分析工具,基于 W.D. Gann 在其“市场预测数学公式”一文中介绍的数学概念。该指标融合了与平方数(如 144、90 和 52)有关的 Gann 技术,以及平方 9。此外,它还融入了  关于如何将平方 9 与通道和星形图案结合使用的方法。 用户手册和使用方式: 在使用该指标之前,我们建议您阅读用户手册,并与我们联系以获得任何澄清。您可以在我们的网站上找到完整的用户手册。 该指标提供了 MT5 的完整版本供购买,也提供了 MT4 的免费版本供测试。提供了两个版本的链接供您方便使用。 主要特点和功能: Gann 方块指标为您的交易环境提供了全套工具,使您能够基于几何图案和 Gann 的概念做出明智的决策。以下是主要特点: 平方 9 分析:   该指标可以绘制与平方 9 有关的各种元素,包括水平线、星形图案、网格、Gann 扇形等。这在您的图表上提供了 Gann 的几何概念的视觉表示。 Gann 方块:   该指标绘制了 Gann 方块 52、90 和 144,使您能够可视化和分析它们与价格走势的关系。 自由 Gann 星形图案:   该指标使您能够直接
133 USD
该指标旨在与艾略特波浪理论相结合,提供了两种不同的工作方式: 自动工作: 在此模式下,指标会自动检测图表上的所有五个动机波浪,并为您提供预测和潜在的逆转区域。它还可以提供警报和推送消息。这种自动功能简化了识别和分析艾略特波浪模式的过程。 手动工作: 此选项适用于喜欢手动方法的交易员,用于手动绘制九个不同等级的波浪。每个等级都可以在它们出现后通过调整图表上的绘制线条来单独定义。此功能简化了手动绘制波浪的过程,使其更加高效。需要注意的是,所有绘图数据将保存在平台的数据文件夹中,以备将来参考。 参数: Name: 指标名称。 Use_System_Visuals: 启用或禁用指标主题,以匹配交易平台的整体外观。 Explain_Comment: 允许启用或禁用波浪编号的解释性注释,有助于理解已识别的波浪。 Show_Last_Candle_Counter: 启用或禁用蜡烛计时器,提供有关当前蜡烛收盘的剩余时间的信息。 Candle_Counter_Color: 蜡烛计时器文本的颜色。 Basic_Wave_Color: 用于表示波浪的主要颜色。 Bullish_Wave_Color: 当检测
88.20 USD
ON Trade 启明星蜡烛图指标 启明星蜡烛图模式是一个强大且直观的蜡烛图模式,可以为市场情绪和潜在趋势反转提供有价值的见解。它以蜡烛的一端具有非常小或不存在的影线(上下影线),而另一端有一个延伸到当前趋势方向的长实体为特点。该模式表示买家和卖家之间的强烈失衡,暗示市场动力明显单边。 特点和优势: 清晰的市场情绪: 启明星蜡烛清楚地描绘了主导市场情绪。牛市(白色)启明星表明从开盘到收盘价格有强劲的买入压力,而熊市(黑色)启明星表示有强烈的卖出压力。 趋势延续或反转: 根据背景,启明星模式可以信号趋势延续或潜在趋势反转。当它们出现在长时间趋势后时,可能表示趋势将继续。相反,出现在支撑或阻力区域附近的启明星蜡烛可能暗示潜在反转。 简单可靠: 启明星模式在价格图表上相对容易识别,并且与其他技术分析工具结合时可以提供可靠的信号。 如何使用启明星蜡烛图指标: 识别启明星模式: 该指标在您的价格图表上识别和标记启明星模式。它突出显示牛市(向上)和熊市(向下)启明星模式,使其易于发现。 与其他指标确认: 尽管启明星模式本身可以提供有价值的见解,但考虑使用其他技术指标或图表模式来确认信号,以提高准确
FREE
通过 Shepherd Numerology Levels 指标,探索一种革命性的交易方法。这一创新工具将古老的数理学智慧与尖端的交易技术相结合,帮助您在图表上识别关键的支撑和阻力水平。通过运用九宫格数理方法的力量,该指标为您提供了对市场动态的独特视角,使您能够做出更有根据的交易决策。 主要特点和优势: 九宫格数理学: Shepherd Numerology Levels 指标采用九宫格数理方法,这是一种经过时间验证的数理方法,揭示了价格运动中的隐藏模式。该方法以其准确性在预测潜在转折点和市场逆转方面享有盛誉。 精确的支撑和阻力水平: 借助 Shepherd Numerology Levels,您可以确定精确的支撑和阻力水平,这些可能在常规分析中不明显。这些水平基于数理学原则,为市场行为提供了新的视角。 动态价格区域: 该指标根据数理学计算为您提供了动态的价格区域。这些区域可作为潜在的决策点,价格趋势可能在这些区域发生转变,为您的交易策略提供优势。 视觉呈现: Shepherd Numerology Levels 指标在图表上直观地绘制了识别出的水平。这种图形化呈现简化了理解价格动态和
88.20 USD
该指标的目的在于在您的交易图表上可视化表示唐奇安通道。唐奇安通道是一种直观的技术工具,用于描述特定时期内的最高高点和最低低点之间的范围。此指标增强了价格运动的视觉分析,为潜在的突破和趋势延续点提供了洞察力。唐奇安通道可以应用于当前时间框架和更高的时间框架,如果您选择启用该选项的话。 指标的主要特点: Use_System_Visuals:此参数允许您在使用系统视觉样式和自定义指标外观之间进行切换。当激活时,指标的视觉元素将与您的交易平台整体主题相匹配。 Signal_from_HT_Timeframe:启用此选项允许您从更高的时间框架接收信号。换句话说,您可以考虑在更长的时间框架上观察唐奇安通道的行为,以影响您在当前时间框架上的交易决策。 HT_Timeframe:当激活Signal_from_HT_Timeframe时,此参数允许您选择更高的时间框架,从中您希望接收信号。比较唐奇安通道在不同时间框架上的行为可以为交易决策提供有价值的背景。 Period:此参数定义计算唐奇安通道的时期。它确定用于建立通道上限和下限的条形或蜡烛数量。 Down_Side和Up_Side:这些参数允许您为
FREE
Shepherd Harmonic Patterns Free
Abdullah Alrai
4.72 (25)
This indicator will detect harmonic patterns that are drawn on the chart by manual and automatic methods. You can see user manual from this link: https://www.mql5.com/en/blogs/post/719257 There is a free version (it detect only Gartley and Nenstar Patterns) to try this product. You can buy the full MT4 version from: https://www.mql5.com/en/market/product/104689 Notes When you use this indicator and change the settings, add indicators like Moving Average or Bollinger Bands, this indicator will
FREE
Shepherd Gann Squares Free
Abdullah Alrai
4.86 (37)
該指標是一種市場分析方法,基於 W.D. Gann 撰寫的“市場預測的數學公式”文章,根據 9 的平方和 144 的平方方法。 用戶手冊: Add Your review And contact us to get it 您可以從以下位置購買完整的 MT5 版本: https://www.mql5.com/en/market/product/28669 您可以免費在 MT4 上進行測試: https://www.mql5.com/en/market/product/15316 本產品可以為您繪製 9 的正方形作為級別 / 星星 / 網格 / 江恩迷 / 。 它還將繪製江恩平方:52 / 90 /144。 它將直接在圖表上繪製可移動的自由江恩星。 它也將繪製江恩菱形。 它有很多計算器,讓您能夠為您的條目計算最佳手數。 指標有一個面板,它允許您: 在 144/90/52 方格/9 方格/江恩自由星/江恩鑽石/命理工具/手數計算器和帳戶信息之間移動。 指標將保存您在配置文件上的所有工作,您可以隨時加載和卸載它。 您可以在按下按鈕時
FREE
ON Trade Joker Levels
Abdullah Alrai
5 (1)
基于数字学的MetaTrader支持和阻力指标 简介: 通过我们的基于数字学的MetaTrader支持和阻力指标,解锁技术分析的新维度。这个独特的工具利用数字学的力量,在您的图表上识别关键的支持和阻力水平,为您提供有关潜在价格变动的有价值见解。 关键概念: 交易中的数字学: 数字学是对数字及其在我们生活中的意义的神秘研究。将数字学原理应用于交易,涉及到识别具有象征意义的特定数字,并使用它们来预测可能吸引买入或卖出活动的价格水平。 指标功能: 我们的指标利用数字学的隐藏模式,在您的图表上绘制支持和阻力水平。这些水平是从在金融市场中具有显著意义的关键数字中获得的。 学习的首选步骤: 了解数字学:在使用该指标之前,花些时间了解数字学的基础知识及其在交易中的相关性。了解重要数字、它们的含义以及它们与金融市场的关系。 指标安装:首先,在您的MetaTrader平台上安装基于数字学的支持和阻力指标。按照用户指南中提供的安装说明操作。 选择时间框架:打开您喜欢的交易工具的图表,选择您想要分析的时间框架。该指标适用于不同的时间框架,可以用于识别短期和长期交易的数字学水平。 调整指标参数:根据您的交易偏
FREE
Introducing the Pivot Point Selector Indicator: Your Ultimate Tool for Custom Pivot Levels Are you ready to take your trading to the next level? Say hello to the Pivot Point Selector Indicator, a game-changing tool that puts you in control of your pivot levels. This innovative indicator empowers you to choose three specific points that will determine the pivot level calculations, giving you unparalleled customization and precision in your trading strategy. Key Features and Benefits: Custom Pivo
FREE
介绍Maravilla Square指标:您的预测交易助手 发现Maravilla Square指标,您的预测交易的关键。这个独特的工具提供了关于价格反转的洞察,具有可以在高点和低点之间调整的趋势线。 趋势线动态: Maravilla Square指标引入了趋势线,您可以将其调整到图表的高点和低点之间。这个动态特性在指标和价格走势之间创建了直接链接,提高了您的交易准确性。 两条彩色线: 观察两条彩色线的收缩,这是潜在价格反转的独特信号。当这些线收敛时,形成了一个独特的图案,使指标能够预测市场的转折点。 精确度至关重要: 以固定的一比一纵横比使用Maravilla Square指标进行精确的预测。这确保了准确的结果,并有助于支持您的交易决策。 Maravilla Square图案: 在这个指标的核心是Maravilla Square图案,精心设计以捕捉价格走势的复杂性。观察两条彩色线和趋势线的响应,以获得有关潜在市场变动的洞察。 用户友好的集成: 将Maravilla Square指标无缝集成到您的交易平台中。其适应性趋势线和图案识别功能使其适用于各个层次的交易者。 立即尝试: 在固定的
FREE
这个Hikkake日本蜡烛图案指标是一个专门设计用于识别和检测图表上正在形成的Hikkake价格行为模式的指标。这些模式基于虚假的内部杆杠杆突破,通常会产生潜在的交易机会。该指标的主要功能是分析图表上的最后五根蜡烛,以确定它们是否展现出Hikkake模式的特征。当确认出现此模式时,该指标将在图表上的相关蜡烛周围绘制一个矩形,使交易者更容易发现和解读该模式。 指标的主要特点: 模式检测:Hikkake指标专门编程以检测和突出显示Hikkake价格行为模式。这些模式围绕着虚假突破内部杆杠杆的概念。 通过最后五根蜡烛确认:为了验证Hikkake模式的存在,该指标研究图表上的最后五根蜡烛。它评估它们的排列和关系,以确定是否满足模式的标准。 矩形可视化:当指标识别到有效的Hikkake模式时,它将在形成该模式的蜡烛周围绘制一个矩形。这种图形表示增强了在图表上识别模式的可视性。 参数解释: Pips_Between_H_L:该参数允许您定义第五根蜡烛的高低价之间的点数。这个值在确定Hikkake模式的标准和影响模式检测的准确性方面起作用。 Hikkake模式解释: Hikkake模式是围绕虚假的内
30 USD
This indicator offers a comprehensive and efficient solution for traders seeking optimal entries in scalping strategies. Leveraging moving averages and stochastic indicators, it employs a systematic approach to identify favorable trade opportunities. The indicator goes beyond mere analysis, actively drawing clear and actionable entry points on your chart, denoted by arrows. Moreover, it provides the convenience of alerts to ensure you never miss these potential setups. Key Features and Benefits:
FREE
金克拉价格计算器指标介绍 您是否有兴趣随时了解黄金在您的本地货币中的价格?不用再寻找了,金克拉价格计算器指标为您提供了实时计算每克黄金价格的创新工具,以您喜欢的本地货币来计算。借助此指标,您可以利用金融洞察力做出明智的决策。 主要特点: 本地化的黄金价格: 金克拉价格计算器指标为您提供金属每克价格,特别是黄金每克价格,以您熟悉的本地货币进行定制。这意味着您可以方便地在与您相关的货币中跟踪黄金的价值。 用户友好的设置: 我们的指标旨在为您的方便而设计。您可以从指标设置中直接调整设置,或者直接在主要图表上进行调整,实现无缝和个性化的体验。 参数解释: Use_System_Theme (使用系统主题): 有了选择您喜欢的颜色方案的选项,您可以轻松将指标的视觉外观与您的交易环境相结合。 Ounce_Value (盎司价值): 此参数指的是您本地货币中一盎司黄金的国家价值。它是后续计算的基本组成部分。 Reference_Carat (参考克拉): 参考克拉表示基于其进行的计算。这使您可以将计算与您感兴趣的特定类型的黄金对齐。 Calculated_Carat (计算克拉): 此参数基于参考克
FREE
ON Trade Pivots
Abdullah Alrai
ON Trade Pivots is A technical indicator that Draws all Pivot levels depending on time frame that defined in settings. Notes It will be good tool for all traders who use pivot levels in their trades. Let me inform you that this indicator draw this level as buffers not as objects then you can connect it easily to EA. This indicator allow you to find pivots levels for any time frame not only daily you are free to choose time frame from settings. Parameters Use_System_Visuals - Enable /Disable
FREE
ON Trade Angler
Abdullah Alrai
"这个指标是一个简单的趋势检测工具。 您可以将其与您的策略一起使用,以实现良好的入场,例如在剥头皮模式下。 它会在价格周围绘制一个通道,在时间增加时会扩展。在自定义周期内,它将根据考虑时间和价格的算法,回到扩展的起始点。 在逆转迹象出现后,您可以在通道的较低边界购买。 在您观察到逆转迹象后,您可以从通道的上边界卖出。 参数: 使用系统主题:您可以从这里选择您的主题。 计算类型:您可以在以下三个选项之间进行选择: 1- 原始计算:这个区域定义了一天的趋势,如果它在这个区域之上或之下开启。 2- 新计算:它会绘制我们将依赖于检测趋势的通道。 3- Sheph:修改后的通道,适用于不兼容新计算方法的符号。" 如果您有更多问题或需要进一步帮助,请随时问我!
133 USD
Rsi Channel
Abdullah Alrai
5 (1)
This indicator displays the channel of Relative Strength Index. When you see that the price touches the red line and retreats from it many times, then you will know that the general trend is down. When it retreats from the blue line many times, that means that the general trend is up. This lines express the RSI values attributed to the price values on the main chart. You can add this indicator to your strategy, it will help you. This indicator will work best on 5 minutes and higher time frames.
38.20 USD
该指标提供了一种基于'回归通道工具'概念的强大市场分析方法。通过利用此工具,交易员可以在图表上对回归通道获得出色的控制,从而使他们能够做出更明智的交易决策。 '回归通道工具'是交易员工具箱中的一个强大工具。它旨在为价格趋势和潜在支撑和阻力水平提供有价值的见解。该工具特别适用于在趋势内部可视化修正波动,提供了对价格动态的综合视图。 以下是更详细地了解使用此指标的关键功能和优势: 通道水平和支撑/阻力: 该指标的主要优势之一是其能够生成作为动态支撑和阻力区域的通道水平。这些水平在确定潜在的入场和出场点方面至关重要,增强了交易策略的精确性。 修正波动水平: 通过启用修正波动水平,交易员可以在更大的趋势内识别潜在的修正。这个功能有助于识别回撤,并帮助交易员利用有利的价格波动。 直接控制: 该指标的控制面板允许无缝地操纵回归通道。交易员可以微调填充和射线选项等设置,提供符合其分析风格的通道定制视图。 更高时间框架分析: 为了获得更广泛的视角,该指标具有从更高时间框架加载数据的功能。这个功能可以帮助交易员评估不同时间尺度上的趋势和通道,促进对市场动态的更全面了解。 如何使用: 设置趋势线: 首先,
1 000 USD
介绍我们强大的外汇指标,旨在增强您的交易策略并为您提供对市场趋势的准确洞察。这款先进的工具采用了复杂的定制算法,精确分析蜡烛测量数据,通过调整以获得最佳精度。结果是一组精确绘制在您的图表上的箭头,指示战略进场点。 这款指标的精髓在于它能够利用蜡烛图案的力量,并将其与精心校准的调整相结合。通过这样做,它为市场的动态提供了独特的视角,为您的交易决策提供了优势。 这款指标的一个突出特点是其在H1时间框架上的出色表现。专门在此时间框架上交易的交易者会发现它提供了多个准确的入场机会。然而,我们相信协同效应的力量。虽然此指标是一个强大的独立工具,但当它与更广泛的交易策略结合使用时,其表现会更上一层楼。通过将其与您现有的方法相结合,您可以释放其全部潜力,并加强您的交易结果。 让我们更详细地看看让您控制交易体验的参数: 使用系统主题: 您的交易环境在您的关注度方面起到作用。选择与您共鸣的图表主题,为您创造一个舒适且视觉吸引力的工作环境。 使用通知: 即使您没有积极监视图表,也能保持信息更新。启用此功能,可以将通知直接发送到您的设备,及时向您传达市场的重要发展。 使用警报: 在交易中,时机至关重要。通过
38.20 USD
Shepherd Gann Squares
Abdullah Alrai
4.9 (10)
該指標是一種市場分析方法,基於 W.D. Gann 撰寫的“市場預測的數學公式”文章,根據 9 的平方和 144 的平方方法。 用戶手冊: Add Your review And contact us to get the user manual 您可以從以下位置購買完整的 MT5 版本: https://www.mql5.com/en/market/product/28669 您可以免費在 MT4 上進行測試: https://www.mql5.com/en/market/product/15320?source=Site +Profile+Seller#!tab=reviews 本產品可以為您繪製 9 的正方形作為級別 / 星星 / 網格 / 江恩迷 / 。 它還將繪製江恩平方:52 / 90 /144。 它將直接在圖表上繪製可移動的自由江恩星。 它也將繪製江恩菱形。 它有很多計算器,讓您能夠為您的條目計算最佳手數。 指標有一個面板,它允許您: 在 144/90/52 方格/9 方格/江恩自由星/江恩鑽石/命理工
133 USD
该指标旨在检测和可视化钻石甘恩波浪,这是一种源自甘恩理论的特定模式。它通过基于模式的ABC点绘制点(P),为交易者提供有关潜在市场逆转的见解。此外,该指标从预测的点(P)绘制垂直线,帮助交易者更轻松地识别潜在的逆转点。 指标特点: Use_System_Visuals:此参数启用或禁用系统的视觉主题,用于指示器的外观。通过启用此选项,指标的视觉元素将与交易平台的整体主题保持一致。 Show_Last_Candle_Counter:启用此选项会显示一个计数器,指示当前蜡烛杆关闭的剩余时间。对于依赖特定蜡烛杆模式或时间间隔进行交易策略的交易者,此计时器可能会很有帮助。 Candle_Counter_Color:交易者可以自定义蜡烛计数器文本的颜色,增强了指标的视觉清晰度,并与整体图表美学保持一致。 Diamond1_Color和Diamond2_Color:这些参数允许交易者为两种不同类型的钻石模式(钻石1和钻石2)设置不同的颜色。通过为每种模式分配独特的颜色,交易者可以在图表上轻松区分它们。 Predicted1_Point_Color和Predicted2_Point_Color:这些
61.80 USD
"该指标基于Bystra模式理论检测入场点,并提供放置限价单的入场值,带有目标和止损水平。这使您能够计算您的风险百分比。 注意事项: 该指标具有允许在专家顾问(EAs)中使用的缓冲区。 在使用此产品时,务必进行良好的资金管理。 当您更改时间框架时, 指标将保存在上次会话中使用的模板。 如果您需要一本书来学习这种方法,请在购买后与我们联系并分享您的评论。 参数: 使用系统视觉效果 - 启用/禁用此产品的视觉主题。 相对速度 - 启用/禁用仅在最后一波的快速运动中检测模式。 显示最后一根蜡烛计时器 - 启用/禁用蜡烛计时器。 蜡烛计时器颜色 - 蜡烛计时器文本的颜色。 多头模式颜色 - 多头模式的颜色。 空头模式颜色 - 空头模式的颜色。 发送警报 - 启用/禁用警报。 发送通知 - 启用/禁用移动平台的推送通知。 发送电子邮件 - 启用/禁用电子邮件警报。 显示目标 - 启用/禁用在图表上显示目标。 历史条数 - 最大历史条数。" 如果您有更多问题或需要进一步帮助,请随时问我!
88.20 USD
Fibo Star指标旨在在交易图表上以星形图案绘制斐波那契扇形。 这些斐波那契扇形是用于分析价格走势的有力工具,可以提供有关潜在支撑和阻力水平的见解。此指标配备了一个用户友好的控制面板,旨在简化绘制和配置扇形的过程,从而节省时间和精力。 使用说明: 此指标仅适用于手动使用。为了有效地使用它,请按照以下步骤操作: 辨认出您希望基于其绘制斐波那契扇形的高点和低点。 将紫色线放在这些高点和低点上。 一旦价格与这些线条交互,观察指标如何作为动态支撑和阻力水平运作。 参数: Use_System_Theme: 此参数允许您选择首选主题,以使指标的外观与您交易平台的整体样式相匹配。 Levels_Color: 选择您要为斐波那契扇形的水平使用的颜色。 Levels_Style: 定义斐波那契扇形水平的样式,根据您的喜好调整外观。 Levels_Width: 调整斐波那契扇形水平的宽度,以增强在图表上的可见性。 Levels_Ray: 启用或禁用从斐波那契扇形水平延伸的射线的显示。 Lvl0 - Lvl8: 为每个水平指定比例值。这些值在确定斐波那契扇形的角度和位置时起着关键作用。 Star_Co
66 USD
“Currency Strength Indicator” 是一个功能强大的工具,旨在为交易员提供有关外汇市场中各种货币相对强度的信息。通过根据其相应的时间框架计算和绘制每种货币的力度,该指标为交易员提供了识别潜在交易机会的机会,尤其是在观察到显著的背离或交叉时。 指标的关键特点: 1. 货币强度计算: 该指标根据其指定的时间框架计算每种货币的强度。此计算涉及在指定的时间段内对一种货币相对于其他货币篮子的表现进行评估。这有助于交易员了解货币的相对强弱。 2. 收缩和背离: 当两种货币的力度之间出现收缩或背离运动时,这可能表明潜在的交易机会。例如,如果一种货币显著增强,而另一种货币在减弱,这可能表明潜在的入场点。 3. 穿越零水平: 该指标还识别了货币强度穿越零水平的情况。上穿零水平可能表明强势趋势,而下穿零水平可能意味着弱势趋势。这些交叉可以作为交易决策的额外确认。 4. 可自定义的显示: 交易员可以选择在其图表上显示哪些货币强度。该指标允许启用或禁用特定货币的强度显示,如 USD、EUR、GBP、AUD、NZD、JPY、CHF 和 CAD。 5. 强度时间框架: “Strength
133 USD
这个指标可以检测通过手动和自动方法绘制在图表上的谐波图案。 添加您的评论,请 备注 该指标具有控制面板,并将保存每个(图表和时间框架)的设置。您可以将其最小化,以在图表上腾出更多空间,或者如果您更喜欢使用其他分析工具,可以按下关闭按钮隐藏图表上的所有指标数据。 当您使用此指标并更改设置、添加指标(如移动平均线或布林带)时,指标会自动保存您的编辑模板,您可以随时加载它们。 如果您使用的是Windows 10操作系统,请右键单击MetaTrader图标 > 兼容性 > 更改高DPI设置 > 系统(增强),以获得最佳的屏幕设置(应在高清设备上进行)。 该指标简单地基于谐波交易理论进行图表上的谐波图案检测。如果您希望深入学习,您可以搜索Scott Carney撰写的名为《谐波交易第1卷和第2卷》的书籍。 该指标具有价格和时间警示线。 指标将在您检测到的图案上绘制斐波那契扇形。 指标将绘制支撑/阻力射线。 指标具有批量计算器,帮助您管理风险。 您可以从较高时间框架手动加载绘制的对象到较低时间框架。 重置按钮将清除所有保存的设置(所有/当前)时间框架。 该指标具有警报/通知系统,将为您提供信号的目
88.20 USD
用于检测强势价格行动模式的技术指标:Pin Bar、Inside Bar 和 Outside Bar 介绍: 在技术分析领域,价格行动模式是潜在市场走势的重要指标。我们开发了一款先进的技术指标,可以在图表上简化强势价格行动模式的识别。我们的指标专门用于检测三种基本模式:Pin Bar、Inside Bar 和 Outside Bar。 检测到的关键模式: Pin Bar: Pin Bar 模式是单根蜡烛图形成,表示市场趋势可能发生反转。它的特点是小的实体和长的上引线或下引线。看涨的 Pin Bar 表示可能的看涨反转,而看跌的 Pin Bar 暗示看跌反转。 Inside Bar: Inside Bar 模式是指单根蜡烛的整个价格范围都在前一根蜡烛的价格范围之内。该模式表明市场暂时整理或无决策,通常会在两个方向中的一个发生突破之前出现。 Outside Bar: Outside Bar 模式,也称为“吞没”模式,出现在一根蜡烛的范围完全包围前一根蜡烛的范围时。看涨的 Outside Bar 可能预示看涨反转,而看跌的 Outside Bar 可能表明看跌反转。 指标功能: 我们的指标
38.20 USD
Unlock Hidden Insights with the Numerokh Indicator: Your Numerology-Based Support and Resistance Tool Introducing the Numerokh indicator, a revolutionary tool that brings the mystical world of numerology into the realm of trading. Imagine having the power to identify key support and resistance levels on your charts using the age-old wisdom of numerology. This indicator takes trading to a new dimension, offering you a unique way to analyze price movements and make informed trading decisions. Key
38.20 USD
介绍 ON Trade 数字镜像指标:揭示数字镜像中的价格逆转模式 通过 ON Trade 数字镜像指标,解锁技术分析的新维度。这一创新工具利用古老的数字学智慧,在您的图表上识别关键的价格逆转水平。通过将数字在镜像位置进行重新排列,该指标揭示出潜在的信号重要价格逆转模式,从而为您的交易决策提供独特的优势。 主要特点与优势: 应用数字学: ON Trade 数字镜像指标整合数字学的神秘力量,揭示隐藏的价格逆转模式。通过将数字在镜像方式下重新排列,它利用数字的象征意义来预测潜在的价格逆转。 镜像数字模式: 该指标应用将数字序列反转的概念,以在您的图表上绘制价格逆转水平。这些水平来源于数字镜像排列的方式,为您的交易决策添加了一个深度层面。 增强的逆转信号: 数字镜像指标通过识别潜在的价格逆转点来增强您的交易策略,这些点在传统分析中可能隐藏起来。镜像数字模式为您的交易决策添加了更多深度。 视觉表现: 该指标在图表上视觉呈现出识别的逆转水平。这种视觉呈现简化了价格变动和兴趣区域的解释。 可定制参数: 通过调整时间框架、镜像数字序列和灵敏度水平等参数,将该指标量身定制以适应您的交易风格。 使用 O
88.20 USD
筛选:
ahmed nabil
23
ahmed nabil 2023.09.29 14:15 
 

good one

Abdullah Alrai
97865
来自开发人员的回复 Abdullah Alrai 2023.09.29 14:19
Thanks
rumbacillo
24
rumbacillo 2023.09.20 09:34 
 

This indicator is priceless and provides solid guidance to trade every symbol. Thanks for coding it

Abdullah Alrai
97865
来自开发人员的回复 Abdullah Alrai 2023.09.20 09:35
Thank you mr for your kind words
fligods
288
fligods 2023.09.12 20:54 
 

用户没有留下任何评级信息

Abdullah Alrai
97865
来自开发人员的回复 Abdullah Alrai 2023.09.12 20:55
Thank you sir
SALAH198889
15
SALAH198889 2023.09.06 12:52 
 

用户没有留下任何评级信息

Abdullah Alrai
97865
来自开发人员的回复 Abdullah Alrai 2023.09.06 12:57
Thank you mr Salah for your kind words
回复评论
版本 1.1 2023.10.21
- improvements