Trend Sensor MT5
- Indicadores
- Yuriy Lyachshenko
- Versión: 1.30
- Actualizado: 20 noviembre 2023
- Activaciones: 5
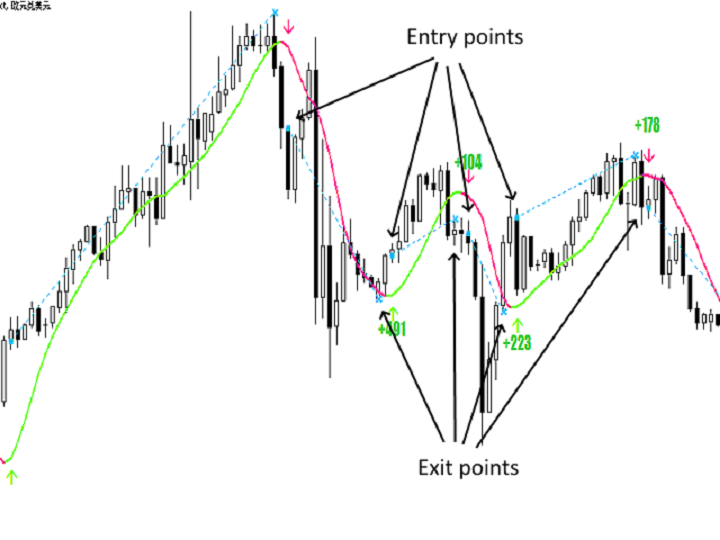
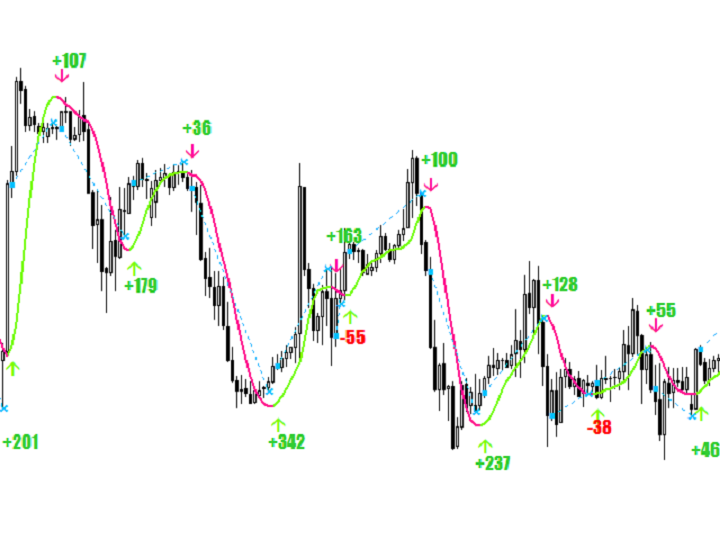
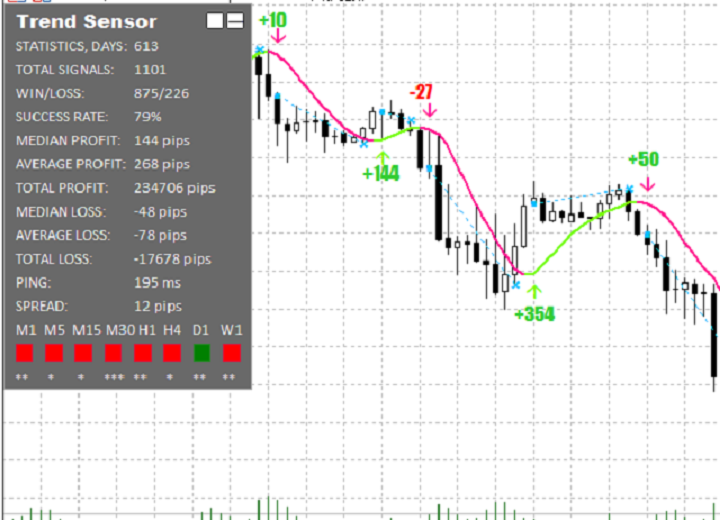
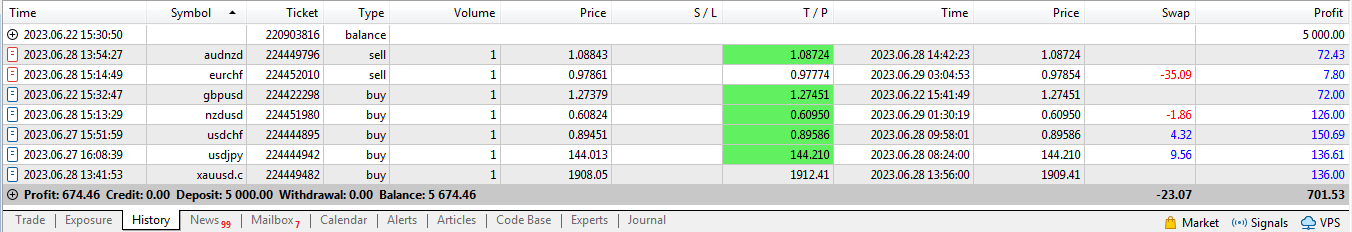
El indicador muestra los puntos de entrada y salida más adecuados. También muestra datos estadísticos sobre todas las señales para un mejor análisis de las operaciones.
Con la ayuda de este indicador podrá comprender mejor el mercado.
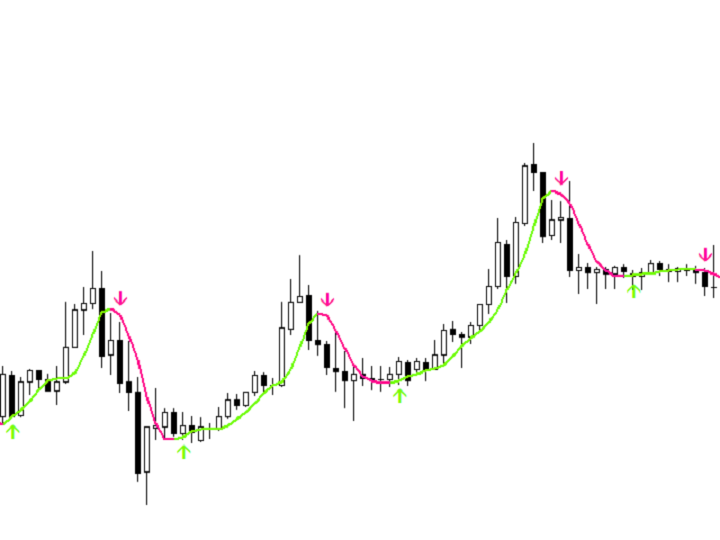
Tan pronto como la fuerza de la tendencia comience a debilitarse (esto se mostrará en el panel), la línea de tendencia gravitará hacia la posición horizontal - esta es la señal para salir de la operación. O puede salir cuando se alcance el nivel de beneficio medio/mediano.
El indicador fue el resultado de mi experiencia comercial desde 2010.
Versión del indicador para MT4
Características
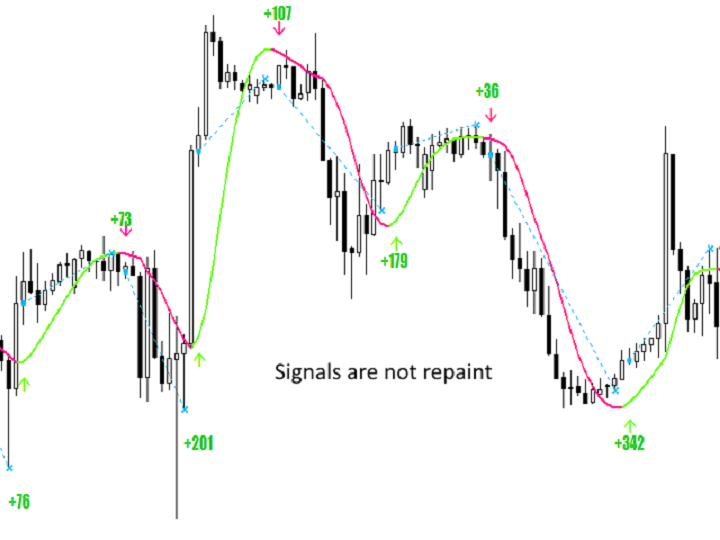
- Este indicador no se redibuja. Lo que se imprime en el gráfico histórico también se imprimirá en tiempo real.
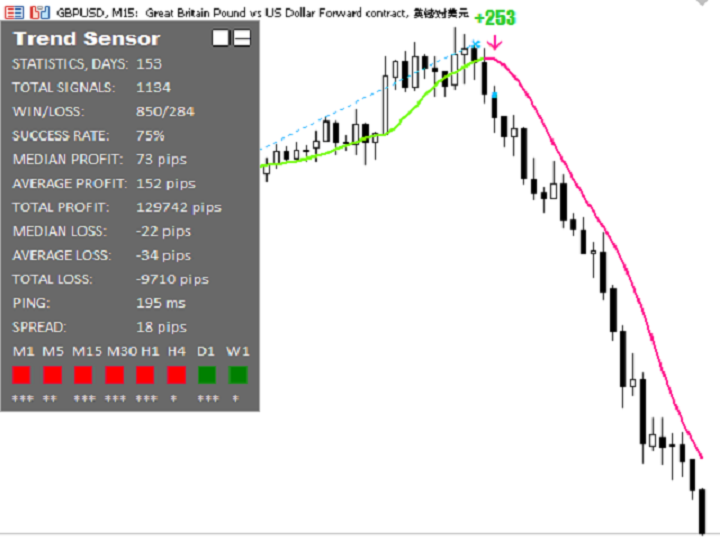
- Se puede utilizar para operar con cualquier activo: criptodivisas, acciones, metales, índices, materias primas y divisas.
- Funciona en todos los marcos temporales.
- Las señales para entrar aparecen en la apertura de una nueva vela.
- Las señales para salir de la operación se dan tentativamente, porque a menudo se puede cerrar la operación con un beneficio mayor.
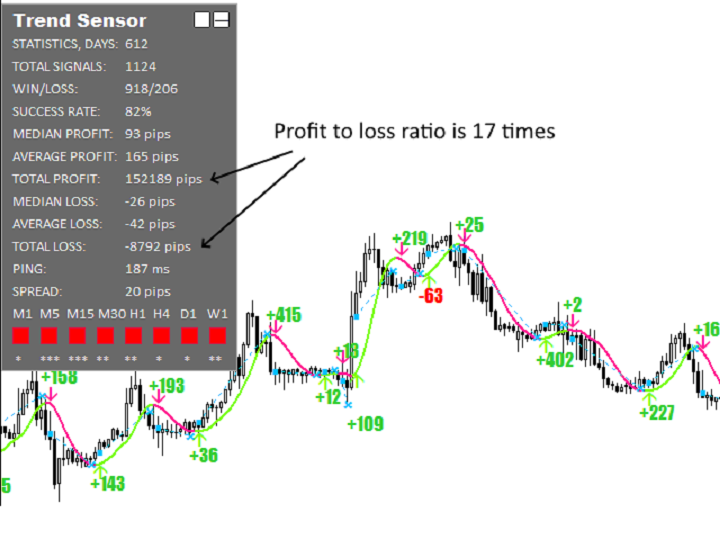
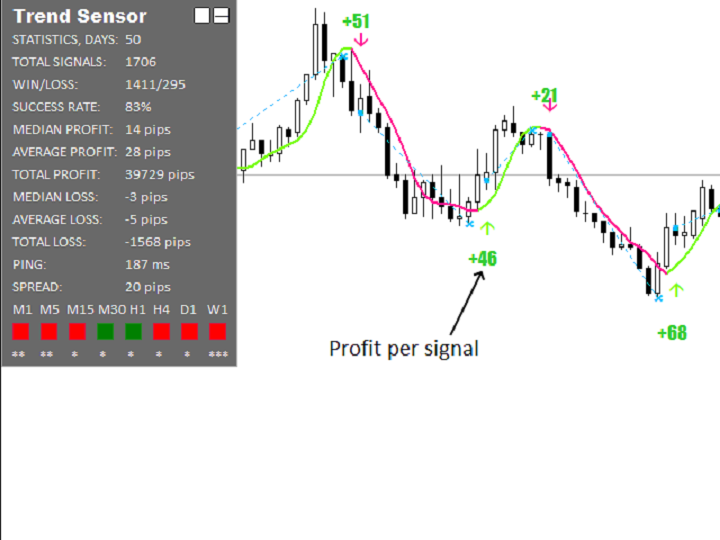
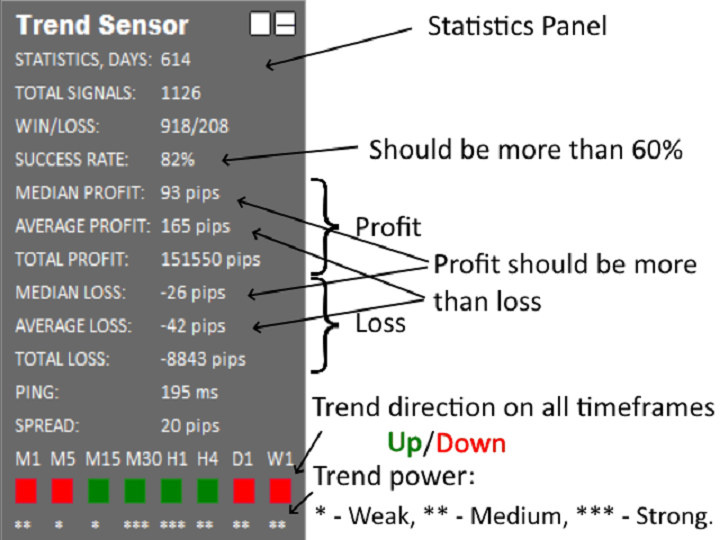
- En la parte superior izquierda hay un panel detallado de estadísticas de la operación, que se puede minimizar.
- Muestra la dirección de la tendencia y su potencia a la vez en marcos temporales de M1 a W1.
- Tiene un código ligero, por lo que no se carga y no ralentiza el terminal.
- Utiliza una fórmula especial para calcular la media móvil, que determina la dirección de la tendencia.
- Para no perderse una señal para entrar en una operación puede recibir notificaciones en la ventana de Alertas y en Push.
- Para usuarios de todos los niveles, desde principiantes hasta expertos.
Panel de estadísticas
- Número de días de los que se toma el histórico de señales.
- El número total de señales sobre las que se dan las estadísticas.
- La relación entre el número de señales rentables y perdedoras.
- El porcentaje del total de señales rentables.
- Beneficio mediano por señal.
- Beneficio medio por señal.
- Beneficio total de todas las señales.
- Pérdida mediana por señal.
- Pérdida media por señal.
- Pérdida total de todas las señales.
- Último ping al servidor del broker.
- Spread actual.
- Dirección de la tendencia ARRIBA/ABAJO en plazos de M1 a W1.
- Mide la fuerza de la tendencia: * Débil ** Media *** Fuerte.
Parámetros
| Trading style | Agresivo Medio Seguro (sensibilidad del indicador, cuanto más sensible más señales) |
| Working hours | indicador de horas laborables en las que aparecen las señales de intervalo para entrar en el mercado (el formato de hora debe ser xx:xx-xx:xx, por ejemplo 00:00-23:59) |
| Show statistics | on/off mostrar panel estadístico de señales en la esquina superior izquierda del gráfico |
| Show line | on/off mostrar línea de tendencia |
| Show arrows | on/off mostrar flechas cuando cambia la tendencia |
| Show entry/exit | on/off mostrar puntos de entrada y salida del mercado |
| Use alert notification | on/off ventana emergente con notificación y aviso sonoro |
| Use push notification | on/off notificaciones push |
Si tiene alguna pregunta o dificultad, envíeme un mensaje privado.