Trend Sensor MT5
- Indicateurs
- Yuriy Lyachshenko
- Version: 1.30
- Mise à jour: 20 novembre 2023
- Activations: 5
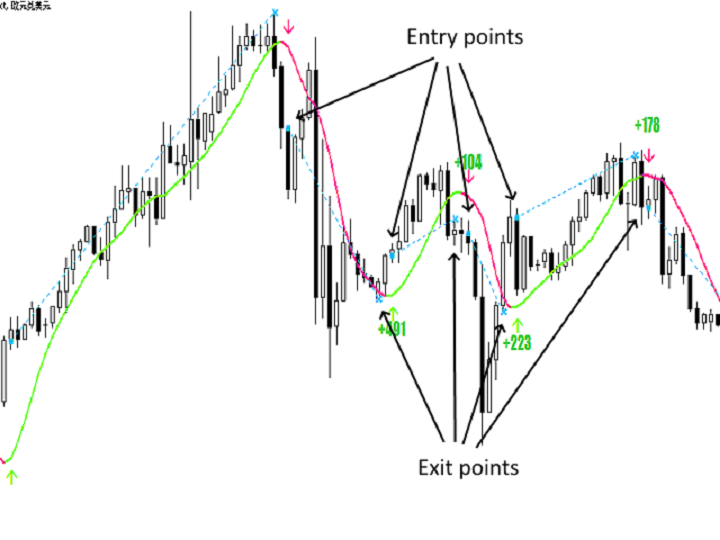
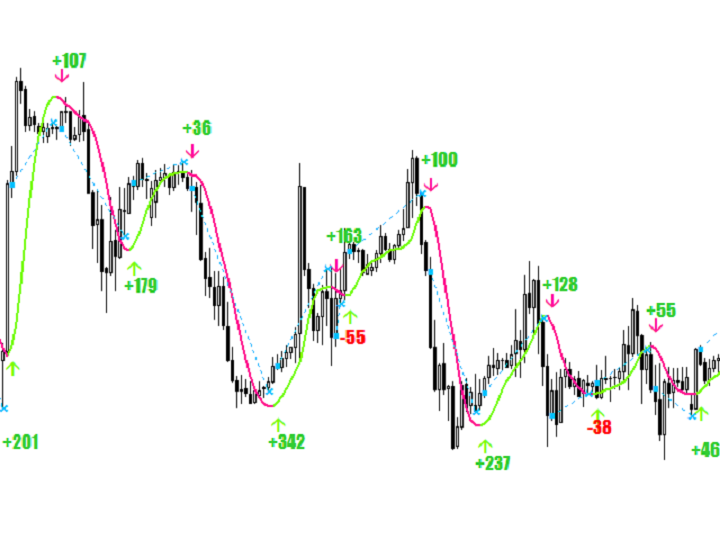
L'indicateur indique les points d'entrée et de sortie les plus appropriés. Il affiche également des données statistiques sur tous les signaux pour une meilleure analyse du trading.
Grâce à cet indicateur, vous pourrez mieux comprendre le marché.
Dès que la puissance de la tendance commence à s'affaiblir (ce qui sera indiqué sur le panneau), la ligne de tendance gravitera vers la position horizontale - c'est le signal pour sortir du trade. Vous pouvez également sortir lorsque le niveau de profit moyen/médian est atteint.
L'indicateur est le résultat de mon expérience de trading depuis 2010.
Version de l'indicateur pour MT4
Caractéristiques
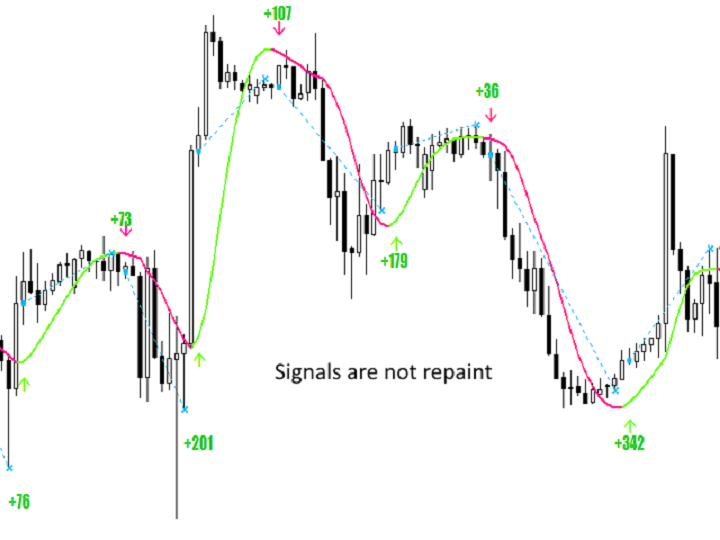
- Cet indicateur ne se redessine pas. Ce qui est imprimé sur le graphique historique sera également imprimé en temps réel.
- Il peut être utilisé pour trader tous les actifs : cryptocurrencies, actions, métaux, indices, matières premières et devises.
- Fonctionne sur toutes les échelles de temps.
- Les signaux d'entrée apparaissent à l'ouverture d'une nouvelle bougie.
- Les signaux de sortie de la transaction sont donnés à titre indicatif, car il est souvent possible de clôturer la transaction avec un bénéfice plus important.
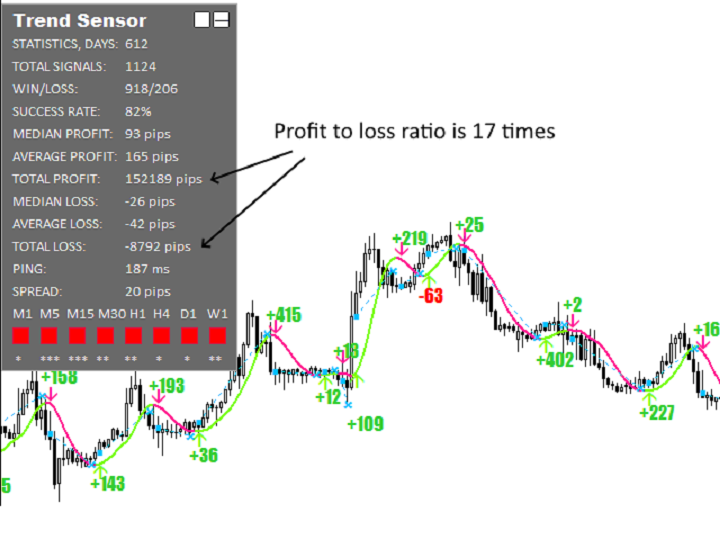
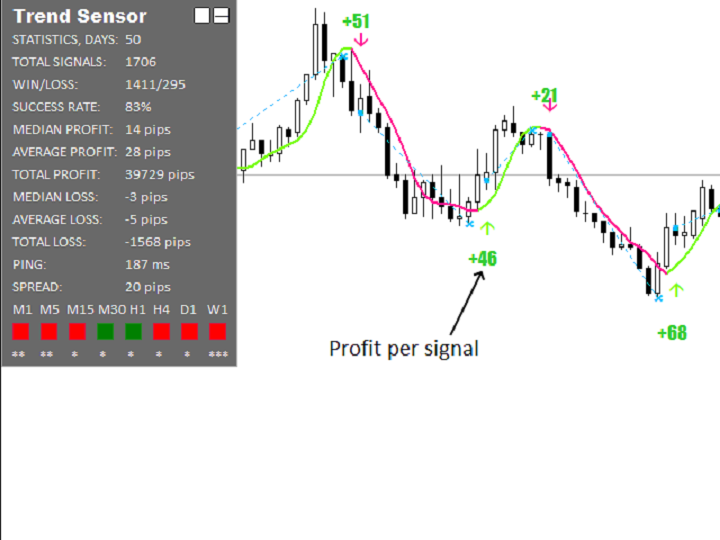
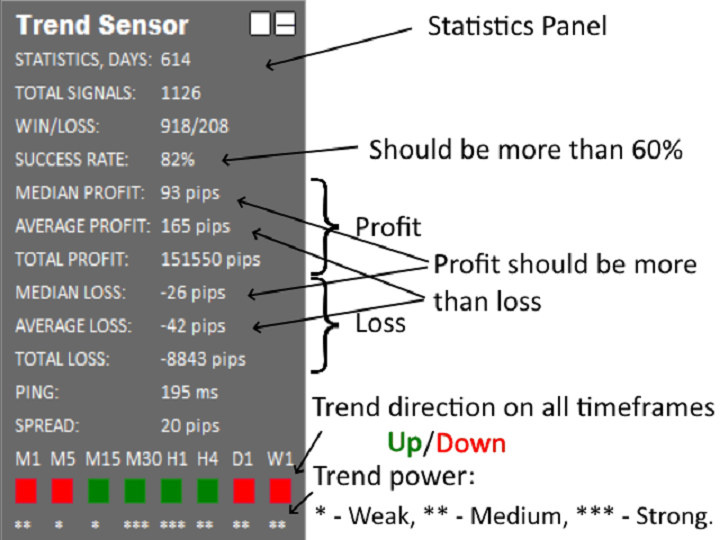
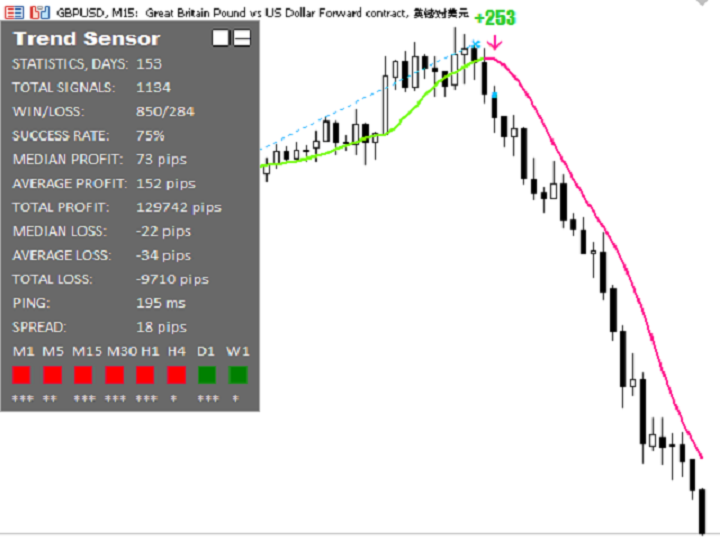
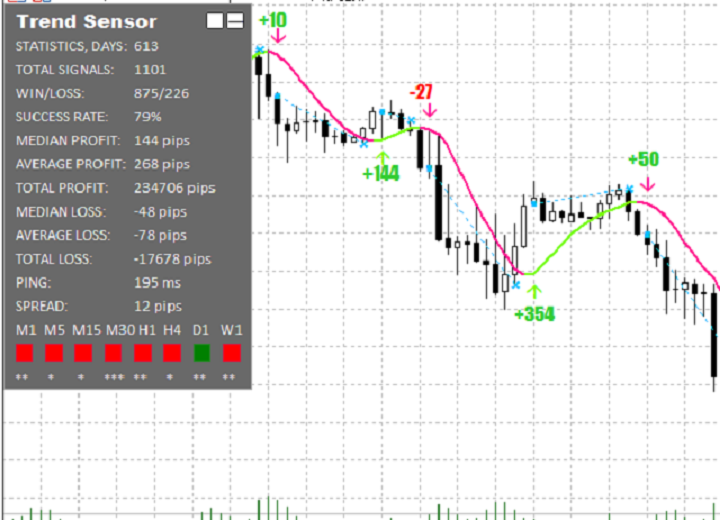
- En haut à gauche se trouve un panneau détaillé des statistiques de l'opération, qui peut être réduit.
- Montre la direction de la tendance et sa puissance à la fois sur les échéances de M1 à W1.
- Son code est léger, de sorte qu'il ne se charge pas et ne ralentit pas le terminal.
- Utilise une formule spéciale pour calculer la moyenne mobile, qui détermine la direction de la tendance.
- Afin de ne pas manquer un signal pour entrer dans une transaction, vous pouvez recevoir une notification dans la fenêtre d'alerte et sur Push.
- Pour les utilisateurs de tous niveaux, des débutants aux experts.
Panneau de statistiques
- Nombre de jours à partir desquels l'historique des signaux est pris en compte.
- Le nombre total de signaux sur lesquels les statistiques sont données.
- Le rapport entre le nombre de signaux rentables et le nombre de signaux perdants.
- Le pourcentage du nombre total de signaux rentables.
- Profit médian par signal.
- Profit moyen par signal.
- Profit total de tous les signaux.
- Perte médiane par signal.
- Perte moyenne par signal.
- Perte totale de tous les signaux.
- Dernier ping vers le serveur du courtier.
- Spread actuel.
- Direction de la tendance HAUT/BAS sur les échelles de temps de M1 à W1.
- Mesure la puissance de la tendance : * Faible ** Moyenne *** Forte.
Paramètres
| Trading style | Agressif Moyen Sûr (sensibilité de l'indicateur, plus il est sensible, plus il y a de signaux) |
| Working hours | heures de travail de l'indicateur pendant lesquelles apparaissent les signaux d'intervalle pour entrer sur le marché (le format de l'heure doit être xx:xx-xx:xx, par exemple 00:00-23:59) |
| Show statistics | oui/non afficher le panneau des statistiques des signaux dans le coin supérieur gauche du graphique |
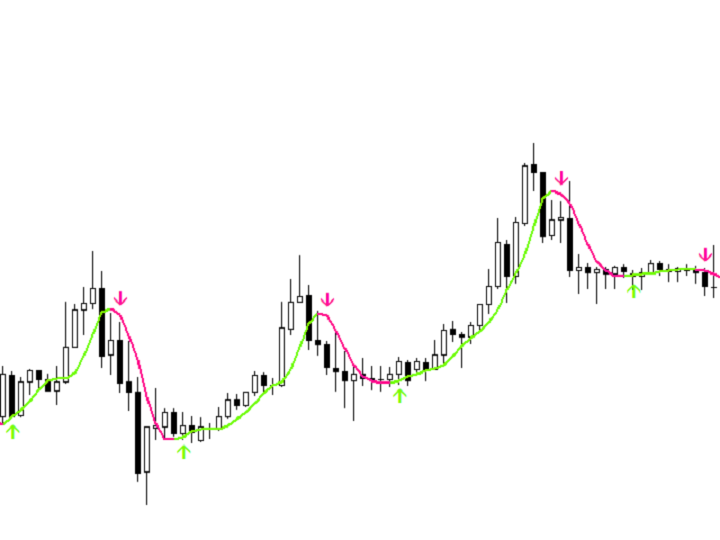
| Show line | oui/non afficher la ligne de tendance |
| Show arrows | oui/non afficher les flèches en cas de changement de tendance |
| Show entry/exit | oui/non afficher les points d'entrée et de sortie du marché |
| Use alert notification | oui/non fenêtre pop-up avec notification et notification sonore |
| Use push notification | oui/non notification push |
Si vous avez des questions ou des difficultés, veuillez m'envoyer un message privé.