Nuevos robots comerciales e indicadores para MetaTrader 5 - 65

Get the best out of your forex trading experience with our Superb Trend indicator! Our revolutionary technology helps you make smarter and more successful trades, no matter your skill level. With a simple and intuitive interface, you'll be able to analyze trends and make wiser decisions in no time. Stop gambling with your money; start leveraging our Superb Trend Indicator to outperform the market!
Trend Signals: Bullish trend will show as Green line. Bearish trend will show as Red line.
Su

UPDATE v1.0 IS OUT - PLEASE READ ALL THE DESCRIPTION BEFORE USE IT LL Pursuit EA is an advanced and smart multi-currency trading system , based on the combined and weighted use of different decision factors. The algorithm uses real-time data from 14 currency exchanges , the most liquid and weighted on the market, combined with the calculation of various indicators , including moving averages, accumulation and distribution volumes, currency strength and trend continuity, to automatically take op
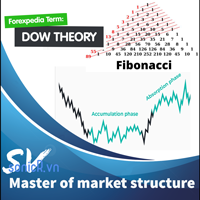
This indicator combine DOW theory with Fibonancy level to determine the structure of financial markets. It include resistance determine to provide an overview of the market. The Dow Theory is an approach to trading developed by Charles H. Dow, who, with Edward Jones and Charles Bergstresser, founded Dow Jones & Company, Inc. and developed the Dow Jones Industrial Average in 1896. In summarize, DOW theory is: + Technical framework that predicts the market is in an upward trend if one of its aver

Onic Scalper EA use Breakout Strategy and Trend Following Strategy for Scalping Trading Methods
This EA trades the breakouts from daily relative highs and lows. For the entry, stop orders are used for the fastest possible execution. Profits can be secured by the adjustable trailing stop. The backtests shown in the screenshots were done with the default settings. There might be better or worse settings. Please download the free demo to do your own testing.This EA does not use any martingale an

Events Timer EA allows you to place a trade at a specific time and close it at a specific. The stop loss is trailed automatically. The EA performs one trade at time until the time elapses. Since it has a Trailing Stop, it will open another trader when it gets stopped out. It is ideal for trading news events using a very short trading time. Inpits: -Trade Time -Stop Trade Time -Trade Type(buy/sell) -lot -stoploss points
El indicador se utiliza para el auge comercial y Crash, es un superdetective de tendencias. Cuando el mercado tenga una tendencia alcista, utilice la señal fuerte para capturar el pico, cuando esté en una tendencia bajista, use la señal normal para capturar más picos.
El indicador es una base de acción del precio por naturaleza con algunas lógicas matemáticas. Se usa solo para atrapar picos.
El indicador posee la siguiente salida
1. Señal fuerte
2. Señal regular
3. Alerta por correo e

This indicator shows OutsideBars (OB) and InsideBars(IB) in the chart in candle form.
The colors of the candles can be set individually. Also different colors for bearish and bullish IBs or OBs are possible.
In addition, the color of the wicks or Outlines can also be set.
OutsideBars and InsideBars often show good zones for support or resistance. See the Screenshot for some examples.

The Price Action Finder Multi indicator is an indicator of entry points that searches for and displays Price Action system patterns on dozens of trading instruments and on all standard time frames: (m1, m5, m15, m30, H1, H4, D1, Wk, Mn). The indicator places the found patterns in a table at the bottom of the screen. By clicking on the pattern names in the table, you can move to the chart where this pattern is located. Manual (Be sure to read before purchasing) | Version for MT4 Advantages
1. Pa
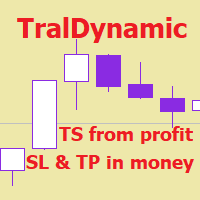
The utility for managing open positions can work with stops (take profit and stop loss) in money, percentages or points. The built-in trailing stop starts working from profit, the size of which can be set in currency or as a percentage. With the help of the built-in trading simulator, you can check how the utility works in the strategy tester. Benefits setting stop loss and take profit in the deposit currency, as a percentage of the account balance or by points; adding stop loss and take profit
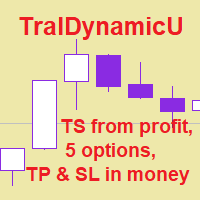
The utility for managing open positions can work with stops (take profit and stop loss) in money, percentages or points. The built-in trailing stop starts working from profit, the size of which can be set in currency or as a percentage. Trailing stop can work in three modes and for five instruments. With the help of the built-in trading simulator, you can check how the utility works in the strategy tester. Benefits setting stop loss and take profit in the deposit currency, as a percentage of the

Binary Trade Panel es una herramienta muy útil para operar con opciones binarias en la plataforma MT4/MT5. Ya no es necesario configurar complementos fuera de MT4/MT5. Este es un panel simple y conveniente directamente en el gráfico MT4/MT5. El Panel de comercio binario es una herramienta útil para los comerciantes que utilizan la plataforma MT4/MT5 para operar con opciones binarias. Es un panel simple y conveniente que permite a los operadores realizar transacciones de opciones binarias direct
OPTIMICE EA ANTES DE PROBAR Y UTILIZAR.
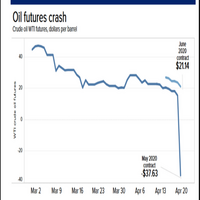
Los futuros de petróleo crudo se crearon con datos reales del mercado de futuros en períodos de tiempo de 1 hora desde enero de 2022 hasta diciembre de 2022. Pruebe estas fechas para realizar pruebas y análisis retrospectivo. Optimice cuando sea necesario.
Opere desde el mercado de futuros real o, si opera con cualquier derivado del petróleo, pruebe los parámetros para ver cómo se ajustan a los datos y al corredor que está utilizando. Los futuros son

ESTE EA TIENE ENTRADAS OPTIMIZABLES.
Nice Little Bot cotiza GBP/USD en gráficos de 1 hora. Se negocia utilizando canales de Keltner, bandas de Bollinger y LWMA por lógica. Fue creado con aprendizaje automático y es un pequeño robot agradable.
Hay entradas que podrían optimizarse o cambiarse si las encuentra. La gestión del dinero utiliza un porcentaje escalado del saldo. Hay un % de saldo y lotes máximos. Pruebe en la prueba de espalda comenzando
de 2013.
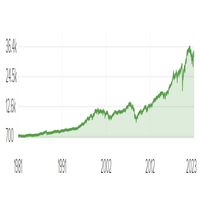
El EA es optimizable y se optimiza desde enero de 2022.
Dow Jones Lot Trader se creó con aprendizaje automático y negocia los futuros Dow Jones en gráficos de 1 hora utilizando lotes fijos. El EA se hizo sobre datos de futuros reales en el micro Dow Jones.
Es posible que deba realizar una prueba retrospectiva si está negociando derivados del Dow Jones para ver si se alinea con los datos de futuros reales. El sl y el tp se basan en el rango verdadero promedio.
La lógica en el EA es que int

Exclusiva herramienta de intercambio de copias dedicada ActivTrades!
Recursos:
- Gestión para la copia de EAs usando Número Mágico, permitiendo que la cuenta Master cargue más de una estrategia. Esto hace posible que las cuentas Esclavas conectadas manejen las señales recibidas y el volumen negociado individualmente; - Sistema de copia por factor multiplicador de lote fijo o cuenta maestra; - Multiplicador de órdenes: resuelva los límites de liquidez en CFD exóticos; - Funciones Hide Stop

Defining Range ( DR ) and Implied Defining Range ( IDR ) indicator Pro with added features from free version
Show DR and IDR ranges Sessions on the chart for RDR Regular defining range (New York Session)
ADR After defining range (Asian session) ODR Outside defining range (London Session)
Buttons on chart to enable / disable :
Show Imbalance ( IMB ) Show Volume Imbalance ( VIB ) Show Gap's between open and close
Show Standard Deviation ( SD )
Show last 3 Sessions

Vortex utiliza momentos de baja volatilidad para ingresar operaciones basadas en indicadores. Luego administra esas operaciones con stop loss dinámicos y toma de ganancias también en función de los indicadores. Un modo de seguridad reduce aún más las posibles pérdidas en función de algunas fórmulas matemáticas múltiples incrustadas en los códigos. Todo lo que intento decir es que Vortex es estable y confiable.
Versión MT4: https://www.mql5.com/en/market/product/91678
Para obtener una descr

Índico Tech Hedge Copyer - ¡Sistema de Cobertura para Escritorios Propietarios!
Nuestras características exclusivas:
- Copiadora de operaciones inversas; - Operar en la contraparte de los comerciantes en su mesa de negociación; - Seleccione el volumen de operaciones a revertir en porcentaje; - Sistema de base de datos inteligente para el control de los comerciantes conectados.
• ¡Envíenos un mensaje y obtenga la versión de prueba!
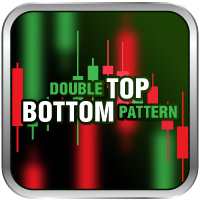
¿Qué es la doble parte superior e inferior?
Los patrones de doble techo y suelo son patrones gráficos que ocurren cuando la inversión subyacente se mueve en un patrón similar a la letra "W" (doble fondo) o "M" (doble techo). El análisis doble superior e inferior se utiliza en el análisis técnico para explicar los movimientos en un valor u otra inversión, y se puede utilizar como parte de una estrategia comercial para explotar patrones recurrentes.
Puedes encontrar la versión MT4 aquí.
E

Forex Fighter es un sistema avanzado de múltiples divisas que opera con los siguientes símbolos: EURJPY, GBPCHF, EURGBP, USDCAD, AUDNZD, USDJPY y AUDCAD. La estrategia se basa en indicadores integrados que desarrollé yo mismo. Forex Fighter sigue patrones únicos que son repetitivos, pero muy a menudo el cerebro humano no es capaz de detectarlos. El tomador de decisiones aquí son dos redes neuronales que deben acordar si se colocará o no una operación en particular. La probabilidad de repetir un
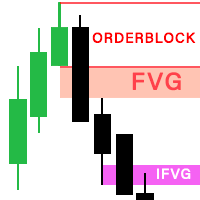
The latest version 2.0 of the FVG Indicator is fully integrated into an all-in-one package, including: Fair Value Gaps (FVG). See more => How to trade with FVG Implied Fair Value Gap (IFVG). See more => How to trade with IFVG OrderBlock (OB). See more => How to trade with OrderBlock The options in the settings section are relatively easy to navigate, and you can even use them right away upon activation without encountering difficulties when using the default configuration. The indicator utilize
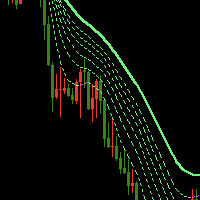
The Waterfall Trend Indicator MT5 uses line regression algorithm, using "Waterfall" in its name is in that it like waterfall when there is a strong down market trend. The indicator draws seven lines, one of which is sold line, others are dash line, the sold line is more stable. Indicator introduction The indicator can effectively filter price noise since it is calculated with line regression. It can be used to analyze market trend and design new expert that is based on trend. When the trend lin

The purpose of using Smart money index (SMI) or smart money flow index is to find out investors sentiment. The index was constructed by Don Hays and measures the market action. The indicator is based on intra-day price patterns. The beginning of the trading day is supposed to represent the trading by retail traders. The majority of retail traders overreact at the beginning of the trading day because of the overnight news and economic data. There is also a lot of buying on market orders and shor
FREE

Golden Auto Bot one year running! Fully Futomated Trading System, with 8 trading setup for signals. The EA has been subjected to stress tests for a period of all time and passes every year . We DO NOT use Grid or Martingale. We backtest again, backtest real - running real As of now, the Golden Auto Bot primarily operates on the main pair XAUUSD and the secondary pair EUR-USD. With a minimum investment capital of 300 USD, the bot utilizes a micro lot size of 0.01. For the XAU pair, a mi

Percentile of Historical Volatility and Correlation Coefficient shows if the asset is cheap or expensive based on the volatility. It is used to determine a good entry point. It has two indicators built in: Historical Volatility is ranked percentile wise and its correlation to price action which gives an indication of the direction of a possible future move. Together the both indicators can give good entries and direction. Historical Volatility is a statistical measure of the dispersion of retu

This z-score indicator shows the correct z-score of an asset, as it uses the normalized price data for calculation, which is the only correct way. Z-score is only applicable for normal distributed data, therefore not the actual price is considered, but the normalised returns, which were assumed to follow a normal distribution. Returns are mean reverting and assumed to follow a normal distribution, therefore z-score calculation of returns is more reliable than z-score on price, as price is NOT m

The indicator ‘Probability Range Bands’ gives a prediction of the amount, how much the asset is moving from its current price. The range bands give probabilities, that the candle close will not exceed this certain price level. It is also called the expected move for the current candle close. This Indicator is based on statistical methods, probabilities and volatility. Asset price is assumed to follow a log-normal distribution. Therefore, log returns are used in this indicator to determine the

Critical Trading, Currency Strength This indicator allows for viewing true value changes in the 8 major currencies, this ability has many applications for simple and advanced forex trading. No need to switch to inaccurate 3rd party applications or websites. Trend catching: No need to watch 28 charts, pair up the strongest and weakest performing pairs. Optimize entries: Show the currencies of your current chart and enter on reliable pullbacks for further confluence on your trades. Currency perfo
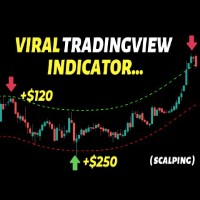
This indicator builds upon the previously posted Nadaraya-Watson Estimator. Here we have created an envelope indicator based on kernel smoothing with integrated alerts from crosses between the price and envelope extremities. Unlike the Nadaraya-Watson Estimator, this indicator follows a contrarian methodology. Settings
Window Size: Determines the number of recent price observations to be used to fit the Nadaraya-Watson Estimator.
Bandwidth: Controls the degree of smoothness of the envelop
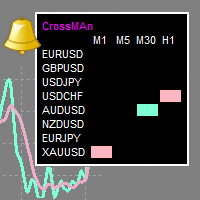
"CrossMAn" is a table indicator that gives signals about the intersection of two moving averages, on selected instruments and time periods.
The intersection of moving averages is one of the most popular signals on the stock exchange.
The signal is displayed as colored rectangles in the table. Thus, you can assess at a glance which tool should be paid attention to.
(Crossman does not add moving averages to the chart.)
The indicator table can be dragged with the mouse.
The size of the table
Trend Following Strategy Generator The following Expert Advisor helps to generate robust trend-following strategies using price action and a few parameters. the story behind the expert Advisor is to unfold market behavior for an instrument and choose how we can trade it best. After finding your favorite strategy you can save the parameters and start trading the strategy in no time. There is no limit to how many strategies you can generate. How will this EA help you? We all know trading is hard,

Sniper2 , Cuenta con puntos de lineas , con colores que te estan mostrando una entrada , que funcionan como soporte y resistencia ! las lineas de puntos verdes verde muestra entrada en venta , las lineas de puntos rojos muestra entrada en compra , fijarse en los soportes que funcionan como roptura para agarrar velas largas en mayor temporalidad . funciona para forex todo los pares funciona para indices sinteticos todo los pares ! indicador en oferta !

The EA Trend Pivot Point uses pivot values to choose a buy or sell trade and uses two indicators, STD and ATR, to measure market volatility and choose if market volatility is high not to trade. If the market volatility is less, then trading is allowed. Use pivot point calculations alone for probabilistic weighting of 10 AI pivot values. Based on a 20 year retrospective data backtest Resulting in the weight of this pivot value, for default it is for trading EURUSD Timeframe M15 which user can fin

Plutus scalper Plutus scalper es un robot completamente automatizado el cual basa sus trades en el momentum que toma lugar en específicos momentos del día. Este robot está basado en probabilidades y estudio de mercado realizado en los últimos anos, adicionalmente en administración de trade avanzada, garantizado un buen riesgo/recompensa y buena porcentaje de acierto. Los valores de entrada están configurados automáticamente por lo cual no es necesario ninguna optimización extra.
Característ

Sniper Clock Oscillator . es un indicador donde cumple con la estrategia del cruce de la linea de 50 con una linea azul y otra roja . se envia un alerta dando entrada en compra o venta ! muy efectivo y facil de usar se usa en los mercados de indices sinteticos ideal para los volatilitys y jumps . se usa en los mercados de forex , en todos los pares de divisas . se usa para scalping y para intra diario . sirve para agarrar largaas tendencias a altas temporalidades tambien ! Buen profit !

Rango Sniper ,
cuenta con una banda programado para cazar entradas perfectas .
lleva dos lineas que sirve para cazar pivots perfectos cuando salen las velas de la banda ,
sirven para todos los pares de indices sinteticos , perfecto para volatility y jumps
sirve tambien para el marcado de forex , se opera en todo los pares
sirve para hacer scalping y temporalidades mas altas !

Moving Level , Indicador especial para cazar tendencias y hacer scalping ! programado para usarlo en cualquier temporaliadad, cuenta con la extrategia del volumen de tendencia marcando una flecha si es long o short acompañado por los colores azul yellow y rojo cuando marca la linea yellow con la flecha hacia arriba y va acompañado por lineas azules es tendencia alcista Cuando marca la flecha hacia abajo con la linea yellow y va acompañado de lineas rojas es tendencia bajista , Se usa en

What is Alpha J? Alpha J is a fully automated system that trades the USD/JPY spike during the Tokyo session with great precision.
How is Alpha J built? Alpha J is developed based on our proprietary algorithms and statistical models, which are the result of our years of intensive in-house research into the price volatility around the Tokyo session. To avoid overfitting, Alpha J uses 80% of the price data to develop the model, and the remaining 20% to test and validate it.
How does Alpha J

This indicator shows external bars ("Aussenstäbe") in the chart in candle form.
The colors of the candles can be set individually.
Also different colors for bearish and bullish bars are possible.
In addition, the color of the wicks or outlines is also adjustable.
Outside bars are mentioned e.g. by Michael Voigt in the book "Das große Buch der Markttechnik".
All other candles are inner bars.
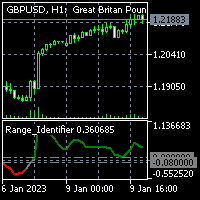
To get access to MT4 version please click here . - This is the exact conversion from TradingView: "Range Identifier" By "Mango2Juice". - All twelve averaging options are available: EMA, DEMA, TEMA, WMA, VWMA, SMA, SMMA, RMA, HMA, LSMA, Kijun, McGinley - This is a light-load processing and non-repaint indicator. - Buffer is available for the main line on chart and not for thresholds. - You can message in private chat for further changes you need.
An Ultimate Tool for quick and efficient market analysis. Unique combination of solid indicators defining market direction for trend tracking and filtration designed for you to stay on the right side of the market.
Market Rider Tools gives you access to one of the most used from professional trades indicators on worldwide, which were not build in for MT4 and MT5 terminals . These are unique non-repainting indicators designed to be used on all time frames for all instruments classes: Fo

An Ultimate Tool for quick and efficient market analysis. Unique combination of solid indicators defining market direction for trend tracking and filtration designed for you to stay on the right side of the market.
Market Rider Oscillators gives you access to one of the most used from professional trades indicators on worldwide, which were not build in for MT4 and MT5 terminals . These are unique non-repainting oscillators designed to be used on all time frames for all instruments class

Indicador Regressão Linear – Par de Ativos Indicador é um oscilador que faz o plot do Resíduo resultado da regressão linear entre os dois ativos inseridos como input do indicador, representado pela fórmula: Y = aX + b + R Onde Y é o valor do ativo dependente, X é o valor do ativo independente, a é a inclinação da reta entre os dois ativos, b é a intersecção da reta e R é o resíduo. O resíduo representa a quantidade da variabilidade que Y que o modelo ajustado não consegue explicar. E os resíduos
FREE

Indicador Regressão Linear – Par de Ativos - INTRADAY Indicador é um oscilador que faz o plot do Resíduo resultado da regressão linear entre os dois ativos inseridos como input do indicador, representado pela fórmula: Y = aX + b + R Onde Y é o valor do ativo dependente, X é o valor do ativo independente, a é a inclinação da reta entre os dois ativos, b é a intersecção da reta e R é o resíduo. O resíduo representa a quantidade da variabilidade que Y que o modelo ajustado não consegue explicar. E
FREE

Thank you for your interest in The Tail.
I have been trading since 2018. Or rather, it’s not me who trades, but the army of my robots, which I constantly develop. Tail is one such candidate.
This robot works on moving averages, filters trades by RSI.
The robot provides the functionality of volume and position control.
Combine different approaches. I recommend using it in a group of 3-5 of the same robots on different instruments for the best result.
I recommend keeping a high value of
FREE

Multipound Scalper MT5 is a multicurrency Expert Advisor that works with a customizable trading time filter, Moving Averages and Bollinger Bands Indicators to determine the market entry and exit points. ONLY 7 out of 10 copies left going at 62$ . NEXT PRICE : 98$ . SETUP The following is an overview of the settings used in this Expert Advisor: EA Comment = Comment of the order placed by the EA (Multipound Scalper). Fixed Lot size = 0.1 Use Risk = true (true means risk % will be used and false m

TurboAlgo EA MT5 is a fully automated expert that uses a cutting-edge multi-currency strategy. The algorithm analyses market volatility to find trading opportunities based on trend reversal strategies by using oversold and overbought conditions. TurboAlgo is a short to medium term price speculation based on the buying and selling force in the markets with trend reversal patterns
Link to MT4 version: https://www.mql5.com/en/market/product/91651 Link to live run of EA: https://www.mql5.com/en/si

EMA BASEd ON EMA, ICHIMOKU-Kejun-sen line and MACD input group "RSI Setting" input int Inp_RSI_ma_period = 7; // RSI: averaging period input ENUM_APPLIED_PRICE Inp_RSI_applied_price = PRICE_WEIGHTED; // RSI: type of price input double Inp_RSI_LevelUP = 60; // RSI Fast and Slow: Level UP input double Inp_RSI_LevelDOWN = 40; // RSI Fast and Slow: Level DOWN input string

Brilliant Knight , the majestic Knight rises with great intellect at your service.
The K night is a unique piece in the game of C hess , represented by a horse's head and neck. It maneuvers two squares vertically and one square horizontally, or two squares horizontally and one square vertically. It is has a unique ability of jumping over other pieces, just as the unique power you require to success in the forex market.
It has proved itself for stability & sustainability from 2018 to

Fibonacci retracement levels—stemming from the Fibonacci sequence—are horizontal lines that indicate where support and resistance are likely to occur. Each level is associated with a percentage. The percentage is how much of a prior move the price has retraced. The Fibonacci retracement levels are 23.6%, 38.2%, 61.8%, and 78.6%. While not officially a Fibonacci ratio, 50% is also used. The indicator is useful because it can be drawn between any two significant price points, such as

Build your own model to predict averages of turning points of the Triple Moving Average Oscillator. It is simple. Rate me with stars. Just load the indicator Triple Moving Average Oscillator in you platform and choose the period. Scroll through to observe the averages of the highs and lows over a period of time. Add the levels for a buy and a sell on the Triple Machine and this will show the average of highs and lows to look for buys and sell. You can load multiple copies with multiple levels.

"Recovery Drawdown" is an Expert Advisor (EA) specifically designed to address and overcome the challenge of drawdown in trading accounts. Drawdown occurs when an account experiences a series of consecutive losses, resulting in a significant decrease in available balance. This EA follows a cyclical strategy composed of several key steps. The first step is to close winning trades. This approach is implemented to secure the profits obtained up to that point and prevent them from turning into loss

The diamond top and bottom are reversal patterns. It represents a rally to a new high with a drop to a support level followed by a rally to make a new high and a quick decline, breaking the support level to make a higher low. The bounce from the higher low is then followed by a rally, but making a lower high instead. Once this behavior is identified, prices then break the trend line connecting the first and second lows and start to decline further. You can find MT4 version hier
Indicator show
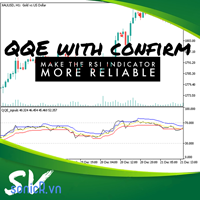
New QQE with confirm The relative strength index (RSI) is a technical indicator of momentum that measures the speed and change of price on a scale of 0 to 100, typically over the past 14 periods. Cause RSI measures the speed and change of price, trader normally use this indicator in two way: + Buy when oversold, sell when overbougth. + buy or sell when identifying divergence from rsi with price. In two way, it wrong when rsi in overbouth (for example) for long time or divergence. Even price ju

The strategy is based on the algorithm of a self-learning neural network and has been trained on history data. The EA opens a buy/sell order or avoids trading according to the market conditions. It is an Expert advisor that is made for a long-term vision. Considering that this expert must work 24 hours a day, it is better to use a VPS. If you have any other questions, please write me private messages and I will be happy to answer.
Timeframe: H1 Symbols: EURJPY,EURGBP,NZDJPY,GBPNZD,EURCAD

Stochastic Strategy Revealer This EA uses Stochastic Oscillator to generate strategies for almost all markets and trade them using this EA. How will this EA help you? We all know trading is hard, and creating a strategy is even harder, so this EA will let us sit back and let the strategies reveal themselves to us and select the ones we like. this ea was made to get rid of wondering and headaches and you will only search for good markets. Positions Sizing This EA uses the basic position sizing m
Swing Trade MA is auto trading Use a system of MA Fast crossover with MA Slow and in the AI(neural network) to measure the probability weights of 10 MA lines and using the Martingale system. Backtest tick data 100 % from 2003-2023 by default setting trading EURUSD Timeframe M15. Requirements Supported currency pairs: EURUSD Timeframe: M15 The minimum deposit is $5 00 for a 1:400 leverage EXPERT DESCRIPTION Variable Description Stop Loss Stop Lost Take Profit Take Profi

The EA AI Trend Price Action uses a trading strategy of Price Action and AI combined with Martingale The results of the backtest data 2003-2023. Using 100% reliable tick data, choose safe trades with very low risk even with martingale. But limiting the risk, not too high which can be set by the user himself as well. Requirements Supported currency pairs: EURUSD Timeframe: M30 The minimum deposit is $200 for a 1:400 leverage
The EA MultiIndy Hybrid Trend used to a trading system that combines 11 indicators 1. BOLLINGER BAND 2.RSI 3.MA 4.AO 5.MACD 6.CCI 7.MOMENTUM 8.FRACTAL 9.PARABOLIC SAR 10.STD 11.ATR and then AI to find the probability of each indicator as its weight value. Common use of martingale Then backtest twenty years to become this automated trading system. EA can send alerts through the program line, can adjust the risk. or turn off the martingale according to user requirements or can trade any currency

The EA MuliIndy Swing Trade uses a swing trade system + martingale system + neural network system + indicator strategy (AWESOME OSCILLATOR (AO),STD,ATR) working together to find the best profit and low drawdown for trading. using historical data statistics probability. Let's give the weight of each indicator, which gives good results when the graph fluctuates up and down. without looking at trends alone For EURUSD M15 best default setting EA, it can be used Optimization Backtest to trade other

The problem with trading candlestick patterns becomes obvious, after some experience in live markets. Hypothetical branching of candlestick patterns, are not necessary for successful trading. As a Price action trader, my principle is to keep things simple and consistent. My focus is on buying and selling pressure, which is visible in market structure. Trade Management and discipline are my secondary core elements. This indicator detect 4 Simple but Effective Price action Patterns! Yellow = Insi

Closes all Trades with click on a button. This button will appear on the right bottom side of the chart. When you remove the utility, the button will also dissappear. It closes all trades, no matter if Sell, Buy, the Symbol, if in profit or loss. One Click - and you solve it all. Especially made for demo and testing purposes. Use it with caution on live trading accounts!
FREE

The Trend Snatcher is a multi-timeframe indicator that detects swings on the price market chart. Important levels, such as Supply and Demand levels, Trendline touches, reversal patterns, and others, can also be added as confluence when making trading decisions.
The indicator employs two lines that aim for the highest selling and lowest buying levels. When the two lines cross, a signal is generated.
All trading instruments are compatible, including currency pairs, synthetic indices, metals

Drawdown Limiter EA You are in the right place if you were searching for Drawdown control, Drawdown limiter, Balance protection, Equity Protection or Daily Drawdown Limit related to Prop Firm, FTMO, or Funded account trading, or if you want to protect your trading account. Have you suffered from controlling your drawdown when trading funded accounts? This EA is meant for you. Prop firms usually set a rule called “Trader Daily Drawdown”, and if it is not respected, you are disqualified. I am an

"Step Ahead" es el mejor asesor experto para operar rupturas.
La estrategia consiste en operar una ruptura dentro de un rango de tiempo. Se ingresan la hora de inicio y la hora de finalización como entrada. Luego, el EA se encarga de establecer operaciones de ruptura al final del rango y manejarlas a través de múltiples mecanismos y funciones disponibles. El trade se cerrará si el SL o TP es alcanzado, y se puede configurar para cerrar todas las transacciones en un momento específico del día. L
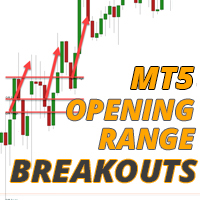
Benefíciese de los movimientos explosivos que se producen en la apertura de los índices bursátiles y obtenga una ventaja procesable todos los días. El EA de ruptura del rango de apertura se puede modificar a su gusto para capturar las tendencias que se forman justo después de la apertura todos los días en los principales índices bursátiles como DAX, DOW, NASDAQ y S&P500. Estas aperturas ocurren a la misma hora todos los días para que sepa cuándo ocurrirá la volatilidad y, a menudo, justo despué

## Si no puede usar la versión de demostración, contáctenos por mensaje.
## Opere profesionalmente usando WAPV Full y sea capaz de rastrear ¿Dónde está el dinero de los grandes jugadores? Imagina que tienes en tus manos una herramienta que solo hace la lectura de los principales jugadores del mercado, mostrando las mejores regiones comerciales basado en el análisis de Precio y Volumen. WAPV Full es una herramienta completa, 100% enfocada a la operativa de R. Wyckoff Además de mapear los mov

Schaff Trend Cycle, developed by Profectus.AI, is a cutting-edge trading bot harnessing the power of the Schaff system. This pro bono product showcases our expertise and offers a competitive edge in financial markets. CHAT WITH US! ===============================
YouTube ️ https://youtube.com/@profectusai
️ Instagram ️ https://www.instagram.com/profectusai
Telegram Trading Channel ️ https://t.me/ +ZFrbkNGIVLM2YjJk (Telegram)
WhatsApp ️ https://wa.me/message/C7PZYSF
FREE

Funciones
Indicador para el Trading de Retroceso de Fibonacci Se dibuja un gráfico de Fibonacci basado en la barra previa seleccionada entre 1H, 4H, 1D y 1W. Cuando el precio del mercado toca el nivel de Fibonacci, cambia el color y se muestra la hora del toque. El gráfico de Fibonacci se dibuja en los niveles -23.6, 0, 23.6, 38.2, 50, 61.8, 76.4, 100 y 123.6, y el gráfico se refresca cuando se actualiza la barra.
Variables
Marco de tiempo: Se dibuja un gráfico de Fibonacci con el marco
FREE

Send your trades on the Metatrader 5 platform to your Telegram Group!
Simple to use, just follow the steps below:
Create a group in Telegram and enter the name in the robot parameters; Create a Bot in Telegram with the user BotFather: Send the following message-> /newbot; BotFather will ask for a name for your Bot; Send a message with the desired name; BotFather will ask for a username for your Bot; Send a message with the desired username; BotFather will send the Token; Insert the
MetaTrader Market ofrece a todos los desarrollador de programas de trading una sencilla y cómoda plataforma para ponerlos a la venta.
Le ayudaremos con la presentación y explicaremos cómo preparar la descripción de su producto para el Market. Todos los programas que se venden a través del Market están protegidos por una codificación adicional y pueden ser iniciados sólo en el ordenador del comprador. La copia ilegal es imposible.
Está perdiendo oportunidades comerciales:
- Aplicaciones de trading gratuitas
- 8 000+ señales para copiar
- Noticias económicas para analizar los mercados financieros
Registro
Entrada
Si no tiene cuenta de usuario, regístrese
Para iniciar sesión y usar el sitio web MQL5.com es necesario permitir el uso de Сookies.
Por favor, active este ajuste en su navegador, de lo contrario, no podrá iniciar sesión.