Nuevos robots comerciales e indicadores para MetaTrader 5 - 157

Average True Range. Calculates last candle high and low for finding trends. Strong results with british pound in daily charts. Uses Atr modificable periods, trailing stop and take profit. Tested in real accounts. Is a great expert advisor with great results. You can choose the risk you want to take. Can calculate automaticaly the total amount of risk for new trades.

The script opens a separate window and displays information about the current open positions in it.
The informer will be useful to those who operate with a large number of positions open on different instruments in different directions.
It allows you to quickly decompose the loading of the deposit by instruments, visually identify the most tense places in the aggregate position. For the exposed stop orders, it calculates the total risks and goals.

Renko Graph Gráfico de Renko El indicador Renko en la ventana principal del gráfico en la ubicación con el precio actual. El indicador muestra los cambios de precio en forma de rectángulos ("ladrillos") en el contexto de un gráfico de cotización regular. El movimiento ascendente del precio, por el número de puntos especificado en la configuración, se marca agregando sobre el siguiente rectángulo anterior y movimiento descendente, debajo del rectángulo anterior. El indicador está diseñado para
Master KIT CONTIENE su ESTRATEGIA EN un asesor YA LISTO
Scalping / Trend / contrtrend / Flat = ¡todo en uno, apenas ajuste!
FORTS y FOREX
Las posibilidades del asesor son enormes. Las combinaciones de configuración le permiten implementar cualquier estrategia.
Utiliza un sistema de aumento de volumen sofisticado y confiable con una configuración simple
AJUSTES POSIBLES:
Dirección-sólo COMPRA, sólo VENTA o selección automática de la dirección por el indicador RSI Primer volume

MMM Zig Zag Strategy: The Expert Advisors uses its built-in Zig Zag indicator to determine the prices trends and calculates the signal to decide to open buy or sell positions. It sends an order, closes or moves the Trailing Stop loss position as the indicator works. With this indicator, the EA opens new orders and closes them at the right time You can define the time period of each day of the week the EA should not trade (the bad time to trade). Usually the period of day when the impact news ar
SignalDeMarker - stable in its work automatic adviser. The algorithm of the adviser's work is based on the definition of overbought / oversold market zones, built on the basis of an assessment of the current demand and the level of risk. The indicator is installed in the usual way, on a chart with a time period of D1 and works with any trading instrument. Options Expert_MagicNumber = 1234 - magic number
Signal_StopLevel = 50.0 - level of stop-loss (in points)
Signal_TakeLevel = 50.0 - Level
FREE

The Expert Advisor CoreX works with ticks on both netting and hedging account types. The internal algorithm uses a tick (not a bar) as a unit for analysis. The product works with 5-digit quotes. Requotes are critical. A broker with the minimum execution delay is required. The Expert Advisor does not use history stored in the database. It downloads history data online creating its own database stored in the internal memory. After the restart, the database is deleted and should be downloaded ag

ATR Accelerator Indicator informs you about strong price movements based on the ATR Indicator. This Indicator works for all Timeframes and Symbols, the strength of movements can be configured.
Important: Get informed about new Products, join our MQL Channel: https://www.mql5.com/en/channels/etradro
Useage This Indicator works for all Timeframes and Symbols, the strength of movements can be configured. Features works on all timeframes and forex pairs or indices. Alert and Notify function i
FREE

This indicator show color of trend. And combined with the average line, but be used on the hightest price and the lowest of the 26 period. The target entry at the level and the point of the route between 2 line for entry and exit position This is a first version, many problems is not supported and fine. Expected a contected from your friends To continue to follow the good products
FREE

Price action is among the most popular trading concepts. A trader who knows how to use price action the right way can often improve his performance and his way of looking at charts significantly. However, there are still a lot of misunderstandings and half-truths circulating that confuse traders and set them up for failure. Using PA Trend Reversal will be possible to identify high probability exhaustion moves of a trend. Features The indicator gives alerts in real-time when the conditions are me

Market profile was developed by Peter Steidlmayer in the second half of last century. This is a very effective tool if you understand the nature and usage. It's not like common tools like EMA, RSI, MACD or Bollinger Bands. It operates independently of price, not based on price but its core is volume. The volume is normal, as the instrument is sung everywhere. But the special thing here is that the Market Profile represents the volume at each price level.
1. Price Histogram
The Price Histogram

Spire - показывает трендовый, сигнальный, свечной прорыв в сторону верхней или нижней границы канала, а так же временную или долгую консолидацию в виде прямоугольного канала. Сигналы тренда не перерисовываются. В основу идеи индикатора входит Bollinger Bands.
Изменяемые параметры Signal trend -изменение цветовой гаммы сигнального символа тренда Lower limit - изменение цветовой гаммы нижней границы канала Upper limit - изменение цветовой гаммы верхней границы канала Internal field -изменение
FREE

WavesTrends Este oscilador es uno de los indicadores de mercado que se utilizan cuando el precio fluctúa dentro de un cierto rango. El oscilador tiene sus propios límites (superior e inferior), cuando se acerca, el participante del mercado recibe información sobre el mercado de sobreventa o sobrecompra. El indicador registra fluctuaciones de precios dentro de los límites de una cierta volatilidad. Si la señal del oscilador es confirmada por el gráfico de precios, entonces la probabilidad de un

Slick El indicador es un índice de fuerza relativa (RSI) de doble plancha con señales de alerta para tomar decisiones comerciales. El indicador sigue el precio, sus valores van de 0 a 100. El alcance del indicador es el mismo que el del indicador RSI regular. Descripción de la configuración del indicador: Period_1 - período para calcular el índice Period_2 - período principal de suavizado del indicador Period_3 - período secundario de suavizado del indicador MAMethod - método de suavizado Appl

Este la version personalizada de Gekko para el famoso indicador Heiken Ashi. Extiende el uso de las famosas barras de Heiken Ashi y calcula las señales de entrada y salida fuertes. Entradas Number of Bars to Plot Indicator: número de barras históricas para trazar el indicador, mantenerlo bajo para un mejor desempeño; Produce Arrow Signals: configura si quiere que el indicador muestre las flechas de señales para comprar/vender; Produces Signal Only When a Bar Closes: ponlo como true si desea q

Este es el indicador de Gekko de las cotizaciones y variaciones. El indicador resume cotizaciones y variaciones del símbolo actual en diferentes marcos de tiempo, así como otros símbolos correlacionados. Mantenga un registro de toda esta información en su grafico mientras está negociando para el apoyo en la toma de decisiones. Parámetros de entrada General Settings: configure cuales cotizaciones y variaciones quiere mantener para el día, la semana, el mes o el año actual, así como los graficos
FREE

Opening Range Indicator
Idea Toby Crabel introduced this way of trading in the ealy ninties in his book "Day Trading with Short Term Price Patterns and Opening Range Breakout". In simple terms this means to trade the brekouts from the limits of the first trading hour with the stop loss at the opposite side. I.e. if the first hourly candle meausres 40 points (Crabel calls this the "stretch") you set the stop loss at breakout level minus 40 points and the take profit at the breakout level plus
FREE

Solo se puede usar en EURCHF. El Asesor Experto es una gran herramienta que le permite controlar su comercio con facilidad y precisión. La herramienta se puede desplazar en el gráfico y ofrece las siguientes características:
Entrada de orden instantánea con un solo clic.
Entrada de órdenes pendientes utilizando etiquetas de precio y líneas de tendencias. Cierre de orden instantánea con un solo clic. Cierre de orden instantánea utilizando líneas de tendencia como niveles de salida que el broke
FREE

is a fully automatic Forex trading Expert Advisor. The robot can run on any instrument, but the results are better with EURUSD on the H1 timeframe. If you are a long-term investor looking at yearly profits with high Sharpe-ratio then Money magnet is a good option. Please check the comment part to share your settings with others and enjoy the latest optimal settings uploaded by other users.
Expert Advisor Advantages High Sharpe-ratio The EA does not use such systems as martingale, hedging, g

The EA uses two strategies, the first trend strategy the second reverse strategy can be enabled or disabled through the settings. The EA has been optimized for the last 10 years. The adviser uses a variety of indicators such as Bollinger Bands , Moving Average , Momentum with different settings for the most accurate signals. To close positions, stop loss and take profit are used, as well as additional methods of order modifications. Very easy to set up, does not require special knowledge. You c

BinaryPinMt5 is an indicator developed and adapted specifically for trading short-term binary options. The indicator's algorithm, before issuing the signal, analyzes many factors, such as market volatility, searches for the PinBar pattern, calculates the probability of success when making a deal. The indicator is set in the usual way. The indicator itself consists of an information window where the name of the trading instrument is displayed, the probability of making a successful transaction,

Highly configurable CCI indicator. Features: Highly customizable alert functions (at levels, crosses, direction changes via email, push, sound, popup) Multi timeframe ability Color customization (at levels, crosses, direction changes) Linear interpolation and histogram mode options Works on strategy tester in multi timeframe mode (at weekend without ticks also) Adjustable Levels Parameters:
CCI Timeframe: You can set the current or a higher timeframes for CCI . CCI Bar Shift: you can set
FREE

What is The Waiter ?
It is an automated system to always be ready to catch the big movements of the market
How does it work?
Set the mode (stop or limit) Set the pending orders distance Set Take Profit / Stop Loss Wait for the big candle
settings:
entry : 0.OFF (the expert advisor won't operate. only for chart info purposes.) 1.New candle, new STOP orders (each new candle two stop orders are placed. If they are not activated by the end of the candle, they will be cancelled) 2.New candle
FREE

Delta EMA is a momentum indicator based on the changes of closing price from one bar to the next. It displays a histogram of the exponential moving average of those changes, showing magnitude and direction of trend. Positive delta values are displayed as green bars, and negative delta values are displayed as red bars. The transition from negative to positive delta, or from positive to negative delta, indicates trend reversal. Transition bars that exceed a user specified value are displayed in br

What is The Waiter ?
It is an automated system to always be ready to catch the big movements of the market
How does it work?
Set the mode (stop or limit) Set the pending orders distance Set Take Profit / Stop Loss Wait for the big candle
settings:
entry : 0.OFF (the expert advisor won't operate. only for chart info purposes.) 1.New candle, new STOP orders (each new candle two stop orders are placed. If they are not activated by the end of the candle, they will be cancelled) 2.New candle

Индикатор Color служит помощником для начинающего или опытного трейдера для выявления краткосрочного тренда или глобального в зависимости выбранного тайм фрейма, а так же для выявления флетовой зоны, которая очень хорошо видна в местах длинной проторговки в одной зоне индикатора Color. Индикатор не перерисовывается на завершённой свечи , но в моменте появления свечи и образования сигнала, может быть отклонён в прорисовке. Особенности работы индикатора Хорошо определяет тренд на волатильных инстр
FREE

This indicator obeys the popular maxim that: "THE TREND IS YOUR FRIEND" It paints a GREEN line for BUY and also paints a RED line for SELL. (you can change the colors). It gives alarms and alerts of all kinds. IT DOES NOT REPAINT and can be used for all currency pairs and timeframes. Yes, as easy and simple as that. Even a newbie can use it to make great and reliable trades. NB: For best results, get my other premium indicators for more powerful and reliable signals. Get them here: https://www.m
FREE

IndCorrelationTable Tabla de correlación de Ind : diseñada para ayudar a un comerciante que opera en el mercado Forex utilizando el método basado en la dependencia de correlación de los pares de divisas. La dependencia de correlación entre dos instrumentos se calcula mediante el coeficiente de K. Pearson y C. Spearman. La función principal de la tabla es emitir una señal formalizada sobre la posibilidad de abrir una "canasta" de transacciones de acuerdo con los parámetros preestablecidos, así co

Tarzan El indicador se basa en la lectura del índice de fuerza relativa.
La línea rápida son las lecturas del índice del período senior, se vuelve a dibujar para el número de barras que caben en una barra del período senior, por ejemplo: si las lecturas del indicador del período H4 se establecen y el indicador se establece en M15 , el rediseño será de 16 barras en el período M15.
La línea lenta es un índice de promedio móvil suavizado.
El indicador utiliza diferentes tipos de señales para t

Preferred pair for USDCAD trading
Conditions for purchases of the trading system "Ozy_M15":
1) The price is above the moving average SMA 48. 2) Price correction starts down, but the moving average within this correction should not be crossed by the candle body. 3) At the same time, the correction itself should be at least as deep as the bottom line of the Ozymandias indicator. 4) After this, as soon as the closing price of the next candle is higher than the upper line of the Ozymandias indic
FREE

Dynamic Theoretical Stop
Histogram indicator that dynamically analyzes the theoretical Stop levels in real time.
Operation :
The DTS - Dynamic Theoretical Stop does a mapping of fractals in previous candles and suggests two levels of Stop: For purchase and for sale.
Suggested reading :
It is necessary to make the definition of Maximum Stop in points in the Trading Plan. In this way, the trader can decide the best entry point by analyzing the theoretical stop levels:
Stop for sales: S
FREE

Rush Point Histogram Continuity force indicator. Operation: After a breach of support or resistance of an asset, the trader can understand by reading the histogram if such a move tends to continue, thus filtering false breaks or short breaks without trend formation. Through a simple, level-based reading, the trader can make a decision based on the histogram, where: Below 21: No trend formation 21 to 34: Weak trend 34 to 55: Strong Trend 55 to 89: Strong tendency Suggested Reading: Observed disru

Rush Point System
It is a detector indicator of breakage of support and resistance with continuity force.
Operation:
The Rush Point System detects in real time when a buying or buying force exceeds the spread limits in order to consume large quantities of lots placed in the book, which made price barriers - also called support / resistance.
At the very moment of the break, the indicator will show in the current candle which force is acting, plotting in the green color to signal purchasin

Highly configurable RSI indicator. Features: Highly customizable alert functions (at levels, crosses, direction changes via email, push, sound, popup) Multi timeframe ability Color customization (at levels, crosses, direction changes) Linear interpolation and histogram mode options Works on strategy tester in multi timeframe mode (at weekend without ticks also) Adjustable Levels Parameters:
RSI Timeframe: You can set the current or a higher timeframes for RSI. RSI Bar Shift: you can set th
FREE

This expert advisor trades a breakout strategy without using pending orders. It is a fully automated trading robot, which looking a turnover candle formations PivotPointHigh and PivotPointLow in the market. From these formations selects the strongest and these then form the supports and resistances, which are traded. The best results are achieved at higher TF from M30.
Continuous operation and quality ECN broker is recommended. A small StopLoss is set for each trade The default setting is for

Панель предназначена для быстрого визуального нахождения и отображения внутренних баров по всем периодам и на любых выбранных валютных парах одновременно. Цвет сигнальных кнопок, указывает на направление паттерна. По клику на сигнальную кнопку, осуществляется открытие графика с данным паттерном. Отключить не используемые периоды, можно кликом по его заголовку. Имеется поиск в истории (по предыдущим барам). Прокрутка (scrolling) панели, осуществляется клавишами "UP" "DOWN" на клавиатуре. Имеется

—— 进入本指标前,请谨记:『 不易,变易 』。拔开数理统计的枝叶,变化是不变的定理才是本指标的由来和内涵思想。本指标只应指明变化到不变之间的契机。 本指标——阴阳线指标(YiiYnn)由一条粗蓝色实线和一条细烟绿色虚线构成,粗实线叫阳线(Ynn),作为主线,细虚线叫阴线(Yii),作为辅线。本指标不同DeMarks去搜索哪个周期的最高最低,也不同Stoch那样告诉你超买超卖超过后缩小再等超买超卖直至资金的尽头。本指标是分析价格减速动态均值线的(偏)相关性及自相关性,并采用标准差的方法进行滤波以求趋势示意更明朗。所以,本指标有以下特性: 指标依据波浪理论,有二阶线性插值模拟组合多条均线(开收高低)构建波浪动力并分析它们各自相关性,所以将对趋势有很好的 预测性 ——与MACD、ATR等相比。它并非只让我们看到趋势的尾巴,请参考最后一张示例图; 指标采用简单的方差进行差相过滤,在兼顾计算性能的同时让盘整阶段的指示更明朗; 阳线与阴线之间是偏相关差相,具有阴消阳长相互激励、抵消的特点,因此命名; 本指标中判定的趋势与常人所称『趋势』不同,本指标中的趋势包括: 上涨、下跌和横盘 。不要忽略横盘
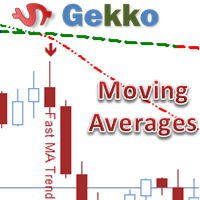
Este es el indicador de medias móviles de Gekko. Extiende el uso de las famosas medias móviles y calcula las señales de entrada y salida fuertes utilizando el precio en comparación con una media movile rápida versus una media movile lenta. Puedes configurarlo de muchas formas diferentes, por ejemplo: cruce de precios, cruce de medias móviles, tendencia de medias móviles, entre otros. Entradas Number of Bars to Plot Indicator: número de barras históricas para trazar el indicador, mantenerlo bajo

MMM Commodity Channel Index Mapped Timeframe Strategy: The Expert Advisors uses its two built-in CCI indicators in 12 different timeframes to determine the prices trends and calculates the signal to decide to open buy or sell positions; You can define the time period of each day of the week the EA should not trade (the bad time to trade). Usually the period of day when the impact news are published. This way the EA will trade only on good hours. General Inputs Closes orders with any profit of va

The indicator identifies divergences between chart and RSI, with the possibility of confirmation by stochastics or MACD. A divergence line with an arrow appears on the chart when divergence is detected after the current candle has expired. There are various filter parameters that increase the accuracy of the signals. To identify a divergence, point A must be set in the RSI, then point B Value must be edited, which sets the difference between point A and point B. The indicator can be used for tim

Telegram ChartSnap MT5 is an utility tool to bridge your MetaTrader 5 activities to your Telegram chat/group/channel. It will screen shot your MetaTrader 5 chart and send it to your dedicated Telegram chat/group/channel through a Telegram bot. The whole process will keep repeating based on a time cycle that predetermined by the user. It is a convenient tool for those who like to get access to their favorite system/dashboard that only available at MetaTrader Desktop. Beside that, trader can eas

Highly configurable Stochastic indicator.
Features: Highly customizable alert functions (at levels, crosses, direction changes via email, push, sound, popup) Multi timeframe ability Color customization (at levels, crosses, direction changes) Linear interpolation and histogram mode options Works on strategy tester in multi timeframe mode (at weekend without ticks also) Adjustable Levels Parameters:
Stochastic Timeframe: You can set the lower/higher timeframes for Stochastic. Stochastic Bar
FREE

The indicator shows the current spread of the symbol, the minimum, average and maximum values for the current bar in the form of digital, analog and graphic indicators. Has two modes of operation: fixing the system spread, or calculating the spread as the difference between the "Bid" and "Ask" prices on each incoming tick. Parameters The indicator has a single input parameter: Type of calculation - type of spread calculation. It can take the following values: System spread - the spread value
FREE

Not everyone can write an indicator. But anyone can have an idea. The indicator Universal Separate Window Free MT5 , which takes as an input parameter the formula by which the indicator line will be drawn, will help to implement it. This indicator is intended for use in the separate chart window.
All indicators of the series Universal :
Main window Separate window Free MT4 Universal Main Window Free MT5 Universal Main Window Free MT5 MT4 Universal Separate Window Free MT5 Universal Separate
FREE

Not everyone can write an indicator. But anyone can have an idea. The indicator Universal Main Window Free MT5 , which takes as an input parameter the formula by which the indicator line will be drawn, will help to implement it. This indicator is intended for use in the main chart window.
All indicators of the series Universal :
Main window Separate window Free MT4 Universal Main Window Free MT5 Universal Main Window Free MT5 MT4 Universal Separate Window Free MT5 Universal Separate Window F
FREE

"Just copier" is designed to copy trading without any complicated settings. The copy can be done in one PC. One EA can be set as master (provider) or slave (receiver). The receiver lot can be set to multiple providers lots. Please also check this product at fxina.hostingerapp.com. Any type of copy is available. MT4 -> MT5 MT4 -> MT4 MT5 -> MT5 MT5 -> MT4 If you want to copy MT4 -> MT5 or MT5 -> MT4, please purchase "Just copier" for MT4 and "Just copier" for MT5 separately. Just Copier can copy

Мультитаймфреймовый индикатор показывает спрос и предложение, вырожденный через тиковый объем. Индикатор разделен на 3 зоны. Зона снизу показывает спрос и предложение текущего временного периода. Выше нее располагается значения показывающий таймфрейм старшего периода. В верхней зоне располагается отображение таймфрейма на 2 больше текущего. Пример: основной временной период 1 минута - будет отображаться в нижней зоне индикатора. Выше нее расположится 5 минутный период. В 3 зоне расположится 1

This is a multi-currency paired trading system.I won't go into the details of how it works, but what the user needs to care about is how it actually works. It is highly recommended that you download the product and test it thoroughly, including back testing with the historical data and foward testing in the simulated account. As this EA trades multiple currency pairs, relevant historical data will be automatically downloaded at the first time of its historical review, with data volume around 6GB

The indicator Universal Main Window MT5 works according to your rules. It is sufficient to introduce a formula, along which the line of the indicator will be drawn.
This indicator is intended for use in the main chart window.
All indicators of the series Universal :
Main window Separate window Free MT4 Universal Main Window Free MT5 Universal Main Window Free MT5 MT4 Universal Separate Window Free MT5 Universal Separate Window Free MT5 Full MT4 Universal Main Window MT5 Universal Main Windo

The indicator Universal Separate Window MT5 works according to your rules. It is sufficient to introduce a formula, along which the line of the indicator will be drawn.
This indicator is intended for use in the separate chart window.
All indicators of the series Universal :
Main window Separate window Free MT4 Universal Main Window Free MT5 Universal Main Window Free MT5 MT4 Universal Separate Window Free MT5 Universal Separate Window Free MT5 Full MT4 Universal Main Window MT5 Universal Ma

Introduction MT5 ships with the Envelopes indicator. This indicator allows you to create equidistant bands from a moving average by specifying a “deviation.” Unfortunately, the deviation is an arbitrary number. You might determine that 0.220 works well to contain 95% of close prices for USDCHF,H1, but when you change the period to H4, most of the bars are now outside the bands. So, I created this self-tuning indicator. Instead of specifying a percent “deviation,” you specify the percent of bars
FREE

Telegram ChartSnap MT5 is an utility tool to bridge your MetaTrader 5 activities to your Telegram chat/group/channel. It will screen shot your MetaTrader 5 chart and send it to your dedicated Telegram chat/group/channel through a Telegram bot. The whole process will keep repeating based on a time cycle that predetermined by the user. It is a convenient tool for those who like to get access to their favorite system/dashboard that only available at MetaTrader Desktop. Beside that, trader can eas
FREE

Советник FX Ilan Plus -это аналог советника, с добавлением множества дополнительных логик и возможностей для торговли, с оставленными настройками советника . Советник торгует по системе Мартингейл с увеличением последующих лотов в серии ордеров, с целью их усреднения. Первый ордер робот выставляет по сигналам встроенного индикатора. Так же советник имеет возможность прекращать торговлю в зависимости от новостей. FX Ilan Plus можно использовать либо на одном графике, либо на двух графиках в проти

MÁS DE 4 AÑOS DE RESULTADOS COMERCIALES EN VIVO YA -> https://www.mql5.com/en/signals/413850
NUEVA PROMOCIÓN: Sólo unos pocos ejemplares disponibles a 349$ Próximo precio: 449$ ¡Obtenga 1 EA gratis! Asegúrese de consultar nuestro " paquete combinado Ultimate EA " en nuestro blog promocional
!! ¡LEA LA GUÍA DE CONFIGURACIÓN ANTES DE EJECUTAR EL EA! -> https://www.mql5.com/es/blogs/post/705899 Otros resultados en vivo : https://www.mql5.com/en/signals/1931084
A
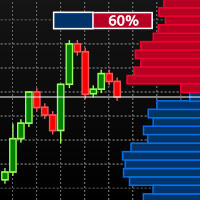
Visual Book on Chart is an indicator designed specially for stocks and futures market. To check if you can use the tool with your Broker open the MT5 Depth Of Market on your terminal and check if there are price and volume data available. Learn more about the MT5 Depth Of Market in the oficial page. The indicator shows the depth of market data on the chart window and use gradient based on the market data to colorize the histogram bars. The indicator is formed by two components: The panel, whic
FREE
Main: Not martingale, not a grid, working on all symbols; a good rational algorithm; Work of two indicators: RSI (from older timeframe - it works as a signal filter) and RSI (from junior timeframe - it works as a signal) ; There is a good money management system (there are several type for trailing stop loss); EA can work on closed candles, and on current candles; Quickly optimized (the work is maximally accelerated). Current sets after optimization are in comments.
If you want to do optimizat

El indicador muestra la oferta y la demanda degeneradas a través del volumen de ticks.
La línea roja es la línea de suministro.
La línea azul es la línea de demanda.
La línea verde es la línea de volumen total.
Situaciones típicas de lecturas de indicadores:
el rojo es más alto que el azul - la oferta es más alta que la demanda - el precio está bajando. el azul es más alto que el rojo - la demanda es más alta que la oferta - el precio está creciendo. las líneas roja y azul tienden a b
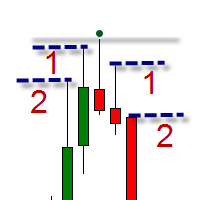
The indicator is intended for swing trading. The indicator is able to determine the trend and important trend peaks (swing), which will be important support / resistance levels. Features Simple visual displaying of 3 types of swings: Minor swings - do not affect the trend, but only on the movement within the trend Normal swings - can change the direction of the trend Strong swings - have a double confirmation of the importance of the level Visual displaying of the trend reversal Minimum of se

Siga el indicador de STOCKS SQUEEER: https://www.mql5.com/en/signals/503024
STOCKS SQUEEZER es un sistema de comercio que opera simultáneamente en varias acciones tratando de aprovechar su volatilidad. El EA abre una posición en cada acción especificada invirtiendo la cantidad inicial de dinero que ha establecido. La posición única se cierra cuando se alcanza la ganancia calculada calculada. En cambio, si el mercado va en contra, la posición aumenta y la toma de ganancias se mueve correctame

Velox indicator
Velox is a indicator that shows the tendency, force and direction of price based on the fractal 5-3.
Negotiation strategy Composed of 6 lines that oscillate above and below axis 0. Each line represents a fractal that is calibrated by Phi³. To identify a bullish trend, all rows must be above zero. Already a downtrend, all rows should be below zero.
Indicator Parameters: Period - Number of bars for indicator calculations. The user can select the shortest, medium and longest p

The indicator measures and displays the difference in the number of "Bid" and "Ask" prices changes in the form of digital, analog and graphic indicators. Designed for market research and for determine the moments of position closing during scalping trade with H1 or less timeframe. Use with bigger timeframe is not prohibited, but it is not informative because of a large number of accumulated values. Theory
"Bid" and "Ask" prices do not change simultaneously for most symbols. Often you can see h
FREE

Time And Sales Layout indicator shows traded buy and sell volumes right on the chart. It provides a graphical representation of most important events in the time and sales table. The indicator downloads and processes a history of real trade ticks. Depending from selected depth of history, the process may take quite some time. During history processing the indicator displays a comment with progress percentage. When the history is processed, the indicator starts analyzing ticks in real time. The l

The indicator measures and displays the difference in the number of "Bid" and "Ask" prices changes in the form of digital, analog and graphic indicators. Designed for market research and for determine the moments of position closing during scalping trade with H1 or less timeframe. Use with bigger timeframe is not prohibited, but it is not informative because of a large number of accumulated values. Theory
"Bid" and "Ask" prices do not change simultaneously for most symbols. Often you can see h

Trading robot X Forts
The scalper Forts EA is designed for futures trading on the Russian futures futures market (RTS, Sberbank, Gazprom, Ruble, etc.).
The main instruments are futures on the RTS, SBRF index. Recommended timeframes M1-M6.
The EA does not use averaging. Each trade has its own stop loss.
The size of the required GO for tests and trading on the selected instrument is taken from the instrument code.
Trading robot settings SL - stop loss Lots - lot for trading Pos_Market -

MathScalperPro FORTS
MathScalperPro FORTS this is an automatic trend trading system based on unique mathematical calculations. The Advisor calculates the trading levels of price corrections and enters the transaction in the direction of the trend. Inputs on levels are possible in two ways. The first way is to enter the candlestick pattern 1-2-3, and the second way is to enter the change of direction of trade in the younger period.
Terms for trade: Does not use hedging, martingale, grid or o

Панель предназначена для быстрого визуального нахождения и отображения пин-баров по всем периодам и на любых выбранных валютных парах одновременно. Цвет сигнальных кнопок, указывает на направление пин-бара. По клику на сигнальную кнопку, осуществляется открытие графика с данным паттерном. Отключить не используемые периоды, можно кликом по его заголовку. Имеется поиск в истории (по предыдущим барам). Прокрутка (scrolling) панели, осуществляется клавишами "UP" "DOWN" на клавиатуре. Имеется Push-ув

This QuickClose help you to close all orders having profit immediately with only ONE CLICK, its work is very fast. You can choose which symbol you want or close all symbols so it will helpful for you in your trading to manage trading faster. This EA can quick close all Buy and Sell Orders by a selected symbol or total, And delete all pending orders. This SymbolButton is designed for closing orders. There is available Manual and Automatic closing functions. Automatic closing function will close t

Индикатор Trade in trend предназначен для торговли по тренду. Сила тренда определяется шириной линии. Узкая линия - начало или конец тренда. Широкая линия свидетельствует о высокой силе тренда. Резкая смена ширины линии свидетельствует, с большой вероятностью, об окончании тенденции. Сигналы индикатора Не против покупки: переход с красной линии в белую цена отразилась от белой линии индикатора цена находится выше белой линии индикатора Не против продажи: переход с белой линии в красную цена отр
FREE

Exit based Indicator - What is it? Exit your open positions based on up to 10 indicators. Even those you buy in Market !!! Use any indicator that provides buffer values (most of them output buffers). You can use any available buffers and even compare various indicator values. Selectors for exiting Buy Positions and Sell Positions are separate. The EA works in AND or OR mode. You can combine multiple instances to create elaborate rules. NO BROKER SIDE STOP LOSS IS USED.
Usage Ideas / Examples -

Удобный трендовый индикатор. Не меняет своих значений. Имеет огромные возможности для настройки. Не требователен к ресурсам компьютера. Создавался для работы в системе BearsHunter. Эксперт МТ5 с использованием данного индикатора: https://www.mql5.com/ru/market/product/30381 Эксперт МТ4 с использованием данного индикатора: https://www.mql5.com/ru/market/product/30383
Параметры:
m1_MA_Mode_1 - метод усреднения(0-9). m1_MA_Mode_2 - метод усреднения(0-9). m1_MA_Mode_3 - метод усреднения(0-9). m1
FREE
¿Sabe usted por qué MetaTrader Market es el mejor lugar para vender estrategias comerciales e indicadores técnicos? Con nosotros, el desarrollador no tiene que perder tiempo y fuerzas en publicidad, protección del programa y ajustes de cuentas con los compradores. Todo eso ya está hecho.
Está perdiendo oportunidades comerciales:
- Aplicaciones de trading gratuitas
- 8 000+ señales para copiar
- Noticias económicas para analizar los mercados financieros
Registro
Entrada
Si no tiene cuenta de usuario, regístrese
Para iniciar sesión y usar el sitio web MQL5.com es necesario permitir el uso de Сookies.
Por favor, active este ajuste en su navegador, de lo contrario, no podrá iniciar sesión.