Indicadores técnicos de pago para MetaTrader 5 - 16

The indicator calculates volume profiles dynamically and displays the result as VAL, VAH and POC curves.
Indicator features The indicator uses the historical data of the lower (relative to the current) timeframes for calculations: M1 - for timeframes up to H1, M5 - for timeframe H1, M15 - for timeframe H4, H1 - for timeframe D1, H4 - for timeframe W1, D1 - for timeframe MN. The color of the DPOC curve sections is determined by comparing the volume of the POC levels of all profiles that make u

El indicador calcula y traza automáticamente los niveles de soporte y resistencia de Fibonacci, una de las herramientas más efectivas para el análisis de mercado. El cálculo utiliza los datos de precios promediados para el período y el marco de tiempo seleccionados. El mínimo y el máximo para este período se toman como inicio y final del movimiento. Los niveles de Fibonacci le permiten ver puntos de referencia potenciales, alrededor de los cuales el movimiento del precio puede ralentizarse o rev

Alert Stochastic plus delay and level Filter
A stochastic oscillator is a momentum indicator comparing a particular closing price of a security to a range of its prices over a certain period of time. We added many types of alerts plus the Level Cross Filter to aid in your search for better opportunities in the market. Product Features Sound alert Push Notification (Alerts can be sent to your mobile phone) Signs on chart Alert box Level Filter Delay Level Filter
Indicator Parameters K
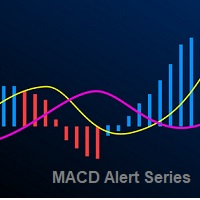
The Moving Average Convergence Divergence Indicator (MACD) is both a trend–seeking and momentum indicator which uses several exponential moving averages set to closing prices to generate trading signals. We added many types of alerts plus the Delay Cross Filter to aid in your search for better opportunities in the market.
Product Features Sound alert Push Notification (Alerts can be sent to your mobile phone) Signs on chart Alert box Alert on zero histogram cross or line sign cross. DelayCros

Description Very robust and powerful indicator, which allows through its 4 components, trade the market in trend or not trending conditions. it based on a very reliable trading strategy and gives you all you need to be succesful in trading. KEY LINKS: Indicator Manual – How to Install – Frequent Questions - All Products How is Clever Scalper Pro useful to you? A complete and reliable trading strategy. Easy to understand and trade Allow to identify trend, confirm it, look for retraceme
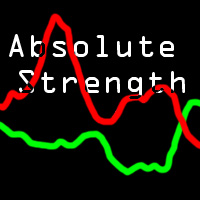
The Absolute Strength (AS) is intended to chart the current and historical gain or loss of an underlying based on the closing prices of a recent trading period. It is based on mathematical decorrelation. It shows absolute strength momentum.
This indicator is not measured on a scale like Relative Strength (RSI). Shorter or longer timeframes are used for alternately shorter or longer outlooks. Extreme high and low percentage values occur less frequently but indicate stronger momentum of the un

Este indicador es más informativo. Su trabajo se basa en la suposición de que el movimiento de los precios en el mercado puede representarse como el ruido de un color en particular, que depende de los parámetros de la distribución de los valores de los precios. Gracias a esto, es posible analizar el cambio de precio desde diferentes ángulos y, considerando el movimiento del precio como ruido de un color en particular, se puede obtener información sobre el estado actual de las cosas en el mercad

A pesar de algunos inconvenientes del indicador " AIS Color Noise Filter ", la idea de usarlo para suavizar las series de precios y los precios de previsión parece bastante atractiva. Esto se debe a varias razones: En primer lugar, tener en cuenta varios componentes de ruido permite elaborar un pronóstico sobre factores independientes entre sí, lo que puede mejorar la calidad del pronóstico; en segundo lugar, las características de ruido de las series de precios se comportan de manera bastante

Este es el famoso indicador de Bandas Bollinger de Gekko. Este indicador utiliza el ya conocido indicador de Bandas de Bollinger y agrega funcionalidades que permiten encontrar señales de entrada y de salida con la acción del precio sobre las bandas. Ejemplo: pullback, pullback contra la tendencia, cruce de precios con la banda del medio, etc. Entradas Number of Bars to Plot Indicator - el número de barras históricas que el indicador usará para producir señales; ProduceSignalOnlyWhenBarCloses

The Larry Wiliams' indicator named WillSpread considers the influence of the secondary Asset (Symbol) on the current Asset (trading). Indicator essence is to transform the correlation between assets in accumulated history data, providing an opportunity to detect various peculiarities and patterns in price dynamics which are invisible to the naked eye. Based on this information, traders can assume further price movement and adjust their strategy accordingly. As exposed on his Book, Larry says: "a
THRUST BAR ALERT!!!! THRUST BAR ALERT!!!
Now you dont have to worry about going through each currency pair, your favorite stocks watch list or crypto to find BIG CANDLES (also called THRUST BARS ). This indicator does everything for you.
This indicator has the capability to SCAN different CURRENCY PAIRS and TIMEFRAMES to give you BIG CANDLE (THRUST BAR) information through ALERT (MOBILE NOTIFICATION, EMAIL AND PUSH NOTIFICATION)
NOTE: If you are willing to scan more currency
Muy a menudo, en el estudio de series financieras se aplica su suavizado. Mediante el suavizado, puede eliminar componentes de alta frecuencia; se cree que están causados por factores aleatorios y, por lo tanto, no son significativos. El suavizado siempre incluye alguna forma de promediar los datos, en la que los cambios aleatorios en las series de tiempo se absorben mutuamente. Muy a menudo, para este propósito, se utilizan métodos de media móvil simple o ponderada, así como el suavizado exp

Para aislar componentes a largo plazo y no aleatorios, es necesario saber no solo cuánto ha cambiado el precio, sino también cómo se produjeron estos cambios. En otras palabras, estamos interesados no solo en los valores de los niveles de precios, sino también en el orden en que estos niveles se reemplazan entre sí. A través de este enfoque, se pueden encontrar factores a largo plazo y estables que influyen (o pueden influir) en el cambio de precio en un momento dado. Y el conocimiento de est

Automatic MIDAS positioning, the indicator allows the placement of two MIDAS, each one have 3 lines that can be calculated using Open/High/Low/Close/Median/Typical or Weighted prices, you can attach each MIDAS to the Open/High/Low or Close bars of any day, including the current day, once attached, if the price of this bar changes or you change the time frame, the indicator will do the repositioning and recalculation. You can also do a manual repositioning of the two MIDAS by moving its start lab

This indicator represent option and basis values as a tax, using this formula: Tax = ( ( strike / ( basis - option ) ) - 1 ) * 100 It's not time based (don't use time to expire information) You can set a fixed strike value, and a fixed basis symbol if needed. Some exchanges/brokers don't provide this information at marketdata and that's the only method to use this information when not provided.

PINBAR SCANNER PRO with TREND and RSI + CCI OSCILLATORS filter This indicator has been designed to automatically and constantly scan entire market to find high probability pinbar formations, so you can just wait for the perfect trading opportunity come to you automatically.
PINBAR is the strongest candle reversal pattern known in technical analysis. It shows excellent areas to determine potential entries and exits with opportunity to use excellent risk and reward ratios. It includes an RSI an
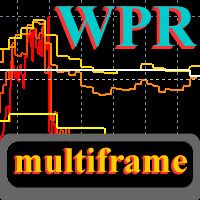
This is a multi-frame version of the standard indicator " Williams Percent Range ", that was previously available only for Mt4 . Now there is a version for Mt5 . Like the other indicators of the author, it allows you to see any set of timeframes at the same time, and all they will be presented on a scale of the current price chart. You can choose any set of timeframes of the indicator and freely switch to the price chart in both the highter and the lower direction. For each price period, indi

The Volume Average Indicator plots an adjustable average mathed by the ON-BALANCE-VOLUME. You can use to see the volume points where the market works in favor to your trades, based on volume/price. It works at all timeframes and instruments.
Product Features Volume Average ploted at the chart. Indicator Parameters VOL Ema - Set the EMA vol períod you want work with.

Uno de los poderosos métodos de análisis es el modelado de series financieras utilizando procesos de Levy. La principal ventaja de estos procesos es que pueden usarse para modelar una gran cantidad de fenómenos, desde los más simples hasta los más complejos. Basta con decir que la idea del movimiento de los precios fractales en el mercado es solo un caso especial de los procesos de Levy. Por otro lado, con la selección adecuada de los parámetros, cualquier proceso de Levy puede representarse co

Dear friends
This is an indicator brings two moving averages configurable and will emit sound and alert, depending on your choice, when they cross.
Very useful for those who used to operate multiple times or active at the same time.
With the indicator set it will warn you where the crossing occurred.
If you desire some personal indicator please fell free to get in touch.
Good Trades Jairo Elias

Description: The indicator of tick volumes Better Volume MT5 allows you to assess the general mood of the market and quite accurately catch the moments of the formation of large movements. The indicator is a color histogram in an additional window. In the calculation of Better Volume MT5 the Price Action combinations are taken into account, the values of the volumes with the height of columns and color marking are displayed. Input parameters: MAPeriod - period for calculating the moving average
PRICE BREAKOUT ALERT!!!! PRICE BREAKOUT ALERT!!!
Now you dont have to worry about going through each currency pair, your favorite stocks watch list or crypto to find breakouts. This indicator does everything for you.
This indicator has the capability to SCAN different CURRENCY PAIRS and TIMEFRAMES to give you breakout information through ALERT (MOBILE NOTIFICATION, EMAIL AND PUSH NOTIFICATION)
NOTE: If you are willing to scan more currency pairs along with many timeframes, you
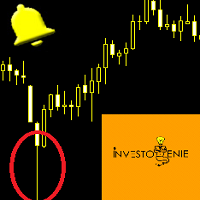
WICK BAR ALERT!!!! WICK BAR ALERT!!!
Now you dont have to worry about going through each currency pair, your favorite stocks watch list or crypto to find WICK BAR CANDLES (also called LONG TAIL BARS ). This indicator does everything for you.
This indicator has the capability to SCAN different CURRENCY PAIRS and TIMEFRAMES to give you LONG TAIL CANDLE (LONG WICK BAR) information through ALERT (MOBILE NOTIFICATION, EMAIL AND PUSH NOTIFICATION)
NOTE: If you are willing to

KEY LINKS: Indicator Manual – How to Install – Frequent Questions - All Products Description: Indicator which uses trend, breakout and reversal innovative indicators to show a complete visual trading strategy, with transparent metrics. It follows simple visual patterns, which will improve your trading significantly. Support: We create great tools for the entire trading community. Most of them are free. If you believe in what we do Support Us Here.
Outstanding Features Shows current
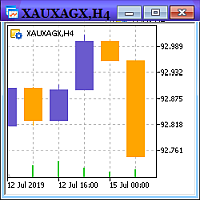
Индикатор CustomCrossIndexCreator позволяет создавать свой собственный пользовательский символ на основе истории двух любых финансовых инструментов как произведение этих двух индексов (кросс-индекс) и подкачивать его ценовую историю в виде минутных баров. Таким образом, в клиентском терминале Metatrader 5 появляется новый символ, с которым можно работать по аналогии с другими финансовыми инструментами, то есть открывать полноценные графики любого таймфрейма этого символа и проводить технически

Este es el famoso indicador de Canales de Gekko. Este indicador utiliza el ya conocido indicador de Canales y agrega funcionalidades que permiten encontrar señales de entrada y de salida con la acción del precio sobre las lineas. Ejemplo: pullback, pullback contra la tendencia, cruce de precios con la linea del medio, etc. Entradas Number of Bars to Plot Indicator - el número de barras históricas que el indicador usará para producir señales; ProduceSignalOnlyWhenBarCloses - produce señales de

The Hi Lo Breakout is taken from the concept of the ZZ Scalper EA which exploits the inevitable behaviour of price fluctuations and breakouts. The fact that because market prices will always fluctuate to higher highs before ebbing down to lower lows, breakouts will occur.
But here I've added a few more filters which I see work well also as an Indicator.
Range Analysis : When price is within a tight range this Indicator will be able to spot this and only then look for price breaks. Yo

Stochastic Reversal allows you to recognize reversals professionally. Stochastic Indicator: This technical indicator was developed by George Lane more than 50 years ago. The reason why this indicator survived for so many years is because it continues to show consistent signals even in these current times. The Stochastic indicator is a momentum indicator that shows you how strong or weak the current trend is. It helps you identify overbought and oversold market conditions within a trend. Rules
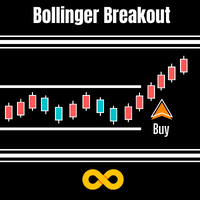
Bollinger Breakout Trader tells the trader when the market is about to breakout from a non-volatile period. Non volatility usually means its building up steam for more good moves in future. A signal is formed when this switch from non-volatile to volatile occurs. These periods are measured by both Bollinger Bands and Keltner Channels. Bollinger Bands measure the standard deviation of price from the Moving Average which results in an expanding and contracting channel. Keltner Channels are based

Muy a menudo, el comerciante se enfrenta a la tarea de determinar en qué medida el precio puede cambiar en un futuro próximo. Para este propósito, puede usar el tipo de distribución Johnson SB. La principal ventaja de esta distribución es que puede usarse incluso con una pequeña cantidad de datos acumulados. El enfoque empírico utilizado para determinar los parámetros de esta distribución le permite determinar con precisión los niveles máximos y mínimos del canal de precios. Estos valores se pu
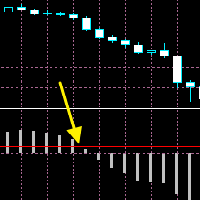
The moment when the MACD line crosses the signal line often leads to a significant price movement and trend changes. MACD Cross Prediction is an indicator that uses OSMA(MACD oscillator) and a red line. You can change the level of the red line on the indicator setting popup(and the red line moves up and down). The alerts(email, mobile push, sound, MT5 alert) will be sent when the MACD histogram touches the red line, which means the alerts can be sent just before/around the time when the MACD

Este es un indicador muy simple pero efectivo para intercambiar rupturas de períodos fractales variables. Un fractal es una formación de precios de un número impar de barras, siendo la barra central el punto de precio más alto o más bajo de la formación. Estos precios actúan como niveles de soporte y resistencia a corto plazo, que este indicador utiliza para dibujar un canal de precios y mostrar desgloses. [ Guía de instalación | Guía de actualización | Solución de problemas | FAQ | Todos los p
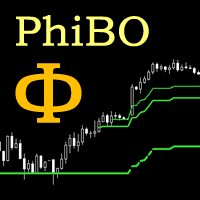
Indicador PHIBO da metodologia PhiCube. Se comporta exatamente como o utilizado pelo Bo Williams em seus videos e estratégias. Quando o preço está sobre, ou abaixo, das três linhas, isso indica que há uma forte tendência. Quando não estão alinhadas, podem indicar suportes, resistências e alvos. Se aparecerem após um longo movimento já esticado, podem indicar que o movimento está terminando.

Oscilador bem próximo que o indicador SANTO mostrado pelo Bo Williams em sua metodologia PhiCube, para mim este indicador ainda é melhor que o próprio SANTO original. Ótimo para entender a força e tendência de movimentos e possíveis divergências. Preço fazendo topo e o SANTO não renovando máxima, tudo indica que teremos uma reversão ou no mínimo um drawback.
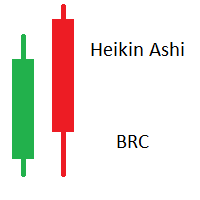
Heikin Ashi (HA) is a type of candlestick chart originated in Japan. The difference from traditional candlesticks is that HA bars are averaged, creating a smoother appearence. HA doesn't show the exact open and close price, they should be used as Technical Indicator and not as exact market prices. Calculation: HA Open = (Open of previous bar + Close of previous bar) / 2 HA Close = (Open + High + Low + Close) / 4 HA High = Highest of High, HA Open, or HA Close HA Low = Lowest of Low, HA Open, or

Индикатор Magneto Weekly Pro отображает: Недельные важные линии поддержки и сопротивления (выделены желтым, красным и синим цветами). Основные недельные цели (выделены белым цветом). Недельные паттерны возврата цены (обозначаются красными флажками). Применение индикатора Magneto Pro можно использовать и как дополнение к существующей стратегии, и как самодостаточную торговую стратегию. Данный продукт состоит из двух индикаторов, работающих на разных временных промежутках, и предназначен для скал

Moon 1 is a Box Break is a powerful indicator of Break Zone for any par and any timeframe. It doesn't requires any additional indicators for the trading setup.The indicator gives clear signals about opening and closing trades.This Indicator is a unique, high quality and affordable trading tool.
Perfect For New Traders And Expert Traders Low risk entries. Never repaints signal. Never backpaints signal. Never recalculates signal. For MT5 Only Great For Scalping Great For Swing Trading Arr
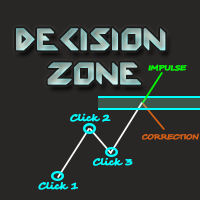
Decision Zone is an indicator that defines decision zones for previously selected pivots. In decision zones the user can more safely decide whether the wave that has reached this zone is correction or impulse.
Zone levels were based on Fibonacci expansion along Elliot waves and case analysis.
Trading Strategy:
Basically, when the market wave reaches the decision zone at * Level 1.0 *, there is great potential for this wave to be an impulse or correction wave. If it is impulse, the wave wi

FZR indicator determines fractal zigzag reversal pattern of all the time frames of the chosen symbol and shows the information in the Info label. Indicator draws the detected pattern in the chosen time frame and also you can select in the menu to draw the trend line according to FZR peaks. What it is FZR? See the first picture in the screenshots. As you can see for every peak of FZR the AO indicator must cross zero line. FZR indicator determines the trend direction.
How to use FZR for trading?

The current Rise and Fall is judged from the Commodity Channel Index (CCI) of the three cycles and displayed in a panel by color coding.
The second and third of the three cycles are changed according to the correction factor multiplied by the first cycle (minimum cycle).
In addition, each CCI is displayed with ATR (Average True Range) corrected for variation.
When two of the three CCI are complete, Trend_1 is displayed.
When all three are complete, Trend_2 is displayed.
// ---

MOON 2 THE WALL is a Oscilator indicator. I s a powerful indicator of TREND for any par and any timeframe. It doesn't requires any additional indicators for the trading setup.The indicator gives clear signals about opening and closing trades.This Indicator is a unique, high quality and affordable trading tool.
Perfect For New Traders And Expert Traders Low risk entries. Never repaints signal. Never backpaints signal. Never recalculates signal. For MT5 Only Great For Scalping Great For Swi

Описание Данный индикатор строит (альтернативные, математически рассчитанные) уровни поддержки и сопротивления, а так же уровни, к которым с большой вероятностью придет цена в ближайшее время. Следует обратить внимание на то, что расчет уровней производится на исторических данных, и качество котировок играет важную роль при построении индикатором линий. Замечу, что отрисованные Magneto и Magneto Weekly линии не изменяют свои значения на всем расчетном периоде. Важное изменение! Добавлена функция

Pivot levels indicator shows 7(9 for Camarilla) pivot levels. It is adjusted for major use, including: all standard time frames
choice of periods to show four popular calculation formulas (typical, median, weighted and Camarilla)
pivot day shift choice of properties for lines and labels choice of showing alerts when crossing pivot lines Parameters: ----------Main parameters----------- Timeframe - time frame for pivot levels
Number of periods to show - displays pivot levels for number of perio

KT MACD Divergence shows the regular and hidden divergences build between the price and oscillator. If your trading strategy anticipates the trend reversal, you can include the MACD regular divergence to speculate the potential turning points. And if your trading strategy based on the trend continuation, MACD hidden divergence would be a good fit.
Limitations of KT MACD Divergence
Using the macd divergence as a standalone entry signal can be a risky affair. Every divergence can't be interpr

The 3 Automatic Vwap (Midas) Indicator can be used for Price and Volume studyers to map the movement of market drivers. It automatically plots 3 Vwaps, two of which are dynamic and will be updated throughout the day if new highs or new lows emerge. The third Vwap is daily and can help if the trend is up or down. Also, an auxiliary indicator that plots (also dynamic) points of interest with OHLC prices (Open, High and Low of the current day and Close of the previous day) was inserted. Success and

Este indicador le permite determinar la probabilidad de que el precio alcance uno u otro nivel. Su algoritmo es bastante simple y se basa en el uso de datos estadísticos sobre los niveles de precios de un par de divisas en particular. Gracias a los datos históricos recopilados, es posible determinar en qué medida cambiará el precio durante la barra actual. A pesar de su simplicidad, este indicador puede proporcionar asistencia invaluable en el comercio. Entonces, con su ayuda, es posible determ
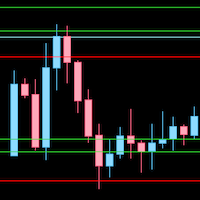
Draw levels of support and resistance based on highs/lows or closes from daily, weekly or monthly. This indicator uses the highs, lows or closes to draw horizontal lines on the graph. By observing those lines you can identify trend (gaining or losing levels of resistence/support) and find good levels where price can bounce. For those who trade price action, this is a very useful indicator.

Moon 3 is a Trend indicator. I s a powerful indicator of TREND for any par and any timeframe. It doesn't requires any additional indicators for the trading setup.The indicator gives clear signals about opening and closing trades.This Indicator is a unique, high quality and affordable trading tool.
Perfect For New Traders And Expert Traders Low risk entries. Never repaints signal. Never backpaints signal. Never recalculates signal. For MT5 Only Great For Scalping Great For Swing Trading Arro
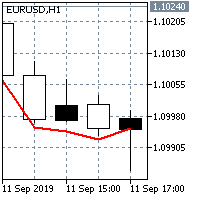
SEMA is the Sextuple Exponential Moving Average:
SEMA = PEMA + QEMA(y - PEMA)
The principle of its calculation is similar to Double Exponential Moving Average (DEMA). The name "Sextuple Exponential Moving Average" does not very correctly reflect its algorithm. This is a unique blend of the single, double, triple, quadruple and pentuple exponential smoothing average providing the smaller lag than each of them separately. SEMA can be used instead of traditional moving averages. It can be use

Easily get all relevant economic events of the current day right into your chart, as markers. Filter what kind of markers do you want: by country (selected individually) and by Importance (High relevance, Medium, Low or any combination of these). Configure the visual cues to your liking. Additionaly you have the ability to add up to 5 personal markers of your own agenda. With Alerts and/or with blackout periods, if you are using it within an Expert Advisor! All in one Economic Calendar indicator

Indicator SR levels true in small time frames is very useful for scalping while in bigger ones it is good for day or position trading.
SR levels true can draw 4 support/resistance levels based on defined maximum rebouds from price level. Indicator scans defined number of bars in time axis and defined number of pips in price axis (both sides - up and down) and calculates how much times price was rejected from scanned price levels. At the price levels where maximum rebounds are counted, support

Se pueden utilizar distribuciones sostenibles para suavizar las series financieras. Dado que se puede usar un historial bastante profundo para calcular los parámetros de distribución, tal suavizado, en algunos casos, puede ser aún más efectivo en comparación con otros métodos.
La figura muestra un ejemplo de la distribución de los precios de apertura del par de divisas EUR-USD en el marco temporal H1 durante diez años (Figura 1). Se ve fascinante, ¿no?
La idea principal que subyace
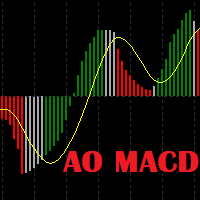
Awesome Oscillator Moving Average Convergence/Divergence Indicator. Not late as AO and not noisy as MACD. The basic version of the indicator is presented. The "PRO" version is under development with such features as sending signals to e-mail and plotting divergence and convergence lines on the chart.
Input parameters: Fast: short EMA Slow: long EMA Signal: signal line Colors: Red: MACD < Signal Green: MACD > Signal Gray: MACD above Signal, but lower than the previous MACD MACD below Signal, bu

Al tomar decisiones comerciales, es útil confiar no solo en datos históricos, sino también en la situación actual del mercado. Para que sea más conveniente monitorear las tendencias actuales en el movimiento del mercado, puede usar el indicador AIS Current Price Filter . Este indicador solo tiene en cuenta los cambios de precios más significativos en una dirección u otra. Gracias a esto, es posible predecir tendencias a corto plazo en el futuro cercano; no importa cómo se desarrolle la situac

The Relative Strength Index (RSI), developed by J. Welles Wilder, is a momentum oscillator that measures the speed and change of price movements. The RSI oscillates between zero and 100. We have added to the reputable RSI indicator several types of alerts and a signal interval filter to be incorporated in your Expert Advisors. It works in ALL Timeframes ans instruments.
Product Features Email Alert Sound alert Push Notification (Alerts can be sent to your mobile phone) Signs on chart Aler

El indicador MTF Qristalium Arrows es un sistema de comercio semiautomático terminado. Funciona en todos los pares de divisas.
En el indicador están involucrados tres reglas: 1) operar sólo por la tendencia, 2) "comprar, cuando todo el mundo vende y vender, cuando todo el mundo compra", 3) el Precio siempre va en contra de la multitud.
El indicador MTF Qristalium Arrows filtra los datos de la regla en varios Marcos de tiempo con indicadores integrados. Si coincide con la tendencia en la

This is a multicurrency and multitimeframe indicator that calculates the angle between two points. Points for measuring the angle can be taken from the ZigZag (the last two points), or from the Moving Average (between two given bars), or it can be the closing prices of bars.
Angle measurement is possible in degrees or in radians. You can select the scale for the calculation. For a better understanding of the indicator, you can study the free Angle High Low indicator. In the parameters you can

Trailing Uses Standard Deviation.
A daptive_Trailing_uses_StdDev_Indicator is an indicator of directional movement that allows you to identify a trend at the time of its inception and set the levels of a protective stop.
Unlike trailing with a constant distance, the indicator uses the distance to the price proportional to the current standard deviation of StdDev. The distance is equal to the product of the standard deviation and the constant coefficient set by the user.
Thus, the traili

KT CCI Divergence shows the regular and hidden divergence created between the price and CCI oscillator. Divergence is one of the vital signals that depicts the upcoming price reversal in the market. Manually spotting the divergence between price and CCI can be a hectic and ambiguous task.
Limitations of KT CCI Divergence
Using the CCI divergence as a standalone entry signal can be risky. Every divergence can't be interpreted as a strong reversal signal. For better results, try to combine it

Navigators is a great tool for detecting peaks and valleys on a chart. This indicator uses a modified peak and trough detection algorithm. This algorithm includes the Fractals indicator and the ZigZag indicator.
This tool should be used to analyze peaks and valleys, as well as to detect patterns, or for other purposes. You can use this powerful tool for your own purposes at your own risk.
Using this indicator, you can anticipate the future price behavior of a certain number of bars. The indicator draws a line showing simulated future price values. You can use this information both for entering / exiting the market. So for the installation / correction of stops accompanying the position.
The indicator has several parameters. HistoricBars - The number of historical bars to analyze. FutureBars - The number of bars to predict the price. Prediction - prediction depth coefficient.
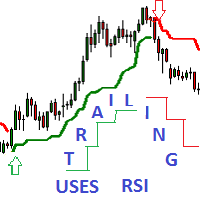
Adaptive Trailing uses RSI Indicator - an indicator of directional movement that allows you to determine the trend at the time of its inception and set the levels of a protective stop.
Trailing can be carried out both from below, when the stop level is below the current price and is pulled up behind the price if it increases, and above, when stop levels are above the current price.
There are two modes for calculating the stop level. Simple trailing is done with a constant distance of Npoint

KT Heiken Ashi Smoothed is a smoothed version of the standard Heiken Ashi. Moreover, it also plots buy/sell arrows on a trend change. A buy arrow is plotted when it change to a bullish state from bearish state. A sell arrow is plotted when it change to a bearish state from bullish state. Mobile notifications, Email, Sound and Pop-up alerts included.
What exactly is Heiken Ashi Smoothed? It filters out the false signals and noise in the standard Heiken Ashi. It applies the set of two moving a

KT MA Crossover draws the buy and sell arrows based on the crossover of chosen moving averages. Moreover, it also generates the appropriate alerts and displays the MFE (Most Favorable Excursion) for each successive signal. The moving average crossover is one of the primary strategies followed by traders around the world. Usually, it consists of a fast and slow moving average to find a buy and sell entry signal according to the crossover direction. Buy signal - when fast MA crosses above the slo

Hurst Fractal Index Фрактальный Индекс Херста - показатель персистентности временного ряда При значении индикатора >0.5 временной ряд считается персистентным (тенденция сохраняется) При значениях индикатора явно < 0.5 временной ряд считается антиперсистентным (возможна смена направления движения) Для наглядности значения индекса усредняются периодом 2-3. Настройки индикатора: Max Bars - глубина истории расчета (кол-во баров на графике для которых произведён расчет) Data from Timeframe - исполь
KT Round Numbers plots the round number levels which are also commonly known as psychological levels in the Forex world. In the context of Forex trading, round number levels are those levels in which there are two or more zeroes at the end. They are named as 00 levels on the chart.
Some traders also consider the halfway points as a valid round number level. They are named as 50 levels on the chart.
Use of round number levels in trading Round number levels work as strong support and resistan
Candle Pattern Alert indicator alerts when the last price closed candle matches the set input parameters. You can choose to scan through all the symbols in Market Watch or enter your favorite symbols and also you can enter time frames you need to scan. ---------Main settings-------- Select all symbols from Market Watch? - if Yes the program scans through all the symbols displayed in Market Watch, if No - only selected in next input symbols are scanned
Enter symbols separated by commas - enter s
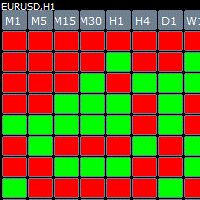
Cube indicator represents the original candle stick chart but in a top down cube form in order to see previous patterns in the markets more easy. The indicator has build in alert once there is a consecutive 3,4,5 bars in a row you get an message.
Parameters Bars_Limit = total visible cubes
TF_M1 = true; TF_M2 = false; TF_M3 = false; TF_M4 = false; TF_M5 = true; TF_M6 = false; TF_M10 = false; TF_M12 = false; TF_M15 = true; TF_M20 = false; TF_M30 = true; TF_H1 = true; TF_H2 = false; TF_H

Hablando del indicador Zen MACD
MACD de cuatro colores y dos hilos
Muestra la suma del área de la columna.
InpFastMA = 12; // período de EMA rápido
InpSlowMA = 26; // Periodo de EMA lento
InpSignalMA = 9; // Período de señal SMA
InpAppliedPrice = PRICE_CLOSE; // Precio aplicado
InpMaMethod = MODE_EMA; // Ma_Method
input bool ChArea = false; // área chzhshch
Parámetros de línea rápida del período EMA rápido
Parámetros de línea lenta del período EMA lento
Parámetros de línea
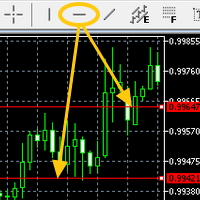
Attach the indicator on the chart and draw the red line from the button on MT5's built-in menu bar then the alert will be sent to you(push,email,popup and sound)
Hi You all know the red line (the MT5 built-in red line) drawn from the menu bar on MT5. It is often used to check the resistance etc.....It is very useful but it is little troublesome to get an alert(sound, push, email and popup) when the red line is touched by the price. Here is Price Touch Alert indication, just use the button t
MetaTrader Market ofrece a todos los desarrollador de programas de trading una sencilla y cómoda plataforma para ponerlos a la venta.
Le ayudaremos con la presentación y explicaremos cómo preparar la descripción de su producto para el Market. Todos los programas que se venden a través del Market están protegidos por una codificación adicional y pueden ser iniciados sólo en el ordenador del comprador. La copia ilegal es imposible.
Está perdiendo oportunidades comerciales:
- Aplicaciones de trading gratuitas
- 8 000+ señales para copiar
- Noticias económicas para analizar los mercados financieros
Registro
Entrada
Si no tiene cuenta de usuario, regístrese
Para iniciar sesión y usar el sitio web MQL5.com es necesario permitir el uso de Сookies.
Por favor, active este ajuste en su navegador, de lo contrario, no podrá iniciar sesión.