Indicadores técnicos para MetaTrader 5 - 51

Trend Ruby , indicador 3 del pack ruby . trend ruby cuenta con la estrategia de roptura de estructura o linea de tendencia como bien marcan las lineas ay te da la señal de roptura o seguimiento de tendencia y rebote ! funciona para cualquier temporalidad , sirve para hacer scalping y tambien intradiario sirve para los mercados de forex todo los pares , tambien para indices sinteticos todo los pares ideal para los volatilitys y jumps ! tambien crash y boom !

Channel Zone indicador 4 del pack ruby channel zone cuenta con la estrategia en donde el canal channel rompe para el color verde da señal de short donde rompe para el canal rojo da señal de long , es muy simple y facil de usar , ideal para agarrar largas tendencias como se ve en la foto ideal para hacer intradiario sirve para los mercados de forex todo los pares para los mercados de indices sinteticos todo los pares ! y para todas las temporalidades.

Fibo Ruby indicador 5/5 pack ruby fibo ruby cuenta con la estrategia de un fibonacci programado a captar la tendencia alcista como bajista ideal para agarrar rebotes en los puntos de 23.6 , 38.2 , 50.0 y 61.8 se adapta a cualqier temporalidad sea para hacer scalping o intradiario . sirve para los mercados de forex, todo los pares sirve para los mercados indices sinteticos , todo los pares ideal para boom y crash !
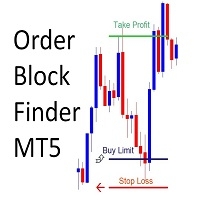
!! FLASH SALE !! Over 80% off !! For ONE week only. Now only $47 - normally $297! >>> Ends on 30 June 2023 - Don't miss it!
Sends Alerts – On MT5 To Your Phone To Your Email
Does not repaint .
Works on any Forex pair, any timeframe.
10 Activations allowed so you are free from limitations >> MT4 Version Here Spreads from 0.1pip RAW/ECN Accounts, click here . Check out my Waka Esque EA signal here: >> High Risk Settings or Medium Risk Settings .
What Is An Order Bl

Black Card Pack indicators . Bars Black indicador 5/5 del pack cuenta con una estrategia de roptura de bars como se llama el indicador , es muy facil de usar, si bien se ve en la foto cuando rompe la ema bars para abajo entrar en posicion para arriba es lo mismo ! funciona para todas las temporalidades , sirve para cazar grandes tendencias y hacer scalping apto para forex y indices sinteticos funciona en todo los pares de ambos !
Pack Black Card, Indicador 5/4 Channel black , es un indicador que cuenta con la estrategia de agarrar pivots sobre un canal ya programado como se ve en la foto es perfecto para hacer scalping tomandolo en temporalidades de m30 , m15 , m5 y m1 para agarrar rebotes de profit . aunqe funciona para todas las temporalidades esta diseñado para hacer cortos , sirve para los mercados de forex y indices sinteticos todo los pares estan aptos para operar !

Pack Black Card indicador 5/3 Green power cuenta con la estrategia de ropturas high y low dando la señal con el punto rojo o verde el punto rojo para short y el punto verde para long , perfecto para los mercados de forex y los mercados de indices sinteticos , funciona para todas las temporalidades sirve para hacer scalping y intradiario ! Ideal para los mercados Crash y boom !!

Pack Black Card Indicador 5/2 Macd Divergence Black cuenta con la estrategia del cruze de emas y las lineas diversgntes como bien se ve en la foto ! sirve para todas las temporalidades sirve para los mercados de forex y los mercados de indices sinteticos ideal para los pares volatility 75, volatility 100, volatility 25 y volatility 50 para todos los jumps ! para forex funciona en todo los pares !

Pack Black Card indicador 5/1 Point black cuenta con la estrategia de bollingers profesionales donde cada flecha te da una señal distinta de entrada . sirve asta para operar en m1 y en d1 sirve para hacer scalping y intraday , modificado para los mercados de forex ! apto para todo los pares modificado para los mercados de indices sinteticos apto para todo los pares ! Ideal para los volatilitys y jumps !

I developed this vwap with more settings in order to be customized as much as possible. VWAP is a really strong indicator for your trading. It can be used to check if the market is in balance or ranged, and also you can use the levels as support/resistence/target. In the pictures you can see the main settings, and you can select the use of real volume from the broker.
Hope you will find it useful. Many thanks in advance.
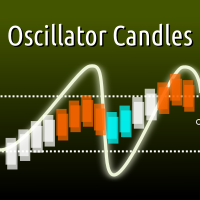
With this indicator you can colorize the candles on your chart based on the output of any oscillator indicator. Supporting both built-in and custom indicators, with the ability to set up to 5 custom parameters, custom color scheme, and upper/lower threshold values. Most built-in indicators in MT5 will be found under "Examples\\" path. For example, to use default RSI indicator, set your indicator path to "Examples\\RSI" in the inputs dialog. Input01-05 sets the custom parameters of your indicator

Fibonacci retracement levels—stemming from the Fibonacci sequence—are horizontal lines that indicate where support and resistance are likely to occur. Each level is associated with a percentage. The percentage is how much of a prior move the price has retraced. The Fibonacci retracement levels are 23.6%, 38.2%, 61.8%, and 78.6%. While not officially a Fibonacci ratio, 50% is also used. The indicator is useful because it can be drawn between any two significant price points, such as
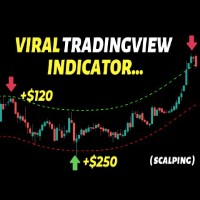
This indicator builds upon the previously posted Nadaraya-Watson Estimator. Here we have created an envelope indicator based on kernel smoothing with integrated alerts from crosses between the price and envelope extremities. Unlike the Nadaraya-Watson Estimator, this indicator follows a contrarian methodology. Settings
Window Size: Determines the number of recent price observations to be used to fit the Nadaraya-Watson Estimator.
Bandwidth: Controls the degree of smoothness of the envelop
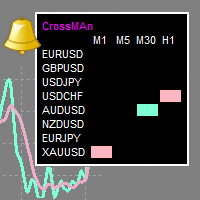
"CrossMAn" is a table indicator that gives signals about the intersection of two moving averages, on selected instruments and time periods.
The intersection of moving averages is one of the most popular signals on the stock exchange.
The signal is displayed as colored rectangles in the table. Thus, you can assess at a glance which tool should be paid attention to.
(Crossman does not add moving averages to the chart.)
The indicator table can be dragged with the mouse.
The size of the table

Build your own model to predict averages of turning points of the Triple Moving Average Oscillator. It is simple. Rate me with stars. Just load the indicator Triple Moving Average Oscillator in you platform and choose the period. Scroll through to observe the averages of the highs and lows over a period of time. Add the levels for a buy and a sell on the Triple Machine and this will show the average of highs and lows to look for buys and sell. You can load multiple copies with multiple levels.

The Trend Snatcher is a multi-timeframe indicator that detects swings on the price market chart. Important levels, such as Supply and Demand levels, Trendline touches, reversal patterns, and others, can also be added as confluence when making trading decisions.
The indicator employs two lines that aim for the highest selling and lowest buying levels. When the two lines cross, a signal is generated.
All trading instruments are compatible, including currency pairs, synthetic indices, metals

The diamond top and bottom are reversal patterns. It represents a rally to a new high with a drop to a support level followed by a rally to make a new high and a quick decline, breaking the support level to make a higher low. The bounce from the higher low is then followed by a rally, but making a lower high instead. Once this behavior is identified, prices then break the trend line connecting the first and second lows and start to decline further. You can find MT4 version hier
Indicator show
¿Qué es la doble parte superior e inferior?
Los patrones de doble techo y suelo son patrones gráficos que ocurren cuando la inversión subyacente se mueve en un patrón similar a la letra "W" (doble fondo) o "M" (doble techo). El análisis doble superior e inferior se utiliza en el análisis técnico para explicar los movimientos en un valor u otra inversión, y se puede utilizar como parte de una estrategia comercial para explotar patrones recurrentes.
Puedes encontrar la versión MT4 aquí.
E
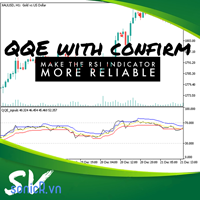
New QQE with confirm The relative strength index (RSI) is a technical indicator of momentum that measures the speed and change of price on a scale of 0 to 100, typically over the past 14 periods. Cause RSI measures the speed and change of price, trader normally use this indicator in two way: + Buy when oversold, sell when overbougth. + buy or sell when identifying divergence from rsi with price. In two way, it wrong when rsi in overbouth (for example) for long time or divergence. Even price ju

Sniper2 , Cuenta con puntos de lineas , con colores que te estan mostrando una entrada , que funcionan como soporte y resistencia ! las lineas de puntos verdes verde muestra entrada en venta , las lineas de puntos rojos muestra entrada en compra , fijarse en los soportes que funcionan como roptura para agarrar velas largas en mayor temporalidad . funciona para forex todo los pares funciona para indices sinteticos todo los pares ! indicador en oferta !
El indicador se utiliza para el auge comercial y Crash, es un superdetective de tendencias. Cuando el mercado tenga una tendencia alcista, utilice la señal fuerte para capturar el pico, cuando esté en una tendencia bajista, use la señal normal para capturar más picos.
El indicador es una base de acción del precio por naturaleza con algunas lógicas matemáticas. Se usa solo para atrapar picos.
El indicador posee la siguiente salida
1. Señal fuerte
2. Señal regular
3. Alerta por correo e

The problem with trading candlestick patterns becomes obvious, after some experience in live markets. Hypothetical branching of candlestick patterns, are not necessary for successful trading. As a Price action trader, my principle is to keep things simple and consistent. My focus is on buying and selling pressure, which is visible in market structure. Trade Management and discipline are my secondary core elements. This indicator detect 4 Simple but Effective Price action Patterns! Yellow = Insi
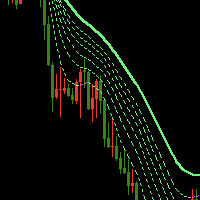
The Waterfall Trend Indicator MT5 uses line regression algorithm, using "Waterfall" in its name is in that it like waterfall when there is a strong down market trend. The indicator draws seven lines, one of which is sold line, others are dash line, the sold line is more stable. Indicator introduction The indicator can effectively filter price noise since it is calculated with line regression. It can be used to analyze market trend and design new expert that is based on trend. When the trend lin
An Ultimate Tool for quick and efficient market analysis. Unique combination of solid indicators defining market direction for trend tracking and filtration designed for you to stay on the right side of the market.
Market Rider Tools gives you access to one of the most used from professional trades indicators on worldwide, which were not build in for MT4 and MT5 terminals . These are unique non-repainting indicators designed to be used on all time frames for all instruments classes: Fo

An Ultimate Tool for quick and efficient market analysis. Unique combination of solid indicators defining market direction for trend tracking and filtration designed for you to stay on the right side of the market.
Market Rider Oscillators gives you access to one of the most used from professional trades indicators on worldwide, which were not build in for MT4 and MT5 terminals . These are unique non-repainting oscillators designed to be used on all time frames for all instruments class

Moving Level , Indicador especial para cazar tendencias y hacer scalping ! programado para usarlo en cualquier temporaliadad, cuenta con la extrategia del volumen de tendencia marcando una flecha si es long o short acompañado por los colores azul yellow y rojo cuando marca la linea yellow con la flecha hacia arriba y va acompañado por lineas azules es tendencia alcista Cuando marca la flecha hacia abajo con la linea yellow y va acompañado de lineas rojas es tendencia bajista , Se usa en
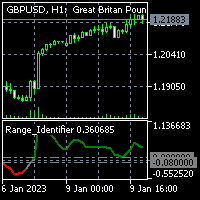
To get access to MT4 version please click here . - This is the exact conversion from TradingView: "Range Identifier" By "Mango2Juice". - All twelve averaging options are available: EMA, DEMA, TEMA, WMA, VWMA, SMA, SMMA, RMA, HMA, LSMA, Kijun, McGinley - This is a light-load processing and non-repaint indicator. - Buffer is available for the main line on chart and not for thresholds. - You can message in private chat for further changes you need.
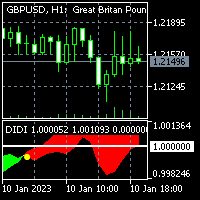
To get access to MT4 version please click here . - This is the exact conversion from TradingView: "Didi Index" by " everget ". - This is a popular version of DIDI index on tradingview. - This is a light-load processing and non-repaint indicator. - Buffer is available for the lines on chart and arrows on chart. - You can message in private chat for further changes you need. Thanks for downloading

The Accumulation / Distribution is an indicator which was essentially designed to measure underlying supply and demand. It accomplishes this by trying to determine whether traders are actually accumulating (buying) or distributing (selling). This indicator should be more accurate than other default MT5 AD indicator for measuring buy/sell pressure by volume, identifying trend change through divergence and calculating Accumulation/Distribution (A/D) level. Application: - Buy/sell pressure: above

Equal Highs and Lows Indicator
Find and Mark Equal Highs and Lows on chart of Selected Multi Time frames. Options:
set min and max bars between Equal High's / Low's bars set max points difference between High's / Low's ( Sensitivity )
Select time frames by buttons on chart Select / Filter only High's or Low's by a button Extend Equal High's / Low's line forward for chart reference
Manual
MT4 version
MT5 version
Other Indicators

Identify Engulfing candle pattern with Arrows & Alert ( built-in RSI filter). This indicator helps you to identify Engulfing candle pattern or Outside bar (OB) on the chart with arrows, along with an alert when a new Engulfing candle appears. Engulfing candle pattern is one of the most important reversal Price Action signals. You can choose between standard Engulfing (Engulfing based on candle body) or non standard Engulfing (Engulfing based on candle high - low )
Alerts can be turned on
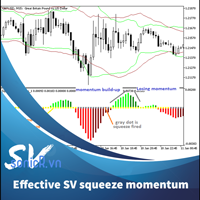
Introduced by “John Carter”, the squeeze indicator for MT5 represents a volatility-based tool. Regardless, we can also consider the squeeze indicator as a momentum indicator, as many traders use it to identify the direction and strength of price moves. In fact, this squeeze indicator shows when a financial instrument is willing to change from a trending market to another that trades in a considerably tight range, and vice versa. Moreover, it indicates promising entries as well as exit points For

This is a derivative of John Carter's "TTM Squeeze" volatility indicator, as discussed in his book "Mastering the Trade" (chapter 11).
Black crosses on the midline show that the market just entered a squeeze ( Bollinger Bands are with in Keltner Channel). This signifies low volatility , market preparing itself for an explosive move (up or down). Gray crosses signify "Squeeze release".
Mr.Carter suggests waiting till the first gray after a black cross, and taking a position in

Identify Pinbar Candle Pattern with Arrows & Alert (built-in RSI filter).
This indicator helps you to identify Pin bar Candlestick Pattern (or shooting star & hammer pattern) on the chart with arrows, along with an alert when a new Pin bar appears. Pin bar pattern is one of the most important reversal Price Action signals.
You can set Minimum Percent of Wick (or Tail) Length over full bar length (Recommended: 60%, 70%, 75%).
Alerts can be turned on and off: Popup Email Push Notification S

Profit Aqua , es un indicador que pertenece al proyecto selva que cuenta con 3 indicadores en esta ocacion toca con el indicador profit aqua , que cuenta con la estrategia de una media movil programada profesional mente para facilitarte todo tipo de entrada cuenta con la estrategia de cambio de color , como se ve en la foto cuando cambia de color rojo te esta marcando clara mente una entrada en short cuando te marca el color verde clara mente en long , se puede hacer scalping y a largas temp

Stochastic Selva . cuenta con un nuevo pack que se llama selva en esta ocacion traigo el indicador , stochastic selva que cuenta con la estrategia de rangos altos y rangos bajos para cazar mejor las tendencias y las entradas segun su temporalidad esta programado profesional mente para hacer entradas con altos porcentajes de efectividad , donde toca el techo verde y va cambiando de color a naranja marca entrada en baja donde es alreves y toca el piso con el color naranja a cambiando a verde e

This is the MT5 version of the absolute OCD tool that delivers Position Size Calculator and many more other options of the matured PSI Position Smart Indicator NEW check the FULL Version Including the private ICT tools limited so far until the release of the full 2016 Mentorship Core Content to the public. Indicator type: Money Management Calculator; Forex Position Size Calculator; Fixed or ATR value for Stop Loss and Take Profit levels; Average Position Size Indicator (True Average Price); Acc

Dmi Selva es el ultimo indicador del pack selva en esta ocacion cuenta con el indicador DMI selva , que va de la estrategia del oscillador con el cruze de linea , y los cambios de colores , cuando da un cruze de linea y un cambio de color de gold a lightgreen es un cambio de tendencia viceversa es lo mismo siempre con el cruce de la linea ! sirve para los mercados Forex y indices sinteticos ! Apto para todas las temporalidades ! Buen Profit !

Strength Safari , Primer indicador del pack safari en esta ocacion contamos con un oscilador que da cruces perfectos indicando donde esta la entrada clara en dos puntos esta la linea green y la linea gold donde la entrada te marca donde toca piso o techo en el cruce de lineas la verde encima de la gold marca zona de subida , la gold cruzando la verda marca zona de bajada , ideal para agarrar tendencias largas ! se usa en cualquier temporalidad en los mercados de Forex y Indices Sinteticos

Renko Profesional , Indicador 2 del pack Safari . En esta ocacion cuenta con el indicador renko profesional , que cuenta con la estrategia de soporte , resistencia , linea verde alcista y linea roja bajista . marca muy bien los puntos de entrada y puntos de acumulacion ! Sirve para todas las temporalidades ! Para los mercados de forex y indices sinteticos ! Sirve para todos los pares ! Buen Profit !

Filter Profesional , Indicador 3 del pack Safari , Cuenta con un indicador que es un tipo de media movil con color que te va marcando la entrada perfecta a distintas temporalidades , cuando marca la linea verde se viene tendencia alcista y es entrada en compra , cuando marca la linea gold es tendencia bajista da zona de entrada bajista . Sirve para los mercados de Forex y Indices sinteticos todo los pares ! Todas las temporalidades ! Buen Profit !

Candles Profesional Es el indicador 4 Del pack Safari Cuenta con un oscilador que marca cada punto de las fuerzas de las velas no solo eso si no que lo mide por color para poder entrar perfecto Sirve para hacer scalping y intra day , funciona para los mercados de forex y indices sinteticos sirve para todos los pares ideal para los volatilitys y jumps ! sirve para todas las temporalidades ! Buen Profit !

MA Safari , Indicador numero 5 Del Pack Safari . cuenta con una serie de medias moviles donde llega el cruze y da entrada muy clara , perfecta para grandes temporalidades , para agarrar tendencias largas . sirve para todas las temporalidades . Ideal para mercados de divisas forex y indices sinteticos ! Ideal para volatilitys y jumps , anda en todos los pares ! Buen Profit !!

Bandas Bolinger Profesional , Ultimo indicador del Pack Safari . en este ultimo indicador nos encontramos con una programacion unica , de bandas de bolinger donde se pueden cazar mejor los rebotes en las bandas de arriba y abajo , sirve para los mercados de divisas de forex ! los mercados de indices sinteticos y tambien crypto ! Funciona en todas las temporalidades y todos los pares ! Buen Profit !
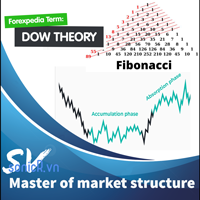
This indicator combine DOW theory with Fibonancy level to determine the structure of financial markets. It include resistance determine to provide an overview of the market. The Dow Theory is an approach to trading developed by Charles H. Dow, who, with Edward Jones and Charles Bergstresser, founded Dow Jones & Company, Inc. and developed the Dow Jones Industrial Average in 1896. In summarize, DOW theory is: + Technical framework that predicts the market is in an upward trend if one of its aver

Supply and demand zones are at the heart of supply and demand trading . These zones are areas that show liquidity at a specific price. The supply zone is also called the distribution zone, while the demand zone is called the accumulation zone. Our indicator automatically draw supply and demand zones in Metatrader 5. It give opportunity to understand trading zone and avoiding risk.
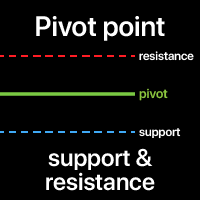
A Pivot point is used to determine the overall market trend. The pivot level itself is the average of the high and low, and the closing price from the previous bar.
On the next bar trading above the pivot point is thought to indicate ongoing bullish sentiment, while trading below the pivot point indicates bearish sentiment.
The pivot point is the basis for the indicator, but it also includes other support and resistance levels that are projected based on the pivot point. All these levels h

Daily VWAP, continues for a period of hours (eg, 10 hours of history),
with color to indicate change of direction and bands to map good entry and exit points. The indicator was created to map the center of the market, and find good buying moments, trend analysis or market correction points are easily detected, allowing you to understand moments of exhaustion and buying and selling points Copyright (c) <year> <copyright holders> Permission is hereby granted, free of charge, to any person obtain

To get access to MT4 version please click here . - This is the exact conversion from TradingView: "Stochastic Momentum Index" By "UCSgears". - This is a popular version of stochastic oscillator on tradingview. - This is a light-load processing and non-repaint indicator. - Buffers are available for the lines on chart. - You can message in private chat for further changes you need. Thanks for downloading
Premium Signal es un oscilador que marca claramente cuando se agota la tendencia y esta por arrancar la nueva lleva 1 linea green que va marcando donde esta llendo el precio y 2 barras 1 de color azul y la otra de color coral la de color azul muestra la fuerza de la vela de subida y el color coral muestra la fuerza de la vela de bajada . se usa en los mercados de forex y en los mercados de indices sinteticos ideal para cualqier temporalidad !

MA Project es un indicador con un conjunto de medias moviles programado en arcoiris donde en 1 cruze te marca tendencia larga para agarrar , es ideal para hacer largos en h1 o h4 ! sirve para los mercados de Forex sirve para los mercados de indices sinteticos tambien funciona muy bien en los volatilitys jumps ! de adapta a cualqier temporalidad ! pero esta programada para hacer largos y agarrar tendencias ! Buen Profit !

Volatility Premium ! es un oscillador que sirve para cazar la fuerza de la vela y agarrar sniper la tendencia el oscillador te muestra niveles de altura donde capta la fuerza de la vela acompañando la tendencia se ve claramente ! sirve para los mercados de forex sirve para los mercados de indices sinteticos se adapta a todos los pares y a todas las temporalidades ! Buen Profit !

Rsi Project es un Rsi programado para hacer scalping en m1 , m5 y m15 , ideal para cazar revotes y a simple vista el rsi te marca los picotazos en los techos y pisos para agarrar esas velas ! sirve tambien para hacer a largas temporalidades ! Sirve para los mercados de forex sirve para los mercados de indices sinteticos se adapta a todos los pares ideal para los volatilitys y jumps ! Buen profit !

Trend Volatil Es un indicador programado para cazar romputas de indices , viene con 2 colores de ropturas , el primero es el Blue que caza la roptura hacia el ALZA el segundo es el color LightBlue que caza la roptura hacia la BAJA . es muy facil de usar y muy completo , se adapta a los mercados de Forex a los mercados de indices sinteticos ! Se usa en caalquier temporalidad ! Se puede hacer scalping y largos ! Buen Profit !

Drop Volatil , es un indicador donde te marca entradas perfectas con la linea de color tomato , donde ay una linea de bajo de esa que te marca el SL Stop loss , y una linea por arriba que te marca TP Take Profit , es linea es color Blue , donde te marca entrada , tp y sl muy facil de usar ! se usa en los mercados de forex y indices sinteticos todos los pares estan aptos ! se usa en todas las temporalidades tambien ! Facil para hacer scalp o largos Buen Profit !

BB Premium , es una nueva tecnica de bandas de bollinger , pero esta es la 2,0 donde te marca rebotes de venta , rebotes de compra , y ropturas , donde en el medio toca la linea dorada , y muestra señal de venta marca la mancha roja como que ay tendencia bajista , donde rebota en el piso que se sale de la banda , marca señal de compra y marca la mancha gris muy facil de usar y facil para cazar scalp o tendencias largas apta para todas las temporalidades y los mercados de Forex y indices si

Price Channel ! Es un indicador Programado para captar entradas de piso y ventas de techo ! da multiples entradas segun la temporalidad que lo uses sirve para soporte y resistencia tambien ! FUnciona en cualquier temporalidad , funciona para los mercados de divisas de forex ! para los pares de indices sinteticos ! Ideal para los volatilitys y jumps ! sirve tambien para crash y boom ! Buen Profit , World Inversor.

Range Target ! indicador que te marca las agotadas de fuerza de la vela donde toca piso y agarra tendencia sea alza o baja el indicador cuenta con dos lineas de soporte donde te marca el piso y el techo donde en la misma linea te marca la entrada para alza o baja , las lineas cuentan con colores Gold y Blue la linea gold muestra la compra la linea blue muestra la venta sirve para cualquier temporalidad , sirve para los mercados de forex sirve para los mercados de indices sinteticos ! Bu

MMA Target es un indicador que indica sessiones de medias moviles donde ay cruzes claros que marcan entradas perfectas va en un conjunto de colores de agresivo a pasivo donde el cruze de verde arriba del rojo da entrada en compra donde va el cruze de rojo a verde da entrada en venta , ideal para hacer entradas en largo ! sirve para hacer scalping tambien ! sirve para los mercados de forex sirve para los mercados de indices sinteticos ! Buen Profit , World Inversor .
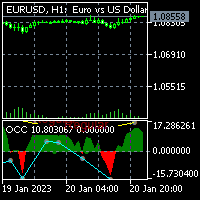
For MT4 version please click here . This is the exact conversion from TradingView: "Open Close Cross Alert R6.2 by JustUncleL" By "JayRogers". - This indicator implements Alerts as well as the visualizations but does not support multi-time frame. - Hidden/Regular divergences supported. - This is a non-repaint and light processing load indicator. - You can message in private chat for further changes you need.

Unlock the power of the market with the Investment Castle Multi Time Frame Moving Average Indicator. Simplify your trading journey by easily identifying trends and pullbacks across multiple time frames on one convenient chart. This indicator is a must-have tool for any serious trader. Available for MT4 and MT5, and exclusively on the MQL5 market, customize your experience by adding as many indicators as you need on the chart, each with their own unique time frame or period. Enhance your strat

This powerful tool is designed to help traders identify key reversal patterns in their charts, including the hammer and star bar formations. With this indicator, you can quickly and easily spot these patterns as they form, allowing you to make well-informed trades and potentially increase your profits. The Hammer Start indicator is customizable, allowing you to set your own parameters for identifying patterns and alerts. Whether you're a seasoned trader or just starting out, the Hammer and Star
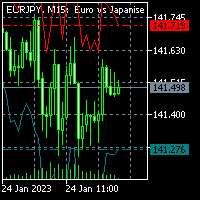
For MT4 version please click here . This is the exact conversion from TradingView: "Average True Range Stop Loss Finder" By "veryfid". - This indicator implements a deviation channel. - The channel determines trend direction as well as stop loss placement. - This is a non-repaint and light processing load indicator. - You can message in private chat for further changes you need.

AC Pivot Panel
AC Pivot Panel is a pivot point indicator including favorite selection panel accessible in the chart. For pivot traders, It is well convenient to easily and quickly can adjust their pivots setting in the chart. To reaching this goal, a panel has been considered to user can easily switch to each pivot levels by different method and time period. In the current version: All pivots including supports and resistance can be selected to display or disappear in the chart just by
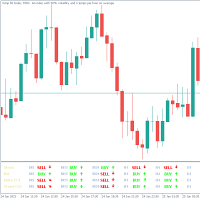
The Trend Assistant indicator is a technical analysis tool that helps traders identify the current trend of a financial instrument by analyzing different timeframes on a chart.
The indicator shows the trend based on M1 (1 minute) , M5 (5 minutes) , M15 (15 minutes) , M30 (30 minutes) , H1 (1 hour) , H4 (4 hours) , D1 (1 day) , W1 (1 week) , and MN1 (1 month) timeframes. The trend is represented by a colored arrows on the sub window chart, with a bullish trend shown in green and a bearish tre

The EMA Engulfing Cross indicator is an indicator for the MetaTrader 5 platform that signals potential buy and sell opportunities based on an engulfing candle pattern after a recent exponential moving average cross. You can adjust how recently the trend change must have occurred using the PASTemaCROSS input. The RSI oversold/overbought function is used to confirm the signals generated by the moving averages. It takes into account the previous bar before the engulfing bar, and it is best used wi

Arrows Scalp Oscillador que indica la compra y venta , va sumado con flechas que te indican sell y buy , cruces de medias moviles donde indican la roptura para entrar mejor siendo la venta o la compra ! perfecto para hacer scalping ! en los mercados de Forex y indices sinteticos ! Tambien sirve para crypto ! apto para cualquier temporalidad , sirve para hacer largos tambien ! Buen Profit ! World Inversor .

Renko Gold ! indica clara mente los pisos y techos donde va de 4 lineas , la linea de abajo que marca el piso en color verde confirmando con la linea mas fina aclara la entrada en compra , lo mismo es para la venta , la linea de arriba marca el techo y la mas fina de color rojo marca la venta , este indicador sirve para todas las temporalidades ! Para los mercados de Forex y Indices sinteticos ! Tambien sirve para los mercados de crypto ! Buen Profit! World Inversor.

Channel Profesional ! indicador que marca claramente los canales alcistas y bajistas marcando tambien soporte y resistencia ! la linea tiene 3 colores donde el color verde marca compra ! la linea de color azul es de rebote y la linea roja es la que marca el techo osea la venta ! sirve para todas las temporalidades para los mercados de forex y indices sinteticos tambien para los mercados crypto ! Buen Profit World inversor.

The Rubdfx swing indicator is a useful tool for traders looking to identify trend changes in a particular instrument they are trading. It is designed to draw a line on the main chart, and the signals are indicated by color changes with signal alerts. The color green is used to indicate a bullish trend, while the color pink is used to indicate a bearish trend. These colors can be customized to fit the trader's preferences or theme. The Rubdfx swing indicator has the ability to spot both long-te
El Mercado MetaTrader es una plataforma única y sin análogos en la venta de robots e indicadores técnicos para traders.
Las instrucciones de usuario MQL5.community le darán información sobre otras posibilidades que están al alcance de los traders sólo en nuestro caso: como la copia de señales comerciales, el encargo de programas para freelance, cuentas y cálculos automáticos a través del sistema de pago, el alquiler de la potencia de cálculo de la MQL5 Cloud Network.
Está perdiendo oportunidades comerciales:
- Aplicaciones de trading gratuitas
- 8 000+ señales para copiar
- Noticias económicas para analizar los mercados financieros
Registro
Entrada
Si no tiene cuenta de usuario, regístrese
Para iniciar sesión y usar el sitio web MQL5.com es necesario permitir el uso de Сookies.
Por favor, active este ajuste en su navegador, de lo contrario, no podrá iniciar sesión.