Nuevos indicadores técnicos para MetaTrader 5 - 34
Any MA
Any Moving Average draws a moving average of * any indicator in a sub-window. Many Indicators included with MT5 are supported by default. You can add custom indicators as well. Settings Name Description Timeframe Select timeframe for calculation Source Indicator Select Indicator Custom Indicator Name Enter Custom Indicator Name ( when Source Indicator is set to Custom) Indicator Settings Source Indicator parameters ( separated by comma ) Moving Average Settings Moving Average pa

With my custom built formula, you can visualize the market similar to displaying a heat map; with color showing at a glance the strength of the current trend, and the bar length showing the intensity of current movement. In more detail: Length of the histogram bar shows the average bar size of the last period, and color (from red to blue) shows the strength of upward or downward movement. Purple zones can indicate a change into a new trend. Bar period is adjustable so as to measure larger or sm

A los mercados les encantan los números redondos y, a menudo, actúan como soporte en un mercado a la baja o como resistencia cuando el precio sube. Este indicador está diseñado para dibujar niveles de precios en valores redondos. Lo hace automáticamente, pero también tiene la opción de anularlo y determinar los niveles que desea ver. Un nivel redondo puede ser tan simple como pasos de 10, 10, 20, 30, etc. o si está trabajando con Forex, tal vez quiera ver cambios en 0.1 o 0.01. El indicador dibu
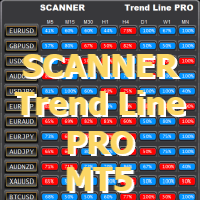
Funciona con el indicador Trend Line PRO y establece archivos creados por la utilidad Optimizer Puede descargar programas adicionales: aquí
El escáner está diseñado para recibir nuevas señales del indicador Trend Line PRO en todos los pares y plazos de M5 a MN1
Para que el escáner funcione, debe tener un indicador. La principal ventaja de SCANNER Trend Line PRO es la capacidad de usar un archivo de conjunto individual para cada par y período de tiempo. Puede ajustar, cambiar y guardar autom
FREE

The Donchian Channel Channels are among the most popular tools of technical analysis, as they visually convey to the analyst the limits within which most price movement tends to occur. Channel users know that valuable information can be obtained at any time, whether prices are in the central region of a band or close to one of the border lines.
One of the best known techniques to explore these concepts is Bollinger Bands. However, John Bollinger was not the only one to research the applicatio
FREE

The indicator draws the daily open line. Parameters
GMT shift (minutes) The time zone could be shifted. The value is given in minutes. Draw closest regular bar's open price This parameter could fine-tune the open price line when using GMT shift. Yes - Draw the open line based on the current chart period's closest regular bar No - Draw the open line based on the M1 chart's closest bar. Let's assume that your shift is 10 minutes, and you are using H1 chart and the first candle in every day is
FREE

Trendy Stock is a price following indicator that uses Stochastic to show when the price is out of the oversold or overbought areas. The algorithm allows you to stay longer in a trend where the bulls or bears are in control. The indicator changes color immediately the price exits oversold/overbought state. In short, the downtrend [red] bars start to paint when the buying pressure decreases while the uptrend [green] bars form as the buy pressure kicks in. For MT4 version, follow :: https://www
FREE

Convenient drawing of parabolic channels by four points (two lower and two upper extremums). Additional control keys: N (New) - Start drawing a new channel. C (Clear) - Deletes the current channel. By default, the current channel is the last channel. But you can click on the line of any channel to make it current. Click on the gear in the upper right corner to set some parameters for all channels or the current channel. All work is visible from the animated Gif.
Do not forget to express your
FREE

This indicator displays buy or sell signals according to Bill Williams' definition of the Trading Zone. [ Installation Guide | Update Guide | Troubleshooting | FAQ | All Products ] Easy to use and understand Avoid trading flat markets Deterministic indicator with clear rules The indicator is non-repainting It implements alerts of all kinds It has straightforward trading implications. A blue arrow is a buy signal A red arrow is a sell signal According to Bill Williams trading in the zone helps t
FREE

Hello!
Tired of constantly subscribing to other people's signals and earning pennies?
Want to manage your own trading?
Then you are on the right page!
It's very simple ==> buy my indicator ==> put it on the chart ==> blue arrow - buy ==> red arrow - sell. Even an infant can do it!
A handy histogram to trace the market direction.
Are you still here? Then read the parameter descriptions and take a look at the screenshots: Stoch K period - period for calculating the% K oscillator line.

This indicator creates the perfect RENKO for you to work with timeless types of Candles! Due to RENKO characteristics of timeless, the indicator adjusts trading arrows (otherwise they would be lost) and leaves them exactly where the negotiation occurred in Renko Candles! In addition, this indicator shows exactly the division between days, in order to make it clear to user where each trading session started and ended! Furthermore, the following indicators were added, giving you bigger analysis p

Scalp using the behavior of a short moving average, the indicator gives the slope and identifies the "hyper" moments.
Operational advice:
Use M1 chart. Period 20 : open buy after two rising lows; sell after two max downhill; avoid countertrend openings; when the line goes flat put a stop at the opening price. Avoid actions in low volatility timeslots. When the curve that draws the min / max is very flat, it is better to postpone at least 15'.
Period 50 : matches the trend, when it is
FREE
Here is a Multi-Time Fram (MTF) ZigZag indicator which can draw price channel. Having ZigZag Channels of higher time frames gives you a more accurate overview of the current price action. In addition, it helps to identify any pattern or cycle that the market is creating or following. It will also help you identify support and resistance levels of higher timeframes and strong price action zones.
You can easily draw horizontal ray line for the open, high, low and close price levels of any candle with this indicator. Parameters Mode Key + click - you should press o, h, l or c keys on the keyboard first, then click on any candle. Mouse hover + click - just move your mouse and point to any candle, then press o, h, l or c keys on the keyboard. Note: in both modes, you should point the horizontal center of the candle for accurate selection. The vertical position of the pointer is irrelevant.
MAs Crossover Dashboard Pro uses the value of Moving Average indicator. The periods of 2 MAs can be adjusted via the Edit boxes of this dashboard. The monitoring pairs will be selected by adding to the Market Watch (no need to set prefixes or suffixes) , you can monitor many pairs as you like. This dashboard will check almost popular time frame (M1,M5,M15,M30,H1,H4 and D1). The colors can be customized. The parameter of MAs can be set at the input. Crossover signal can be sent to you screen, yo

A ‘Supertrend’ indicator is one, which can give you precise buy or sell signal in a trending market. As the name suggests, ‘Supertrend’ is a trend-following indicator just like moving averages and MACD (moving average convergence divergence). It is plotted on prices and their placement indicates the current trend. The Supertrend indicator is a trend following overlay on your trading chart, much like a moving average, that shows you the current trend direction. The indicator works well in a tren

Los niveles de pivote son un nivel técnico bien establecido que es reconocido en todos los mercados. Este indicador dibujará los pivotes trimestrales, mensuales, semanales, diarios y de cuatro horas actuales en el gráfico, para cualquier símbolo. También puede mostrar los niveles de soporte y resistencia para cada período y elegir cuál mostrar del nivel 1 al 4. Elija el tipo de pivote entre: Estándar Camarilla DeMark Woody Fibonacci Tenga en cuenta que los pivotes DeMark tienen un solo nivel

RSI Entry Points is the upgrade of the standard RSI indicator to avoid lagging. Indicator draws the clouds and the arrows to have clear picture where price is and what to wait for. Why standard RSI is lagging? because mostly we do not use it correctly and it is with very weak visual flexibility, less informativity. With my current upgrade I tried to Fix both problems same time and I got much better results and more exact entries than standard RSI has. To make yourself sure check out the screens

The Volume Weighted Moving Average (VWMA) is calculated based on Prices and their related Volumes giving importance to those candles with more Volume. During periods of almost equal volume distributed along the observed period (commonly, in low volume periods) the VWMA will be graphically similar to a Simple Moving Average. Used along other moving averages a VWMA could be used as an alert, filter or whatever your imagination could think of...
HOW TO "READ" THIS INDICATOR As any Moving Average.
FREE

//////////////////////////////////////////////// //////////////////////////////////
An improved version of the standard Bulls Power and Bears Power indicators.
Now it's two in one.
The setup is simple - you just need to specify the period. It is also very easy to understand the readings of this indicator, a signal above zero is a buy, and below it is a sell.
//////////////////////////////////////////////// ///////////////////////////////////
I hope this indicator will be very useful t
FREE

//////////////////////////////////////////////// //////////////////////////////////
An improved version of the standard Average True Range indicator.
It is now a responsive and smoothed line.
The setup is not straightforward - but I hope you can do it. It is very easy to understand the readings of this indicator, the meaning is the same as that of the standard Average True Range.
//////////////////////////////////////////////// ///////////////////////////////////
I hope this indicator
FREE

An improved version of the standard Standard Deviation indicator.
It is now a responsive and smoothed line.
The setup is not straightforward - but I hope you can do it.
It is very easy to understand the readings of this indicator, the meaning is the same as that of the usual Standard Deviation.
//////////////////////////////////////////////// ///////////////////////////////////
I hope this indicator will be very useful to you in successful trading.
Good luck.
FREE

Indicator of trend deviation with a static level. The deviation coefficient is set for the trend histogram. Signals are the intersection of the level trend histogram in the direction of the trend or during a trend reversal - the option is selected in the indicator settings by the "Revers" parameter. There are all the necessary settings for the design of the indication and sending messages to mail or a mobile terminal. All input parameters have an intuitive name. Analog for MT4: https://www.mql5.

This indicator shows on the current day some lines of interest, such as maximum, minimum and closing of the previous day, as well as the opening, maximum and minimum price of the current day.
It can also show the GAP (closing of the previous day and opening of the current day) and projections of the amplitude of the previous day, according to the value you choose in the multiplier.
Oh, I was going to forget. It is also possible to determine the time frame, which is daily by default.
If th
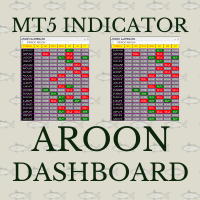
Aroon crossover Dashboard uses the value of Aroon indicator. The Aroon period can be adjusted via the Edit box of this dashboard. The monitoring pairs will be selected by adding to the Market Watch (no need to set prefixes or suffixes) , you can monitor many pairs as you like. This dashboard will check almost popular time frame (M1,M5,M15,M30,H1,H4 and D1). The colors can be customized. The Aroon indicator has been included in to this Dashboard, you do not need purchasing it. Crossover signal c
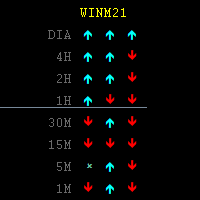
Indicador visual que mostra a direção de um ativo em diferentes times frames. Acompanhe em tempo real a variação de direção dos preços nos últimos 3 candles. É possível escolher o ativo a ser mostrado e quais times frames deseja acompanhar. Excelente para operações Day Trade. Facilita a visualização de vários times frames auxiliando assim na tomada de decisão rápida. Parâmetros de fácil configuração.

Túnel de Vegas, com até 20 níveis, permitindo plotar ou não cada nível com troca de cor, espessura das linhas e visualização ON/OFF para facilitar a utilização.
Recomendado a utilização para timeframes:
Original --> H1
Fractais --> M15, M30, H4, D1 e W1 Teste em Gráfico W1 apresentando consistência.: https://www.mql5.com/pt/signals/2211259 Acompanhe os resultados no meu sinal:
https://www.mql5.com/pt/signals/2211259
Tiago Lacerda Telegram: @tfmlacerda
E-mail: mediador@gmail.com
Yo

Al operar con The Strat , es importante estar atento a múltiples marcos de tiempo. Este indicador mostrará el estado diario, semanal, mensual y trimestral de la vela actual para cada período de tiempo. Un icono de círculo muestra que la vela en ese período de tiempo es actualmente un Interior, o Tipo 1 en la terminología de TheStrat. Una vela Inside Day está consolidando la acción del precio y estamos buscando una ruptura del rango. Un ícono de Triángulo, apuntando hacia arriba o hacia abajo

Dark Inversion is an Indicator for intraday trading. This Indicator is based on Counter Trend strategy but use also Volatility. We can enter in good price with this Indicator, in order to follow the inversions on the current instrument. Hey, I made an Expert Advisor based on this indicator, if you are interested: Dark Titan MT5
Key benefits
Easily visible Inversion Lines Intuitive directional arrows Automated adjustment for each timeframe and instrument Easy to use even for beginners Never
FREE

Hello Seasonal Traders! The seasonality trading strategy works because the smart money is doing the same thing every single year more often than not. The month of the year or the day of the week and the time of the day can call the shots in any market. The seasonal cycle is another useful tool in your trading arsenal. I'm not saying to trade solely off of seasonality and forget anything else. I'm only giving you another trading tool that you can incorporate into your own trading strategy to ga
Currency Chart is a MT5 overlay indicator for 8 major currencies including AUD, CAD, CHF, EUR, GBP, JPY, NZD and USD. The chart represents one currency average prices relative to the others. The currency chart makes us easy in evaluate direction, trend, strength, support and resistant levels or even a reversal level of the currency. Good for medium-term and long-term trading styles. Chart type: Candlestick chart, bar chart or line chart. Chart timeframe: Same as MT5 timeframe. Built-in indicator

Session Control session indicator. Depending on from which continent the trading activity takes place in a certain period, the entire daily routine is divided into several trading sessions.
Due to the fact that at each separate time interval exchange and banking platforms from different parts of the world are connected to the trading process, and the Forex market operates around the clock.
There are 4 main trading sessions:
Pacific. European. American. Asian.
This indicator allows you t

This indicator displays the spread Simple and easy to use and fully customisable: View as Pips or Pipettes Chart symbol can be hidden Text display can be changed Change color and text styles Add or hide a decimal point Spacing options between inputs Default screen positions Screen position inputs
How to use 1. Simply use the default settings; or 2. Choose to show pips or pipettes; 3. Choose to display symbol, text or decimal; 4. Choose where to place it on the screen; 5. Save settings or save
FREE

Помощник для торговой системы SystZ . Чертит трендовые линии по соседним экстремумам зигзага. Условие для линии сопротивления - правый должен быть ниже левого. Для линии поддержки - правый выше левого. Не допускается, чтобы между экстремумами, по которым проводится трендовая линии были другие. Экстремумы, удовлетворяющие этим условиям, отмечены символом фрактала. Закрытие свечи за линией - сигнал для открытия позиции.
FREE

Baze Zone is a configurable combination of tools/levels (MT4 version also available at MT4 section): - Fib levels, 14, 23,50 - Fib Extension 27,61 - Pivot Points - Adds boxes to indicate range 'breakout' - ATR Range - Prev Daily Candle Range - Shortcut keys to hide/show the lines (configurable) In short, use this tool to add some extra zones to you fib tool. And use the extra's in combination with the shortcut keys to keep your chart clean. You can drag the lines for the Fib Levels.
The name
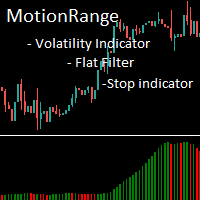
MotionRange - индикатор волатильности цены.
Индикатор не показывает направление движения цены и предназначен для наглядной демонстрации наличия трендового движения, силы тренда, ускорения и замедления трендового движения. Индикатор можно использовать для: - фильтрации флэтового состояния рынка, - открытия позиций в момент начала тренда, - закрытия позиций в момент замедления или остановки тренда.
У индикатора один входной параметр - Calculation Period. Это количество сравниваемых свечей

FTFC se refiere a Full Timeframe Continuity como se define en The Strat de Rob Smith. Este indicador dibuja dos líneas en el gráfico, una de las más altas de los niveles de apertura trimestrales, mensuales, semanales, diarias o por horas, y la segunda de las más bajas de esos valores. Esto le da un canal por encima o por debajo del cual es más probable que el comercio sea muy fuerte en una dirección. Entre líneas, la acción del precio será más agitada y es posible que desee utilizar paradas

The "VSA on the FLY" indicator is designed to quickly display various Volume Profile / Market Profile parameters.. The indicator takes the initial data for operation from the M1 timeframe. The indicator is installed on any timeframe and starts displaying data starting from the selected left border. This can be the beginning of a day, a week, a trading session, any hour, etc.
The version of this indicator for MetaTrader 4 can be found here .
The following input parameters are available: Show

Blended Candle Strength (BCS)
Any trading strategy, whether it is a continuation, trend reversal or breakout requires, in addition to analyzing the context of the price movement, confirmation signals for both trading entry and exit. And for that, it is necessary to analyze the formats of the candlesticks and fit them in known patterns to assist decision making. In addition to the context and format, two other important information to determine the strength of candlesticks are the size of the ba
FREE

Este indicador dibujará una etiqueta por encima o por debajo de cada vela basada en TheStrat de Rob Smith a medida que se desarrollen con el tiempo en su gráfico.
A medida que evoluciona el precio, una vela puede cambiar entre tres estados. Cuando la vela se abre por primera vez, si se encuentra completamente dentro de las velas anteriores altas y bajas, entonces comenzará como un Tipo 1. A medida que pasa el tiempo, si rompe el máximo o mínimo de la vela anterior, se producirá un tipo 2, y s
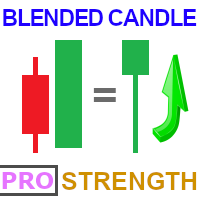
Blended Candle Strength PRO (BCS)
Any trading strategy, whether it is a continuation, trend reversal or breakout requires, in addition to analyzing the context of the price movement, confirmation signals for both trading entry and exit. And for that, it is necessary to analyze the formats of the candlesticks and fit them in known patterns to assist decision making. In addition to the context and format, two other important information to determine the strength of candlesticks are the size of th

Do you already know the Start Midas indicator?
What about the Vwap Standard Deviation indicator?
And I need to speak again in the book MIDAS Technical Analysis ...
The Start Midas SD Channel indicator combines the two in one, bringing the practicality and efficiency of Midas with the statistical calculation of the standard deviation.
All of this with the practicality of the White Trader Start indicators, where you can plot the indicator and move them on the screen using keyboard s

The Vwap Bands Auto indicator seeks to automatically map the maximum market frequency ( automatic update of the outermost band ) and has two intermediate bands that also adjust to daily volatility.
Another tool from White Trader that combines price and volume, in addition to mapping the daily amplitude.
The external band is updated automatically when the daily maximum or minimum breaks the current frequency, and can be an input signal, seeking a return to the daily vwap.
Thus, in ad

Here we have the Start Midas Fibo Bands , I confess that it is an indicator that excited me enough to operate because I was able to find more defined rules. Well, the indicator has the functions of the other indicators of the Start line , which is a possibility to plot several Midas on the screen, you can move the anchor point using keyboard shortcuts and use the legend to differentiate one anchor from another. The rules that I have analyzed for my possible setup are recommended to the entry, st
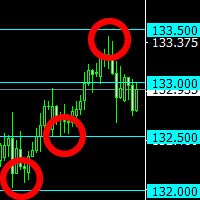
The indicator plots "round" levels, the step of which is specified in the settings. Perfect as an addition to any trading systems.
Very low price - only $30! Round levels often become price support or resistance. MT4 version: https://www.mql5.com/en/market/product/67245
This allows you to either fix a profit, or open a position after a breakdown of the level, work towards a rebound in price. Support: https://www.mql5.com/en/channels/TrendHunter The indicator will be an excellent tool in a

Weighted average price indicator or VWAP. The well-known standard VWAP with the beginning of the day is added with the function of selecting the periodization. It can be calculated both every day and on other periods. Also the indicator allows to exclude the volume from the calculation, which will allow using it on the cryptocurrencies and forex. There is an alert for a VWAP price crossing. There are 1 and 2 standard deviation. Settings: Volume: turning volume on and off in the calculation mecha

This indicator creates the perfect RENKO for you to work with timeless types of Candles! Due to RENKO characteristics of timeless, the indicator adjusts trading arrows (otherwise they would be lost) and leaves them exactly where the negotiation occurred in Renko Candles! In addition, this indicator shows exactly the division between days, in order to make it clear to user where each trading session started and ended!
Important details: The automatically generated RENKO has an accuracy of up t

Midas is the acronym for Market Interpretation / Data Analysis System is a trade approach started in 1995 by technical analyst Paul Levine and later developed by Andrew Coles, PhD and David Hawkins. Learn more in the book MIDAS Technical Analysis: A VWAP Approach to Trading and Investing in Today's Markets , (I saw that it is possible buy via Amazon). The positive points in relation to the Midas-based indicators are the prediction of movement reversal points, the negative point is the subjectivi

RubdFx Perfect Reversal , The reversal indicator is used to determine areas of support and resistance by Drawing an arrow with a level of supply and demand ( ReversalZones ). - You will catch more swings by reducing the period, and less swings if you increase period - Mobile, computer and email alerts available . it is not pushed by price which means the arrow will stay in one place,suitable for scalping and long term trading Also Compatible with all forex paris , BUY RULES; open a buy positio

O indicador Vwap Deviation Bands segue na mesma linha dos outros indicadores da White Trader, que buscam leveza, personalização e qualidade, para entregar o que há de melhor para o trader. Isto, além de combinar preço e volume (informações importantes para o trader) com uma medida estatística do desvio padrão.
Este indicador já foi utilizado e testado por outros traders que deram sugestões, inclusive, para chegarmos nesta versão final (embora ainda esteja aceitando sugestões, sempre :) ). O d

The Alligator indicator uses three smoothed moving averages, set at five, eight, and 13 periods, which are all Fibonacci numbers. The initial smoothed average is calculated with a simple moving average (SMA), adding additional smoothed averages that slow down indicator turns. Scan all your favorite pairs with Alligator, and get notified on your preferred time frames.
Setting is Customizable
Click to change time frame or open new pairs
Notification: Phone/Popup/Email

This indicator Allow you to get notification from 7 indicators. Scan all your favorite pairs with your favorite technical indicator, and get notified on your preferred timeframes.
Settings are Customizable
(RSI, ADX, MACD, Alligator, Ichimoku, Double MA, and Stochastic)
Click to change the time frame or open new pairs
Notification: Phone/Popup/Email

////////////////////////////////////////////////// // //////////////////////////////////////////////// //// ///////////////////////////////////
Go My Way es un indicador ultrapreciso de la dirección de la tendencia o del movimiento del precio.
Este indicador se calcula sobre la base de una docena de otros indicadores y tiene un mecanismo muy complejo.
////////////////////////////////////////////////// // //////////////////////////////////////////////// //// ///////////////////////////////

Dark Support Resistance is an Indicator for intraday trading. This Indicator is programmed to identify Support and Resistance Lines , providing a high level of accuracy and reliability.
Key benefits
Easily visible lines Only the most important levels will be displayed Automated adjustment for each timeframe and instrument Easy to use even for beginners Never repaints, never backpaints, Not Lag 100% compatible with Expert Advisor development All types of alerts available: Pop-up, Email, Pus

Hyper DM, Moving Distance from Moving Averages is an indicator that allows you to define the distance in points of the upper and lower bands in relation to the moving average in the middle.
Its operation is simple, it has configuration parameters of the moving average of the middle and based on it and the defined distance parameters of the upper and lower bands, it is plotted in the graph.
FREE

A personal implementation of the famous Bollinger bands indicator as a trend following mechanism, which uses a moving average and the standard deviation to define what a trend is and when it changes. Bollinger bands are usually used as an oversold/overbought indicator only, but in my opinion, the trading approach is more complete using the trend variant as an exit strategy. [ Installation Guide | Update Guide | Troubleshooting | FAQ | All Products ] Easy to trade Customizable colors and sizes I
FREE

Este indicador puede determinar los niveles de precios en los que hubo más volumen durante el período histórico especificado. En el futuro, el precio a menudo rebota en esos niveles y esto se puede aplicar con éxito en el comercio. Se muestran como líneas, algunos parámetros para determinar los niveles se pueden ajustar. Este indicador es una versión gratuita de Volume Levels MT5, por lo que no proporciona señales y la construcción de niveles se limita a un par de divisas EUR / USD. Para todos l
FREE

This indicator plots in the candles the divergence found in the selected indicator and can also send a notification by email and / or to the cell phone.
Works on all TIMEFRAMES. Meet Our Products
He identifies the divergences in the indicators:
Relative Strength Index (RSI); Moving Average Convergence and Divergence (MACD); Volume Balance (OBV) and;. iStochastic Stochastic Oscillator (STOCHASTIC).
It is possible to choose the amplitude for checking the divergence and the indicator has

Was: $49 Now: $34 Blahtech Better Volume provides an enhanced version of the vertical volume bars. Each bar is compared to the previous 20 bars. Depending on its volume, range and volume density it will be assigned a state and colour. Low Volume – Minimum volume High Churn – Significant volume with limited movement Climax Neutral – High volume with unclear direction
Climax Up – High volume with bullish direction Climax Dn – High volume with bearish direction Climax Churn – High vol
Big promotion! , prices are now on discount , get your copy now The Rubdfx Price Tracker that is used to show price price bound , the price almost never goes out of the channel and most of the time price will react when it touches the channel limits .It determines the best highest and lowest prices at which you can sell and buy respectively Suitable for scalping & swing trading It Draws arrows that appear after a candle close , The arrows indicate bullish or bearish pressure For bearish an

The market price usually falls between the borders of the channel .
If the price is out of range, it is a trading signal or trading opportunity.
Basically, Fit Channel can be used to help determine overbought and oversold conditions in the market. When the market price is close to the upper limit, the market is considered overbought (sell zone). Conversely, when the market price is close to the bottom range, the market is considered oversold (buy zone).
However, the research can be used

Automatic Trend Line Fit. This indicator automatically plots the straight line and parabolic (curved) trend to any symbol at any timeframe. The plotted straight line is a good indication of the current trend and the curved line is an indication of a change momentum or change in the current trend. Plotting the straight line over about 2/3 the number of candles as the curved line is usually a good way to determine entry and exit points as it shows the current trend and momentum of the market. This
FREE

GenMA MTF
The signal indicator WITHOUT REDRAWING gives recommendations on the direction of trading.
When the price moves through the internal channel, it gives signals (red and blue arrows) that recommend a possible change in the direction of the price movement up or down.
When the price crosses the external channel, it gives signals (yellow arrows), warning that a strong price movement is possible, which will not immediately change the direction of trading.
When the price crosses the a
FREE

Gapless Moving Average (GMA)
Improved version of standard Moving Average (MA) from MetaTrader library which provides the possibility to eliminate the 'gaps' between candle sticks which distort the average values mainly during the N ('period') initial candles after market opens due to the spread ('gap') between closing price from previous day and opening price from the next day. The greater these 'gaps' are, the more divergent the standard MA is in order to indicate the current p
FREE

Stochastic: It was developed by George Lane in the early 1950s. It is based on the principle that the price closes close to the maximum if the asset is on an uptrend, and close to the minimum if it is on a downtrend. Following the idea of the inercial movement of prices. This indicator can generate possible signals of overbought moments or about asset sales. In a usual way it can used according to some standards;
Slow Stochastic: A moving average of 3 periods is calculated on the stochastic i

In the world of finance, correlation is a statistical measure of how two securities move in relation to each other. Correlations are used in advanced portfolio management. This indicator measures how different securities move in relation to a reference one, thus making portfolio management easier. [ Installation Guide | Update Guide | Troubleshooting | FAQ | All Products ] Avoid concurrent trades in highly correlated instruments Find trading opportunities among highly correlated instruments Cor
FREE

Фрактальная дивергенция - это скрытая дивергенция, построенная на фракталах Билла Вильямса. Бычья фрактальная дивергенция представляет собой комбинацию из двух нижних фракталов, последний из которых расположен ниже предыдущего, и при этом две свечи справа от минимума последнего фрактала имеют минимумы выше уровня предыдущего фрактала (см. скриншот 1). Медвежья фрактальная дивергенция - это комбинация из двух соседних верхних фракталов, последний из которых расположен выше, чем предыдущий верхн
FREE

Esse Indicador é uma boa opção para quem gosta de operar a longo prazo e com paciência. Ele trabalho com os níveis de fibo na media de 200 são 9 níveis onde você pode operar nas reversões o mercado partir do níveis abaixo. Level 1 = 550 pontos Level 2 = 890 pontos Level 3 = 1440 pontos Level 4 = 2330 pontos Level 5 = 3770 pontos Level 7 = 9870 pontos Level 8 = 15970 pontos Level 9 = 25840 pontos Level 6 = 6100 pontos
FREE

El panel de alertas de ADR le muestra de un vistazo dónde se negocia actualmente el precio en relación con su rango diario promedio normal. Recibirá alertas instantáneas a través de una ventana emergente, correo electrónico o push cuando el precio exceda su rango promedio y los niveles por encima de su elección para que pueda saltar rápidamente a retrocesos y reversiones. El guión está diseñado para colocarse en un gráfico en blanco y sentarse en el fondo y alertarlo cuando se alcanzan los nive

El panel de alertas RSI / TDI le permite monitorear los RSI a la vez (seleccionables por usted) en cada par principal que opere.
Puedes usarlo de dos maneras:
1. Seleccione varios marcos de tiempo y el guión le mostrará cuándo hay varios marcos de tiempo que se extienden más allá de las condiciones comerciales normales. Un gran indicador de que el precio ha subido con fuerza recientemente, ya que ha alcanzado un nivel de sobrecompra o sobreventa en múltiples marcos de tiempo, por lo que p
MetaTrader Market ofrece a todos los desarrollador de programas de trading una sencilla y cómoda plataforma para ponerlos a la venta.
Le ayudaremos con la presentación y explicaremos cómo preparar la descripción de su producto para el Market. Todos los programas que se venden a través del Market están protegidos por una codificación adicional y pueden ser iniciados sólo en el ordenador del comprador. La copia ilegal es imposible.
Está perdiendo oportunidades comerciales:
- Aplicaciones de trading gratuitas
- 8 000+ señales para copiar
- Noticias económicas para analizar los mercados financieros
Registro
Entrada
Si no tiene cuenta de usuario, regístrese
Para iniciar sesión y usar el sitio web MQL5.com es necesario permitir el uso de Сookies.
Por favor, active este ajuste en su navegador, de lo contrario, no podrá iniciar sesión.