Nuevos indicadores técnicos para MetaTrader 5 - 33
This indicator shows No Demand and No Supply signals for high probability trade entries and exits. Very powerful when combined with specific support and resistance zones to identify turning points in the market.
No Demand – the situation of a deficit of buyers in the up-move. Possible short position. Definition: (look at the below screenshots for illustration) Signal candle volume is lower than the previous two. Signal candle is bullish. Signal candle has an upper wick/pin. Confirmation candle

The indicator Bottom Touch determines the bottom in the market, from which a rebound or a global reversal may start with a high probability. Works best on more volatile markets and H1 , H4 , D1 timeframes. Does not work on timeframes above W1.
Consists of two lines Green and Gray . Bounces from the Gray line occur less frequently, but have the highest probability of a bounce or even a market reversal. Bounces off the Green line are more frequent, but less likely to bounce.
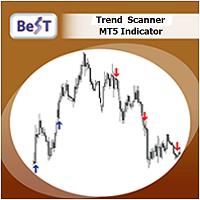
BeST_Trend Scanner is an MT5 Indicator that uses a proprietary algorithm in order to identify the most likely levels and probable moment for an upside or a downside trending price move.
BeST_Trend Scanner is a very useful tool that defines in advance and with a high statistical percentage of accuracy the subsequent Resistance & Support Levels of the anticipated upside or downside trending move of price and so
When used at its Reverse Entries Mode :
It generates Buy or Sell arrows at the

A scrolling Market Ticker that displays price changes from all symbols in the Market Watch list. Provides an easy snapshot of symbol prices, and keeps scrolling automatically while you trade and analyse the chart.
Options include: - MTF, eg choose to show price changes of the daily chart, or the hourly - use the live candle or the recently completed - font and background coloring
FREE

Индикатор показывает настроение слабой стороны и может использоваться как для внутридневной торговли, так и для скальпинга. Всё будет зависеть от контекста графика. Этот индикатор строит ценовой график в виде блоков (вертикальных прямоугольников, занимающих три ценовых уровня каждый), чем-то напоминающих ренко бары. Принцип построения основан на определённом изменении уровней BID и ASK (пояснения на скрине). При установке индикатора основной график становится невидимым и на белом поле происх
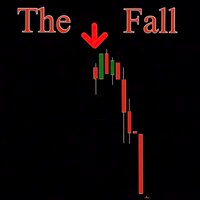
Hurry and buy before price doubles! *Non-Repainting Indicator Message Me Immediately After Purchase For VIP Installation Help and Free Trend Filter Indicator "The Fall" is an indicator that shows precise Sell reversals. A great arsenal to add to any chart. "The Fall" is designed to alert SELLS only. So Of course, Only Take The Arrows In a Downtrend Only For Best Results I Recommend www.CoinexxBroker.com as a great broker and the one I personally use *Non-Repainting *For Desktop MT5 Only *G

WALKING ON THE CLOUD
TREND INDICATOR GREEN ARROW : UPTREND BLU ARROW : DOWNTREND
BASED ON SEVERAL TREND INDICATORS :
MOVING AVERAGE / ICHIMOKU KYNKO HYO / SUPERTREND / PARABOLIC SAR
HELP YOUR TRADING WITH THIS POWERFULL INDICATOR ! PROFITABLE IN EVERY TIMEFRAME AND IN EVERY CHART BUT THE SIGNALS ARE MORE ACCURATE IN H1 TIMEFRAME,SO I SUGGEST THIS TF RECEIVE DIRECTLY TO YOUR PHONE THE SIGNAL WHEN A NEW ARROW APPEARS PLEASE CONTACT ME FOR EVERYTHING

The only Market Ticker on the market! Add a professional novelty to your workspace, with built in mini-charts
A scrolling Market Ticker that displays price changes from all symbols in the Market Watch list. Provides an easy snapshot of symbol prices, and keeps scrolling automatically while you trade and analyse the chart. The ticker color (+/- price changes) are based on either the current or completed candle, and the previous candle.
Options include: - MTF, eg choose to show price changes o

Si te gusta este proyecto, deja una revisión de 5 estrellas. Seguir en instagram: borelatech El precio medio ponderado es la relación del valor negociado con el volumen
total
cambió sobre un horizonte temporal particular. Es una medida del precio promedio
a
que un stock se comercializa sobre el horizonte comercial. VWAP a menudo se
utiliza como
referencia comercial de inversores que pretenden ser lo más pasivos posible en
su
ejecución. Con este indicador podrás dibujar el VWAP para:
FREE

Indicador de volatilidad imperturbable.
Una modificación radical del tan querido indicador ATR, que soluciona todos sus defectos (la imagen muestra la diferencia con el ATR). El indicador muestra la magnitud del movimiento actual del mercado.
Características: no tiene un periodo de ventana de tiempo, es decir, cualquier ajuste subjetivo sin retardo, los extremos del indicador siempre coinciden con los extremos del precio (observe la imagen) se normaliza mediante el color, es decir, tiene pr
The Lots Risk Sizer indicator will help you quickly determine the volume of a position in lots
The indicator has a collapsible panel at the touch of a button. When installed on a chart, it is located in the lower right corner in the form of a triangular button. Indicator parameters:
Risk - the amount of risk in the account currency (usd, eur, etc....). Enter only a whole number
Lots - risk in lots
Show description (On/Off) - show a text description of the displayed values
Display state

ATR dynamic level
El indicador calcula el rango de precios dentro del cual se movió el precio del activo durante el período de tiempo especificado, y también construye los límites del rango calculado para la semana actual y hoy. Los niveles se calculan desde el comienzo de la apertura de la semana (semanal) y desde el comienzo de la apertura del día (día).
Particularidades:
1) los niveles de soporte y resistencia son siempre relevantes, ya que estos niveles cambian junto con el movi

"Five Minute Drive" indicator that is designed to be used in the 5 minute timeframe only. One of its most important advantages is that it shows the general trend in the upper time frames when looking at the 5-minute timeframe. Therefore, when opening positions in the 5 minute timeframe, when it is in line with the trends in the upper timeframes, you are less likely to be upside down. If you can interpret the curvilinear and linear lines drawn by this indicator on the graphic screen with your geo
FREE
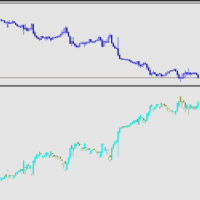
反转K线指标! 指标将主图的K线在副图中进行反转显示. 交易实用必备工具指标 波浪自动计算指标,通道趋势交易 完美的趋势-波浪自动计算通道计算 , MT4版本 完美的趋势-波浪自动计算通道计算 , MT5版本 本地跟单复制交易 Easy And Fast Copy , MT4版本 Easy And Fast Copy , MT5版本 本地跟单复制交易 模拟试用 Easy And Fast Copy , MT4 模拟账号运行 Easy And Fast Copy , MT5 模拟账号运行 The indicator of the attached figure shows that it is a mirror image of the candlestick chart of the main chart. The ordinate of the figure indicator is mirrored with the main image, and the coordinate value is a negative number.
For graphic reference o

Un patrón de gráfico de triángulo simétrico representa un período de contracción y consolidación antes de que el precio se vea obligado a romper al alza o romperse. Una ruptura desde la línea de tendencia inferior marca el inicio de una nueva tendencia bajista, mientras que una ruptura desde la línea de tendencia superior indica el inicio de una nueva tendencia alcista.
Versión MT4 disponible aquí: https://www.mql5.com/en/market/product/68709/
Este indicador identifica estos patrones y le a

This indicator plots the volume profile by Price on the chart
There are 5 ways to view it:
By Total Volume Traded; Volume Ticks(Forex) Separated by Buyers and Sellers; Buyers Only; Sellers Only and; Business balance (Buyers - Sellers).
It is possible to select how many days the profiles will be calculated.
On the current day it recalculates the histogram data for each new candlestick.
Another feature is to select the highest trading range by entering the desired percentage.
Th
FREE

This indicator shows the TLH and TLL and some trendlines that allow us to estimate the trend of market. It also shows the values of the angles of the lines in percentage in points (pip) , the standard deviation, and the trend of each line, and when it breaks the lines of support and resistance (TLH and TLL). And finally, it also shows the points identified as supports and resistances through the fractal algorithm in the graph. The high and low trend lines are supported by the highs and lows, th
FREE

For those who love to trade using the Heikin Ashi Candlesticks, here it is one more powerful ally: Heikin Ashi Volume . This indicator is an exclusive idea and creation from us at Minions Labs for you. The idea behind this indicator is to have a visual cue over the Heiken Ashi candles pointing at those candles with big volume. For this to happen you can choose between 2 different techniques of identifying the "high" volume: Higher Volume above the last N previous bars average. Higher Volume segm

Indicator that will show your Balance , and your Equity . Really simple to use, no specific requirements to install it. However you can deeply configure it for your own wishes. The pannel has 4 buttons. Only current will display the information of the chart you linked the indicator. If this is deselected, you will have the information of the whole account. Only Buys will display only the BUY orders and Only Sells will display only the SELL orders. Show Zero will display the 0
An indicator of patterns #32 and #33 ("Measured Move Up/Down") from Encyclopedia of Chart Patterns by Thomas N. Bulkowski. Parameters: Alerts - show alert when an arrow appears Push - send a push notification when an arrow appears (requires configuration in the terminal) PeriodBars - indicator period MinMovment - minimum movement value (in points) BackMovment - maximum value of return movement (as decimals) ArrowType - a symbol from 1 to 17 ArrowVShift - vertical shift of arrows in points Sh
MT4 version - https://www.mql5.com/ru/market/product/69932
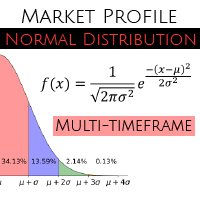
Unlike other indicators of this type, this version has: The ability to display data from smaller timeframes on the current chart. For example, displaying data from the M1 period on the H1 chart. Calculation of values using the Gaussian formula (normal distribution formula). Flexible system of settings. Settings: basePeriod - base period. indicatorMode - display mode. Sets the value of each interval: by4h (4 hours), by6h

El indicador muestra niveles técnicos importantes en el gráfico. Estos niveles actúan como soporte o resistencia para el movimiento de precios.
Los niveles más importantes son múltiplos de 100 y 50 puntos. También puede mostrar los niveles en múltiplos de 25 puntos.
Cuando el precio alcanza el nivel, se muestra una alerta o notificación automática.
Versión para MT4 https://www.mql5.com/es/market/product/69486 Ajustes Show Levels 100 pips - mostrar niveles en múltiplos de 100 pips Show Lev
FREE
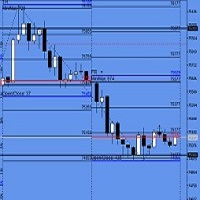
Open close levels.
Open close levels - is an indicator for MetaTrader 5, which displays High/Low, Open/Close, ATR levels (set manually) of the day, week, month on the chart. Marks round levels, signs the days of the week, numbers every week. All levels are marked with price tags with a price symbol. Also, the indicator automatically calculates and displays on the chart the distance that the price has passed from High to Low and from Open to Close by day, week and month.
The indicator di

Automatically plots the 'Golden Fibonacci Ratio’ between the High and Low of the previous day... ...Highs and Lows are great Support and Resistance zones.
Breakouts of Fibonacci levels are key points for entry and exit of trades.
Pink lines indicate that the previous day's Candle closed lower. Blue colored lines indicate that the previous day's Candle closed higher.

For anyone studying forex charts, the aim is to identify trends, and spot reversals. If you have years of experience it may be easy, but most of us need something to make the trend apparent. If you're familiar with the popular renko charting method, you know that it was developed for this purpose. But renko charting has a flaw; the trend is often broken by false reversals. So I developed my own version - the Kenko Trend Indicator. The kenko trend indicator draws renko style trend following block

One of the most famous phrases in the trading world is "The Trend Is Your Friend".
Trading following the current trend is one of the most successful ways in terms of probability. The hard part of it is to recognize when the market is trending or not.
that's the role of our indicator we called The Trend Is Your Friend Until It Is Not. Apart from its big name it is really easy to use and see when the market is trending or ranging. Through a little window of 3 colors you will identify if the ma

An indicator of patterns #35 and #36 ("Pipe bottoms" and "Pipe tops") from Encyclopedia of Chart Patterns by Thomas N. Bulkowski. Parameters: Alerts - show alert when an arrow appears Push - send a push notification when an arrow appears (requires configuration in the terminal) PeriodBars - An indicator period (number of bars that form a top/a bottom) K1 - an additional parameter that influences the accuracy of pattern shape recognition K2 - an additional parameter that influences the accuracy

Version 1.0 The Trend Snatcher is Multi timeframe indicator that can be used to catch swings on the price market chart The indicator uses two lines that targets the highest buying and lowest selling levels , the signal indicated by the two lines crossing The indicator is suitable for scalping and Swing trading, It can also be used as additional Confluence to enter a trade when Price is at a significant level of supply and demand or Trendline touch
HOW IT WORKS? Buying : Place your Buy

Stable Signals is a simple indicator with simple and reliable signals. The first advantage a trader gets when using forex arrow indicators is convenience. There is no need to look for the intersection of moving averages or oscillator lines by straining your eyes and peering at the chart. It is enough to see 1-2 arrows - and this is already a signal. The good thing is that the arrow is colored. The trader is always looking for good indicators. It is very convenient to use arrow Forex indicators,

The name Aroon means “ Dawn's Early Light ” in Sanskrit. His creator Tushar Chande chose this name because the indicator is designed to catch the beginning of a new trend. At first sight it seems a little confusing all those jagged lines but after you understand the basics of it, you will find this indicator pretty cool and use it in a variety of ways, i.e.: Trigger, Trend Filtering System, and so on. The Aroon indicator was created in 1995 so it is a "modern" indicator compared to the Jurassic
FREE

Half Trend TPSL Buy Sell Indicator calculates the open and close of the price bars over the selected period of time and applies its own calculation method to find an average line of the price movement. ATR based Take Profit and Stop Loss ATR is a measure of volatility over a specified period of time. The most common length is 14, which is also a common length for oscillators, such as the relative strength index (RSI) and stochastics. A higher ATR indicates a more volatile market, while a lowe

Sends alert when price moves from the previous alarm price by predefined points (or bps). Four alarm modes: push notifications, pop-up, e-mail and / or FTP. Highly customizable alert text and user-configurable indicator color / width / style.
Input parameters: Alert offset, in points : Alert is triggered when price moves from the previous alert by predefined points (if the last alert has not been registered, the current price is used as the last alert). The alert price is updated automaticall

RSI Arrow1 is an arrow indicator based on the RSI, is easy to use; no internal adjustments to be made. the user can change the indicator period as desired in the settings. It can be used on all markets but it will all depend on your Trade strategy. There is no better Time Frame for its use; the use will depend on the Trader himself.
Settings:
RSI Period Push Notification Email Notification Audible Alert Down levels Up levels

HLBand is an indicator which can show trend, volatility channels, and it has 3 line levels: upper, middle and lower.
HLBand MT5 version is a perfect translation of HLBand MT4, it works absolutely identical to MT4 version.
Indicators Inputs
BandPeriod - the period used for calculating values of bands. PriceField - the price used for calculations, it can have two values: 0:High/Low, 1:Close/Close.

Si te gusta este proyecto, deja una revisión de 5 estrellas. Seguir en instagram: borelatech Trading grandes volúmenes requiere que veamos múltiples instrumentos/chartes a
encontrar nuevas oportunidades, este indicador le ayudará trazando
niveles por el múltiples de un número o su sufijo y actualizarlos
automáticamente
como el precio cambia, una tarea que de otro modo sería tedioso. Por ejemplo, en GBPUSD, usted podría tener 4 instancias del indicador en el
gráfico a trama: Cada intervalo
FREE

La media móvil T3 de Tillson se introdujo al mundo del análisis técnico en el artículo '' A Better Moving Average '', publicado en la revista estadounidense Technical Analysis of Stock Commodities. Desarrollada por Tim Tillson, los analistas y operadores de los mercados de futuros pronto quedaron fascinados con esta técnica que suaviza las series de precios al tiempo que disminuye el retraso (lag) típico de los sistemas de seguimiento de tendencias.
FREE

Counts the lifetime of Candle Extra until its closing.
It is used to assist in the entry of operations... ...We operate at the close of one-minute Candles, that is, when the timer is at 00:xx:01. We open an order, and the value of that operation is also displayed by the tool.
Extra: To 'unlock' the price scale. Double click on the scale and the graph will be 'horizontally centered'. In addition to allowing the expansion and contraction of the price scale, we can navigate the chart by dra

There is a very simple rule
It is Always difficult to cross high pressure areas and easy to cross low pressure areas
MT4 version is available here
This is definitely true for price
It was so simple, it was not!
So let's get started
This indicator shows you the amount of pressure in that area according to the bars that it shows. The longer the bar, the higher the pressure in that area It also marks the most pressed area with a rectangle
From now on you can simply decide on the

A lot of professional traders use high quality divergence signals as a part of their strategy to enter a position. Spotting correct divergences quickly can often be hard, especially if your eye isn’t trained for it yet. For this reason we’ve created a series of easy to use professional oscillator divergence indicators that are very customisable so you get only the signals you want to trade. We have this divergence indicator for RSI, MACD, Stochastics, CCI and OBV. RSI: https://www.mql5.com/en/

Multi Time Frame Sub Panel for MT5. Monitor multiple time frames from a single chart window.
Here are some of the options available with the MTF Moving Average: Select the timeframes to be displayed (can manually type in other TF's) Customize the amount of timeframes to be displayed Define the width (number of bars) for each timeframe box Modify all the colors Display two moving averages
MTF, MA, Multi-TF, Multiple TF, Moving Average, SubPanel, Sub-panel,

El agotamiento del rango ocurre cuando el precio alcanza o supera el rango esperado para el período actual. En estos niveles, el precio comienza a perder su impulso en relación con el período anterior, por lo que es un buen punto para asegurarse de que no está tomando nuevas posiciones. Este indicador le mostrará dónde es probable que suceda esto en su gráfico, mostrando niveles para períodos diarios, semanales y mensuales. Cuando ve que el precio supera estos niveles de agotamiento, le está dic

El rango verdadero promedio (ATR) es un indicador de uso común que mide la cantidad de movimiento en el precio durante una duración determinada. Sin embargo, el valor que da no está definido dentro de ningún tipo de límite, lo que hace que sea casi imposible usarlo para cualquier otra cosa que no sean cálculos de stop loss o take profit. Este indicador es su indicador ATR estándar, pero hemos introducido demarcaciones de percentiles para que pueda ver los extremos. Puede elegir entre percentiles
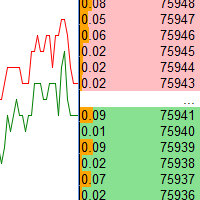
Profundidad de visualización del mercado. Se pueden mostrar hasta dieciséis instrumentos. Hay un desplazamiento automático de precios, que se puede desactivar haciendo clic en "A" en la parte superior de la ventana. Es un indicador bastante hermoso, puede actuar como una pantalla de presentación, no será tan aburrido verse como un gráfico normal, perfecto para meditar, especialmente después de grandes pérdidas en el mercado. El indicador no es para negociar, por lo que su depósito será más compl

Description This is an indicator for MT5 which has enhanced the "Fractals" indicator. "Fractals" indicator is included in MT5 by default but the draw line period is fixed at "5" and it cannot be modified. Thus I have reinvented the Fractals indicator with some useful function added. This tool will be useful especially for those who are learning how to draw good horizontal lines and wants to get some reference. Of course, those who are considering Fractals as an important horizontal line wil
FREE

A very simple indicator, but one that cannot be missed when carrying out your operations.
Fast and accurate Spreed information before entering a trade as well as the time to start another candlestick.
Spread refers to the difference between the buy (purchase) and sell (offer) price of a stock, bond or currency transaction.
Come and see our mql5 signals too. https://www.mql5.com/pt/signals/899841?source=Site +Signals+From+Author
FREE

One of the best tools for analyzing volume, Weis Wave was devised by David Weis to facilitate reading the directional flow.
For the disciples of the Wyckoff method, this means an evolution, facilitating a predictive reading of the market, always looking for Accumulation and Distribution zones for traded assets.
For better understanding, in this indicator we try to cover every reading of EFFORT (traded volume) versus RESULT (price change). Thus, you can apply the indicator on the chart twice

Volume Weighted Average Price (VWAP) is a trading benchmark commonly used by Big Players that gives the average price a Symbol has traded throughout the day. It is based on both Volume and price. This indicator contains Daily VWAP and MIDAS' VWAP, which means you are able to anchor the beggining of MIDAS' calculations and, therefore you will be able to use this methodology to study price versus volume moves after anchor point. You will be able to anchor up to 3 HIGH MIDAS VWAP's and 3 LOW.
Wis
FREE

El SSD con histograma es un indicador de forex personalizado para Metatrader 5 que muestra una línea estocástica lenta, una línea de señal y un histograma que refleja la diferencia entre la línea lenta y la línea de señal. El indicador histograma y sus elementos se muestran en una ventana separada justo debajo de su gráfico comercial principal.
parametros; k period; 5 D period; 3
marco de tiempo: m1 m5 m15 m30 h1 d1
FREE

Unlike any indicator you’ve seen, Trend Volley is an advanced purpose-built trend trading charting system that has been successfully used in nearly every tradable market. It is unique in many ways. Trend Volley’s internal trend detector algorithm studies the market and dynamically chooses the right values for the internal parameters, to adapt to the price and to decrease consecutive trend failures. It can be applied to any financial assets: forex, cryptocurrencies, metals, stocks, indices. ITS

Madx Cobra Madx Cobra Indicator. Create to traders both experienced and inexperienced to use it because it is a basic indicator
How to use : Setting Indicator 1. MA Fast : Moving Average fast (10) 2. MA Slow : Moving Average Slow control trend markets.(200) 3. ADX : Control trend(5) 4. For alert you can set to alert Next bar or instant bars.
When arrow sky blue show or arrow up, you can entry order "Buy" or "Long" and arrow red show or arrow down, you can entry order "Sell" or "Short"

A lot of professional traders use high quality divergence signals as a part of their strategy to enter a position. Spotting correct divergences quickly can often be hard, especially if your eye isn’t trained for it yet. For this reason we’ve created a series of easy to use professional oscillator divergence indicators that are very customisable so you get only the signals you want to trade. We have this divergence indicator for RSI, MACD, Stochastics, CCI and OBV. RSI: https://www.mql5.com/en/
A lot of professional traders use high quality divergence signals as a part of their strategy to enter a position. Spotting correct divergences quickly can often be hard, especially if your eye isn’t trained for it yet. For this reason we’ve created a series of easy to use professional oscillator divergence indicators that are very customisable so you get only the signals you want to trade. We have this divergence indicator for RSI, MACD, Stochastics, CCI and OBV. RSI: https://www.mql5.com/en/ma

A lot of professional traders use high quality divergence signals as a part of their strategy to enter a position. Spotting correct divergences quickly can often be hard, especially if your eye isn’t trained for it yet. For this reason we’ve created a series of easy to use professional oscillator divergence indicators that are very customisable so you get only the signals you want to trade. We have this divergence indicator for RSI, MACD, Stochastics, CCI and OBV. RSI: https://www.mql5.com/en/

A lot of professional traders use high quality divergence signals as a part of their strategy to enter a position. Spotting correct divergences quickly can often be hard, especially if your eye isn’t trained for it yet. For this reason we’ve created a series of easy to use professional oscillator divergence indicators that are very customisable so you get only the signals you want to trade. We have this divergence indicator for RSI, MACD, Stochastics, CCI and OBV. RSI: https://www.mql5.com/en/

Moving Average Crossover Scanner and Dashboard For MT5 Advanced Moving Average Scanner Moving Averages Crossover Dashboard MT4 Version of the product can be downloaded: https://www.mql5.com/en/market/product/69260 The indicator scans the market and sends signals and alerts for Moving Average crossovers, death cross and golden cross.
Crossovers are one of the main moving average ( MA ) strategies.
MA Crossover ( cut ) strategy is to apply two moving averages to a chart: one longer and one s

Simple and fast MACD oscillator with MACD and signal lines and two-color histogram.
I wasn't happy with the Meta Trader MACD oscillator as it's not immediate to read and the other ones I tried felt a bit laggy or added unneeded features on top, so I decide to make one that feels familiar to me. I hope you will find it useful!
Contact me for any issues or bugs and I will try to help the best I can.

Este indicador está diseñado para hacer que las revisiones de muchos gráficos en diferentes escalas de tiempo sean más rápidas y fáciles de hacer. Realice un seguimiento del tiempo y el precio en varios gráficos Cambiar símbolo en un gráfico y todos los demás gráficos del mismo símbolo también se cambiarán. Fácil de usar, rápido de dominar El indicador le permite identificar el precio y la hora en la que se encuentra el puntero del mouse en el gráfico actual, en todos los demás gráficos abiertos

Este es un gráfico de ticks en segundo formato. Hay soporte para OpenCL. La configuración es muy simple: puede seleccionar los días de la semana para los que se calculará el indicador: por ejemplo, para dichos instrumentos financieros, cuyas cotizaciones no se actualizan los fines de semana, debe seleccionar cualquier otro día de la semana para los días 6 y 7, pero, por ejemplo, para bitcoin, si el corredor actualiza las cotizaciones, puede especificar para el 6º día - Sábado, y para el 7º día

Indicadores fáciles para MT5
Una herramienta muy sencilla para ayudar a visualizar indicadores más fácilmente. Especialmente útil si el indicador de referencia es muy sutil o difícil de leer.
En este blog puede leer sobre los diferentes tipos de indicadores compatibles (los indicadores con búfer de color no están disponibles): Cruces de línea cero Cruces de dos líneas Activaciones de búfer Cruces de línea cero con filtro Cruces con precio (MAs) Cruces dentro del filtro
FREE

La media aritmética o la mediana se pueden utilizar para determinar la medida de la tendencia central de una serie de tiempo. Ambos métodos tienen algunas desventajas. La media aritmética se calcula mediante el indicador de media móvil simple. Es sensible a las emisiones y al ruido. La mediana se comporta de manera más estable, pero hay una pérdida de información en los límites del intervalo. Para reducir estas desventajas, se puede utilizar un filtrado de señales pseudo-mediano. Para hacer est

////////////////////////////////////////////////// // ////////////////////////////////////
Una versión mejorada del indicador de rango verdadero promedio estándar.
Esto ahora es el doble de precisión y una línea de promediado de color.
La configuración es bastante simple: debe especificar el período principal y el período promedio.
Es muy fácil entender las lecturas de este indicador, el significado es el mismo que el del rango verdadero promedio estándar.
////////////////////////////

////////////////////////////////////////////////// // ////////////////////////////////////
Este indicador muestra el rango de cambios de precio en 1 minuto. Excelente para la gestión de riesgos. Ésta es una versión mejorada del indicador de rango verdadero promedio estándar para el gráfico de ticks.
Esto ahora es el doble de precisión y una línea de promediado de color.
La configuración es bastante simple: solo necesita cambiar los colores si es necesario.
Es muy fácil entender las lect

Description
Trend Influencer is an indicator that determines the potential dynamics of the influence of trend wave movements on the market. The indicator is based on the value of moving averages corrected by the standard deviation. The indicator is displayed as a main dash-dotted moving average and a signal solid moving average. The signal moving average is colored blue or red depending on what type of trend is currently observed in the market. The indicator also draws inhibition levels - blue

Dark Sprint is an Indicator for intraday trading. This Indicator is based on Trend Following strategy, also adopting the use of the atr to determine the right volatility. We can enter in good price with this Indicator, in order to follow the strong impulse on the current instrument.
Key benefits
Easily visible sprint lines Intuitive directional arrows Automated adjustment for each timeframe and instrument Easy to use even for beginners Never repaints, never backpaints, Not Lag 100% compati

O Indicador BOPCoiote é uma releitura do indicador Balance of Power proposto por Igor Livshin em Agosto de 2001, publicado na Stocks and Commodities Magazine. Uma média móvel de 14 períodos é recomendada para gráficos diários. Embora o número de períodos possa variar dependendo da natureza do mercado e dos prazos.
O nível em que ele agrupa seus fundos e topos é considerado uma das propriedades mais importantes do indicador BOP.
Durante as tendências de alta, suas máximas frequentemente tocam

Binary MA Cross MA Cross indicator by 4Umbella
Create for traders both experienced and inexperienced to use it because it is a basic indicator
How to use : 1. MA Fast : Moving Average fast (Period 4 upto 50) 2. MA Middle : Moving Average Middle (Period 10 upto 100) 3. MA Slow : Moving Average Slow (Period 50 upto 200) to control trend markets.
and trader can be set for Apply to price (Close, Open,Low,High,Median,Typical,weightd)
For alert you can set to alert Next bar or instant bar

La tendencia le permite predecir el movimiento del precio y determinar las direcciones principales de la conclusión de las transacciones. La construcción de líneas de tendencia es posible utilizando varios métodos adecuados para el estilo de negociación del comerciante. Este indicador calcula los parámetros del movimiento de tendencia basándose en la distribución de von Mises. El uso de esta distribución permite obtener valores estables de la ecuación de tendencia. Además de calcular la tendenc

BEHOLD!!!
One of the best Breakout Indicator of all time is here. Multi Breakout Pattern looks at the preceding candles and timeframes to help you recognize the breakouts in real time.
The In-built function of supply and demand can help you evaluate your take profits and Stop losses
SEE THE SCREENSHOTS TO WITNESS SOME OF THE BEST BREAKOUTS
INPUTS
MaxBarsback: The max bars to look back
Slow length 1: Period lookback
Slow length 2: Period lookback
Slow length 3: Period lookbac
FREE
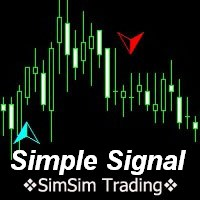
MT5 trend indicator works without redrawing. Provides signals for entering trades, works on charts of any instrument. Трендовый индикатор МТ5, работает без перерисовки. Выдает сигналы для входа в сделки, работает на графиках любого инструмента. Input parameters are for styling and messages only. / Входные параметры только для оформления и сообщений. All original signal calculations do not need additional parameters. / Все оригинальные расчеты сигнала, не нуждаются в дополнительных параметрах.
An indicator of patterns #47 and #48 ("Triangle, ascending" and "Triangle, descending") from Encyclopedia of Chart Patterns by Thomas N. Bulkowski.
Parameters: Alerts - show alert when an arrow appears Push - send a push notification when an arrow appears (requires configuration in the terminal) PeriodBars - indicator period K1 - an additional parameter that influences the accuracy of pattern shape recognition K2 - an additional parameter that influences the accuracy of pattern shape recogn
MetaTrader Market es el mejor lugar para vender los robots comerciales e indicadores técnicos.
Sólo necesita escribir un programa demandado para la plataforma MetaTrader, presentarlo de forma bonita y poner una buena descripción. Le ayudaremos publicar su producto en el Servicio Market donde millones de usuarios de MetaTrader podrán comprarlo. Así que, encárguese sólo de sus asuntos profesionales- escribir los programas para el trading automático.
Está perdiendo oportunidades comerciales:
- Aplicaciones de trading gratuitas
- 8 000+ señales para copiar
- Noticias económicas para analizar los mercados financieros
Registro
Entrada
Si no tiene cuenta de usuario, regístrese
Para iniciar sesión y usar el sitio web MQL5.com es necesario permitir el uso de Сookies.
Por favor, active este ajuste en su navegador, de lo contrario, no podrá iniciar sesión.