Ivan Stefanov / Profile
- Information
|
8+ years
experience
|
27
products
|
68
demo versions
|
|
0
jobs
|
0
signals
|
0
subscribers
|
The indicator measures the imbalance between bulls and bears over a chosen period and shows a straight line in color between the two points right on your chart. Additionally indicator's window shows how exactly the volume developed in time. ( This is a manual indicator and contains features that are may not supported by the MetaTrader current testing environment ) If the bulls have more volume than the bears, the line turns green. If the bears have more volume, it is red. The line also
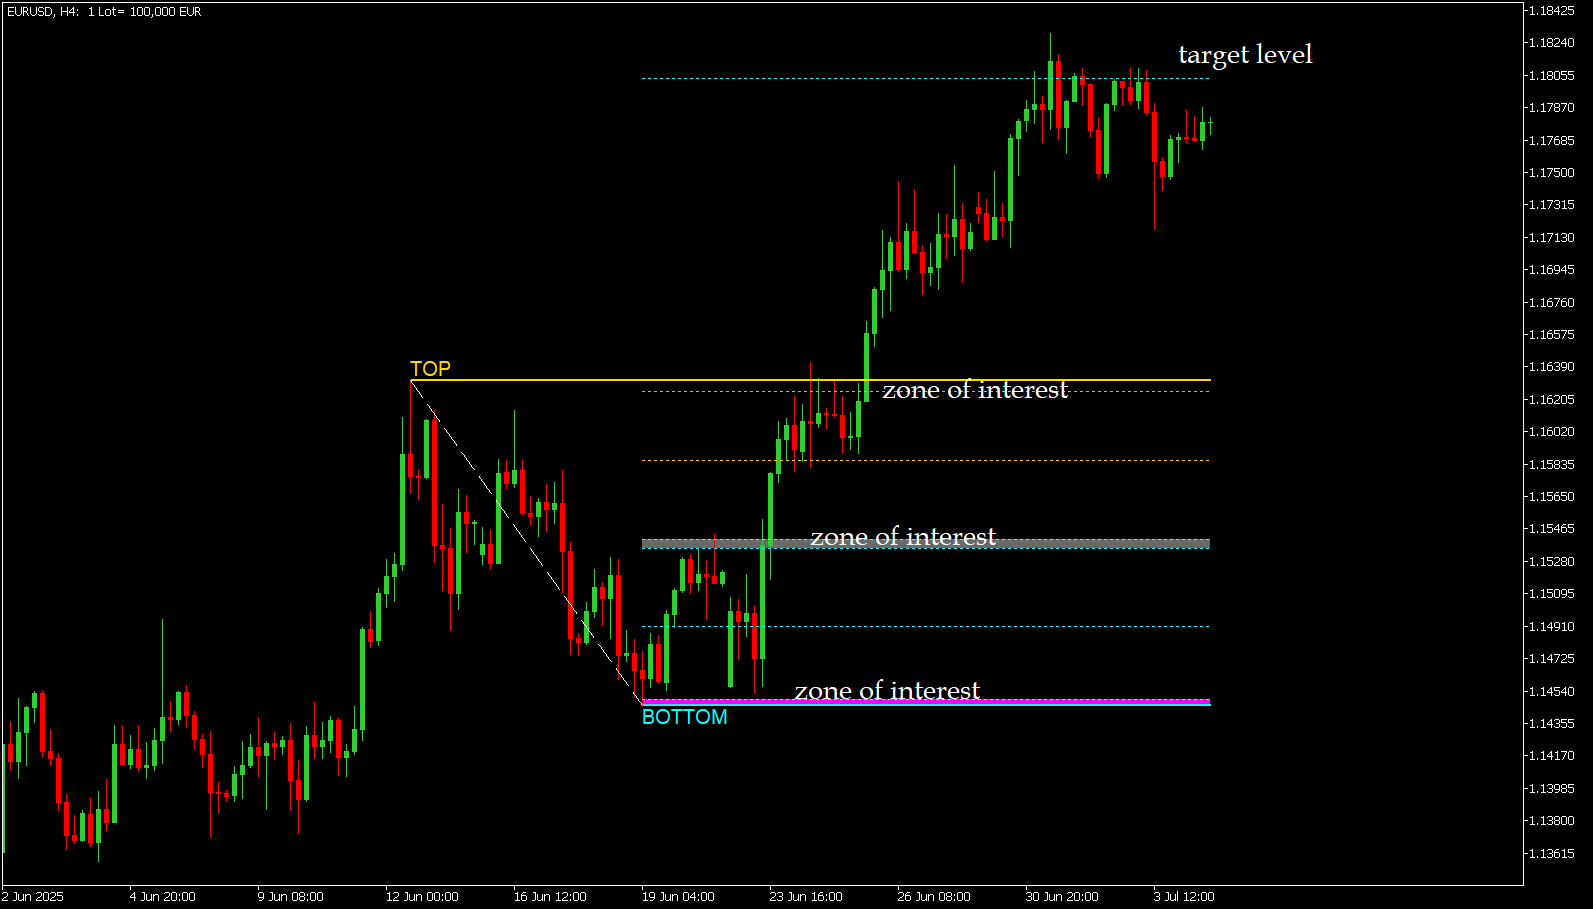
GANN Master is an MT4 indicator based on William Gann’s square root trading algorithm. (This indicator contains features that may not supported by the MetaTrader current testing environment. During the test you must press the buttons to recalculate the levels.) The indicator features three main modes: Daily – calculates levels valid for the current trading day Weekly – calculates levels valid for the current trading week Monthly – calculates levels valid for the current trading month The TOP
SENSE is an automated fusion of GANN target levels combined with fractal trend support lines. Mighty powerful combination. The system tells us where to open and close our trades. No redrawing. No more wasting time on complex calculations— SENSE does it all for you. Just insert the indicator. Key Principles: Market is bullish when price is above the white lines - Buy above the white lines, stop below - Green lines are bullish targets Market is bearish when price is below the white
The LEVELSS indicator shows: - Daily bullish and bearish zone. It is visible everyday from 00:00 to 23:59. - The weekly bullish and bearish zone. It is visible from Monday 0:00 to Friday 23:59 every week. - Specially calculated channel from a specific timeframe that is displayed on all other timeframe. By default, this is the 4-hour timeframe that you can change to whichever other timeframe you wish to trade. It is calculated non-stop. At the top left of the screen there is an
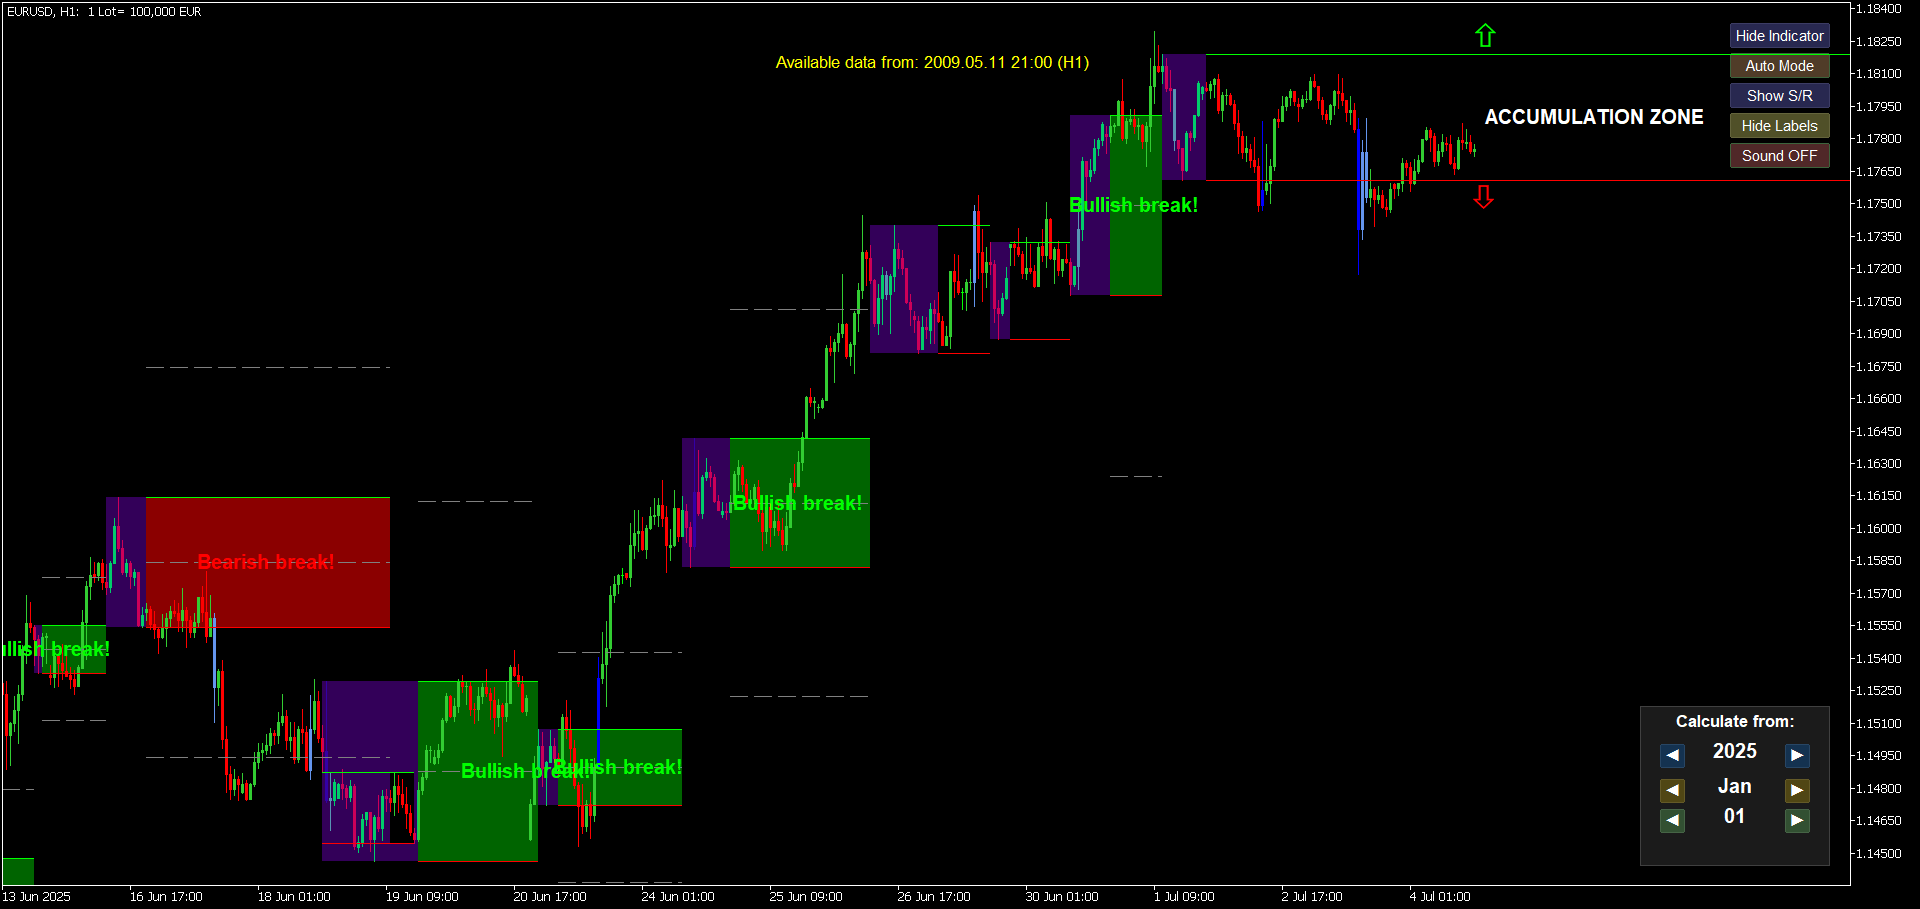
ENIGMERA: The core of the market (This is a manual indicator and contains features that may not supported by the MetaTrader current testing environment) Introduction This indicator and trading system is a remarkable approach to the financial markets . ENIGMERA uses the fractal cycles to accurately calculate support and resistance levels. It shows the authentic accumulation phase and gives direction and targets. A system that works whether we are in a trend or a correction. How It