Ivan Stefanov / Profile
- Information
|
8+ years
experience
|
25
products
|
57
demo versions
|
|
0
jobs
|
0
signals
|
0
subscribers
|

This indicator accurately identifies bullish and bearish divergences between price movements and the MACD histogram, using Exponential Moving Averages (EMA) periods of 5 (fast), 34 (slow), and a signal line period of 5. The indicator highlights points where momentum weakens, signaling potential trend reversals. Rules for Correct Divergence Identification Bullish divergence is valid when price forms lower lows and the MACD histogram simultaneously forms higher lows above the zero line
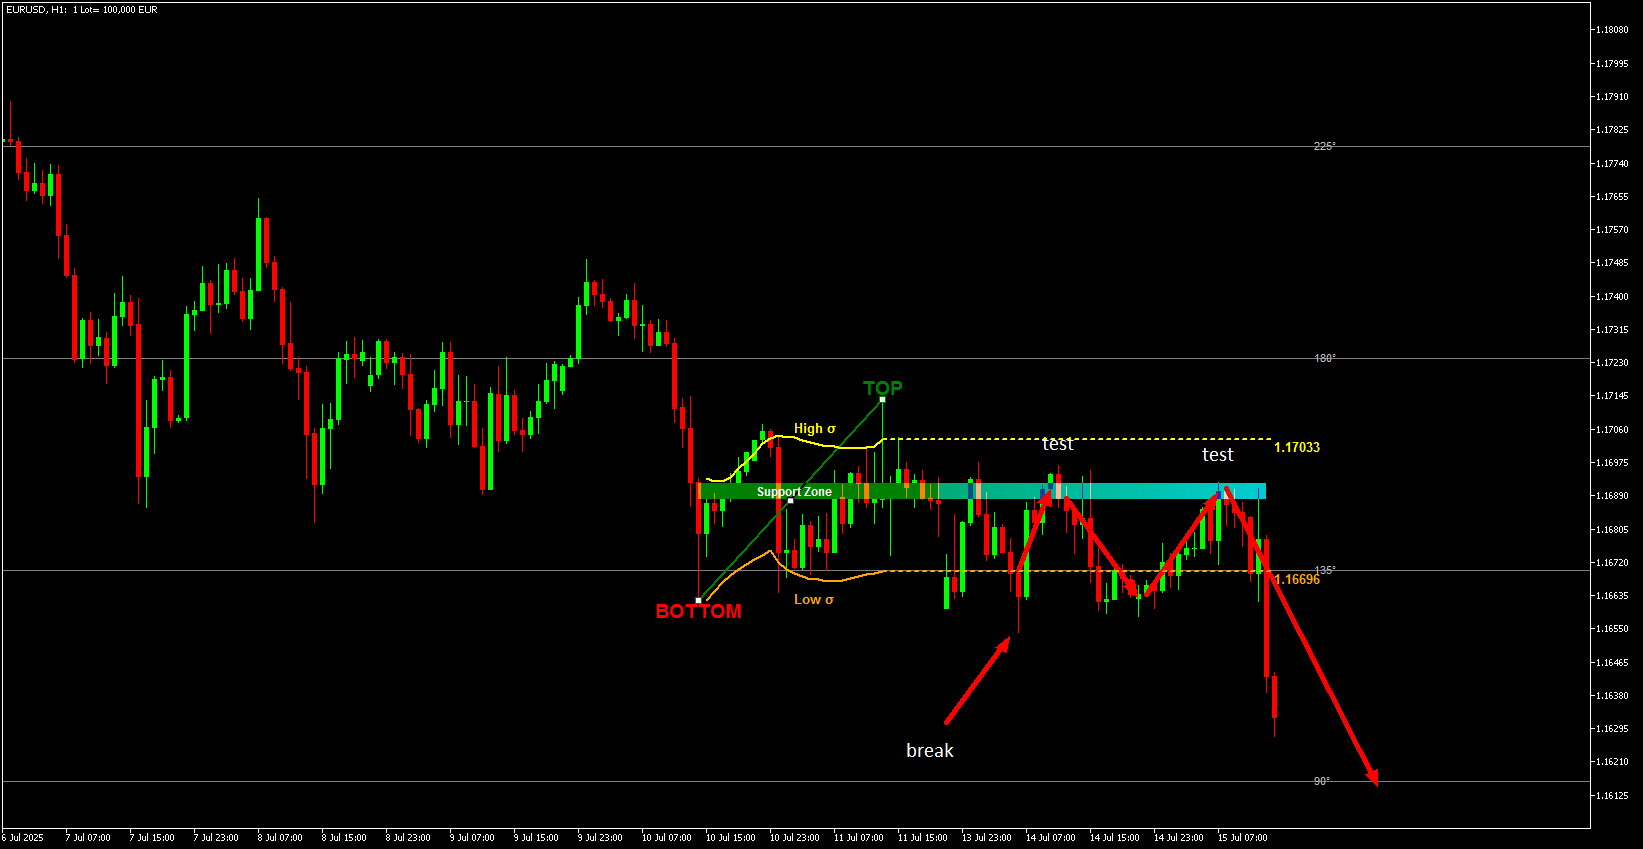
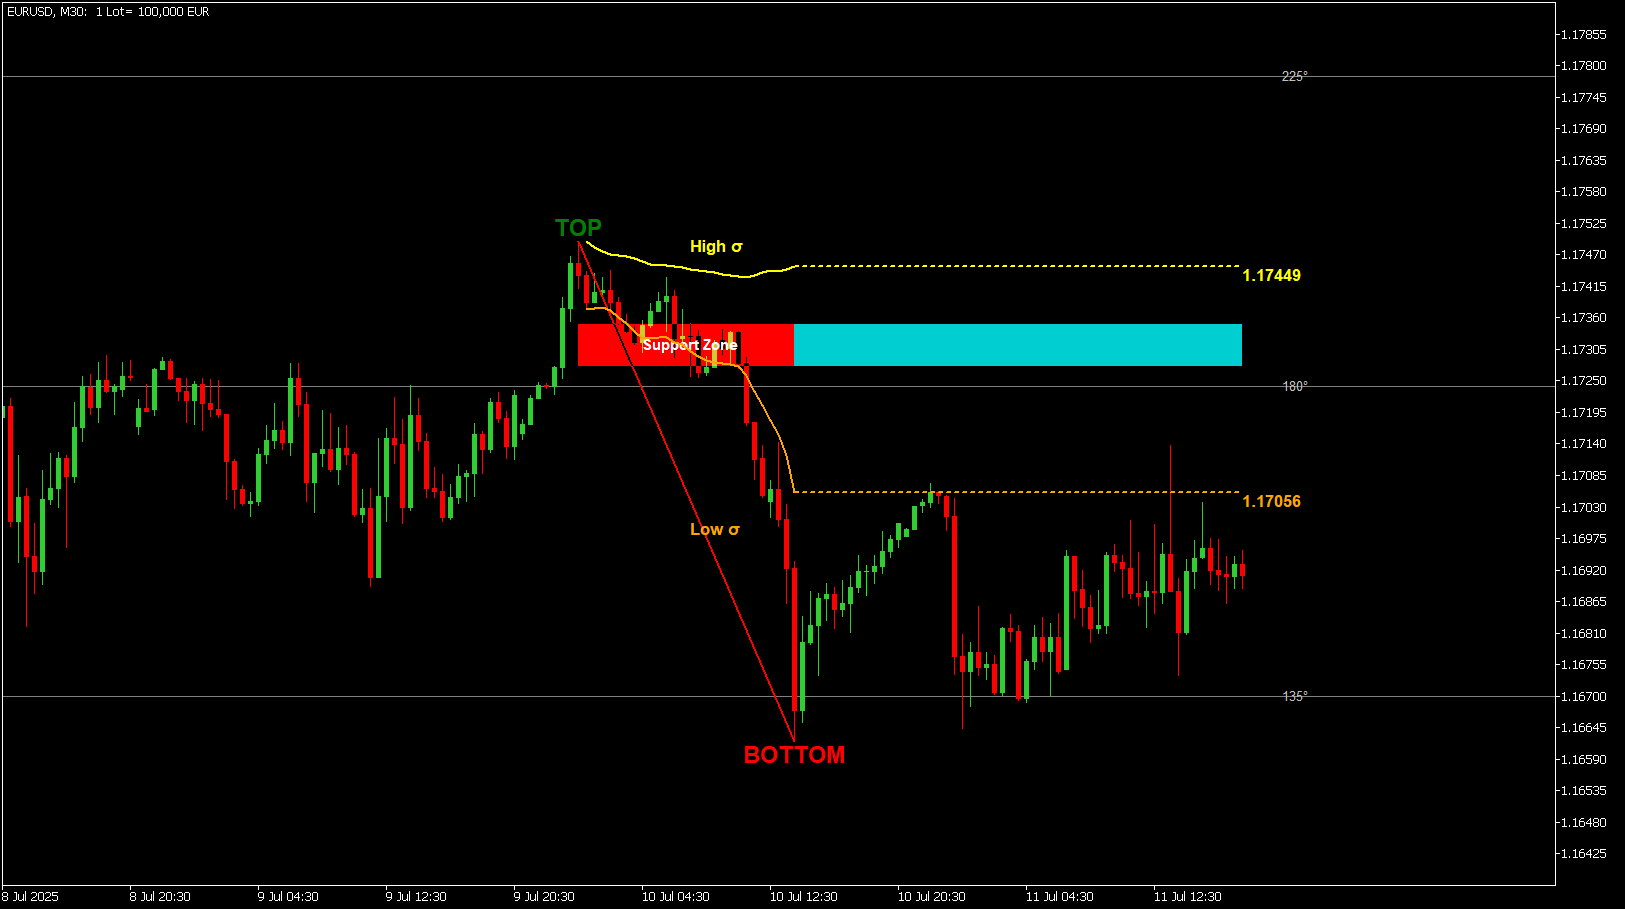
SPECULATOR is a manual trading system and indicator that helps you identify key support zones and market direction. Master the market with a simple strategy and hidden wisdom! This is a manual indicator and contains features that may not supported by the MetaTrader current testing environment . You choose any top and bottom on the chart, and the indicator draws: A support zone for your trend. For a bullish trend, a green zone appears; for a bearish trend, a red one. The support zone's
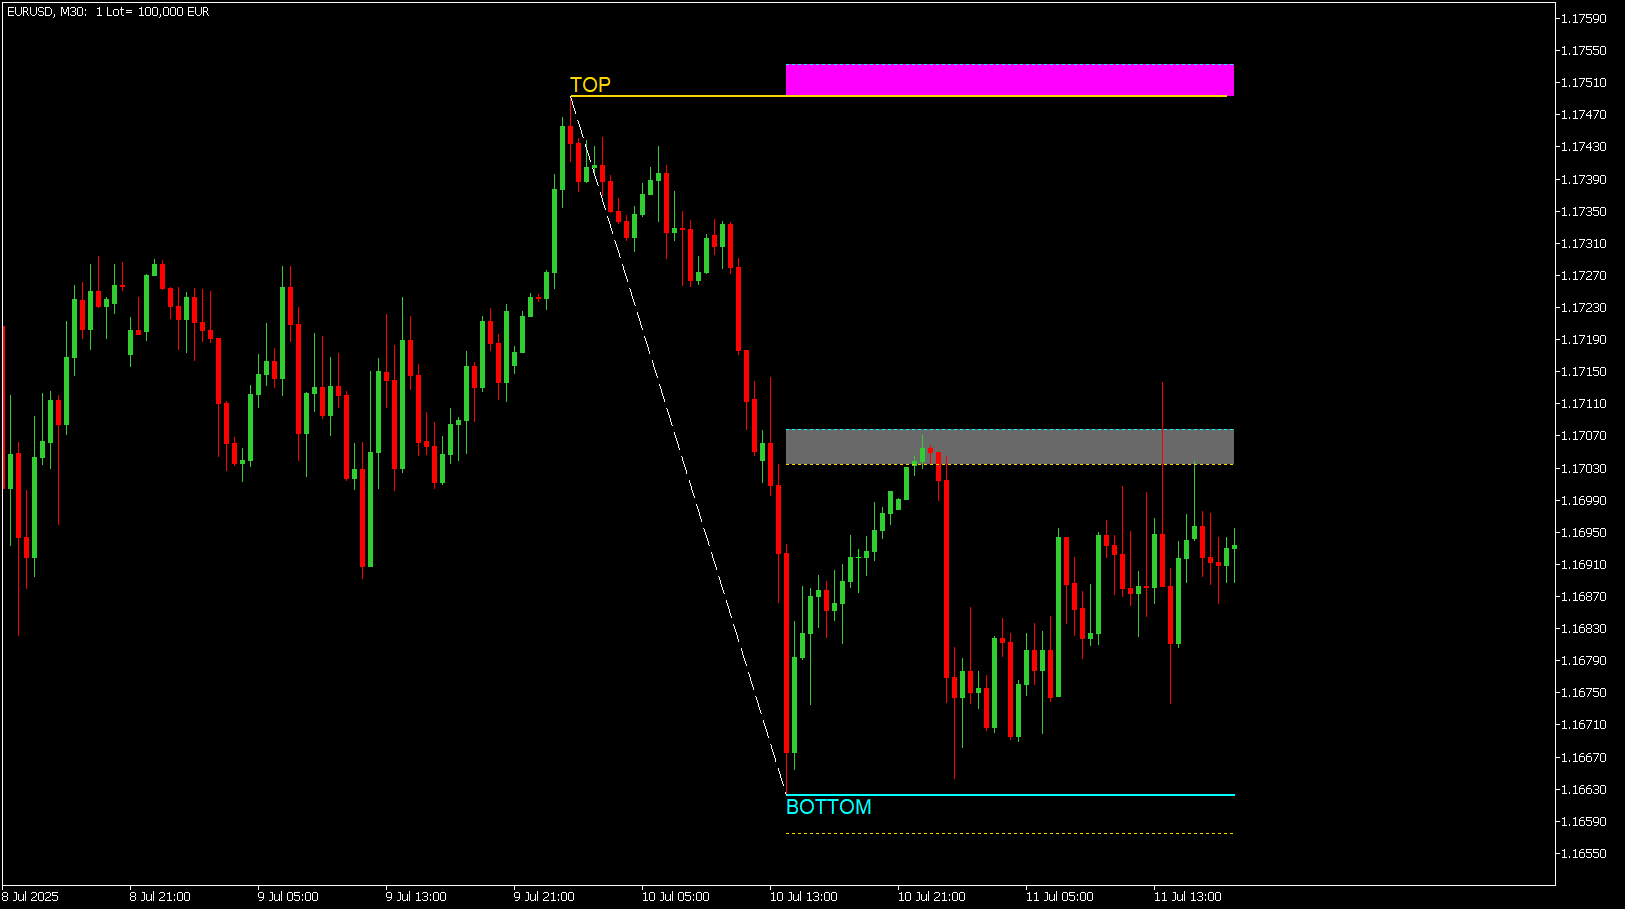
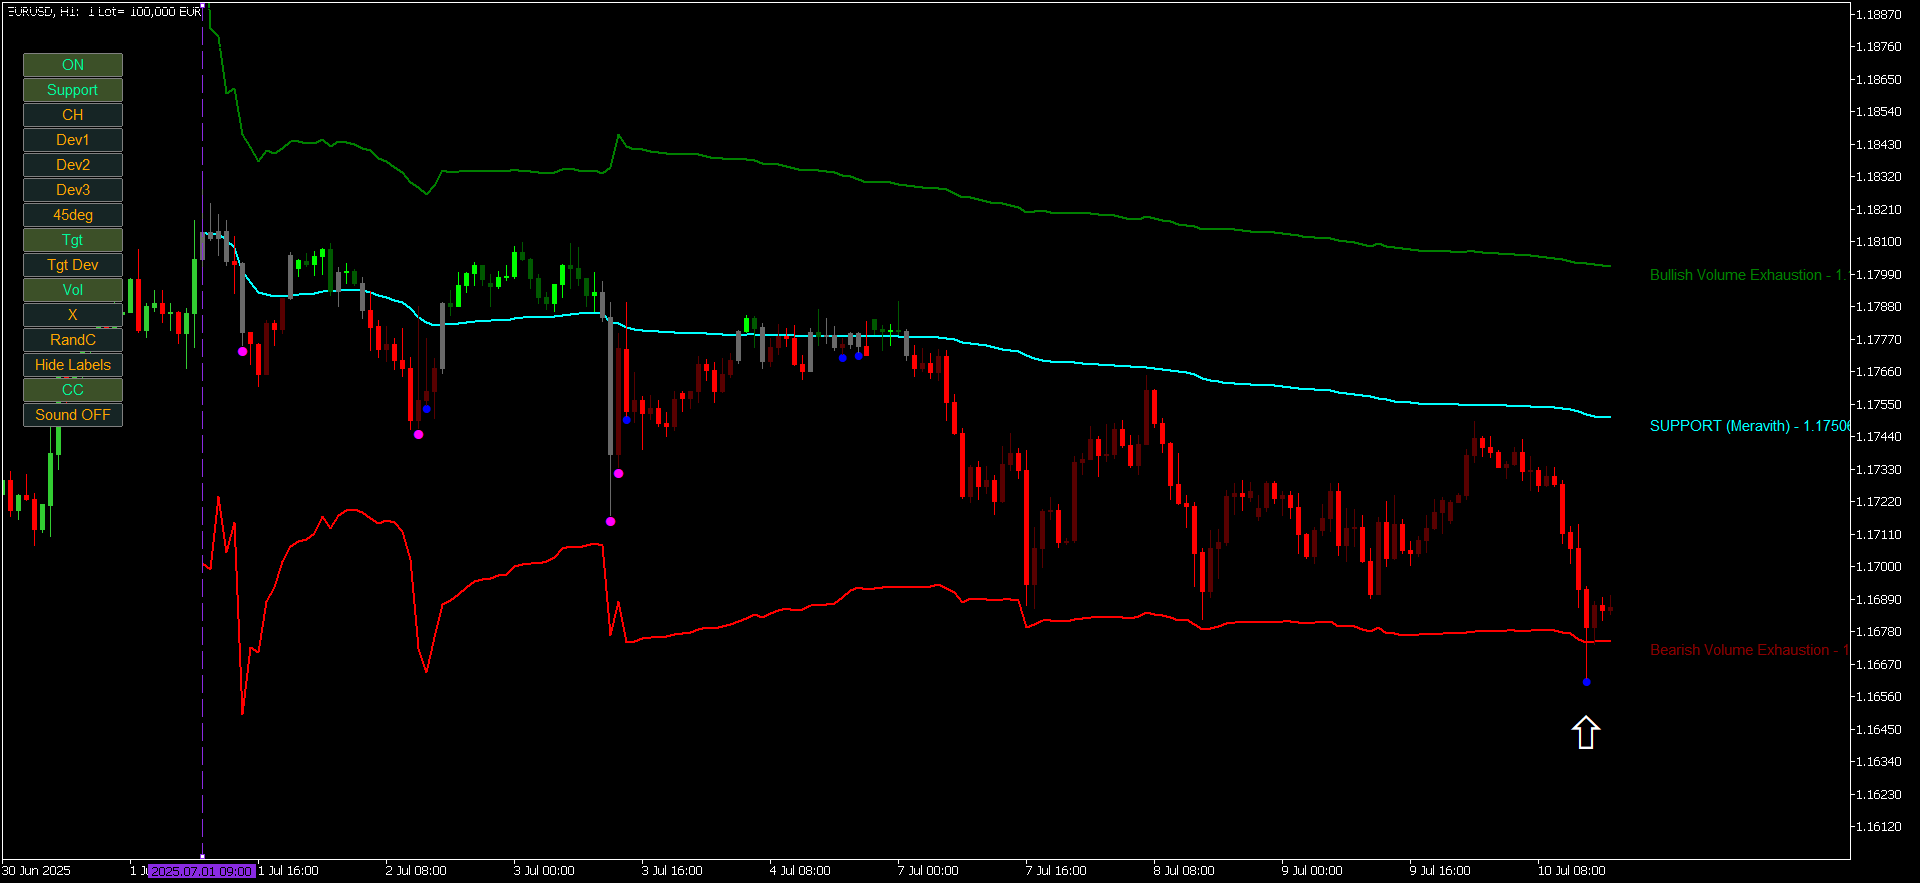
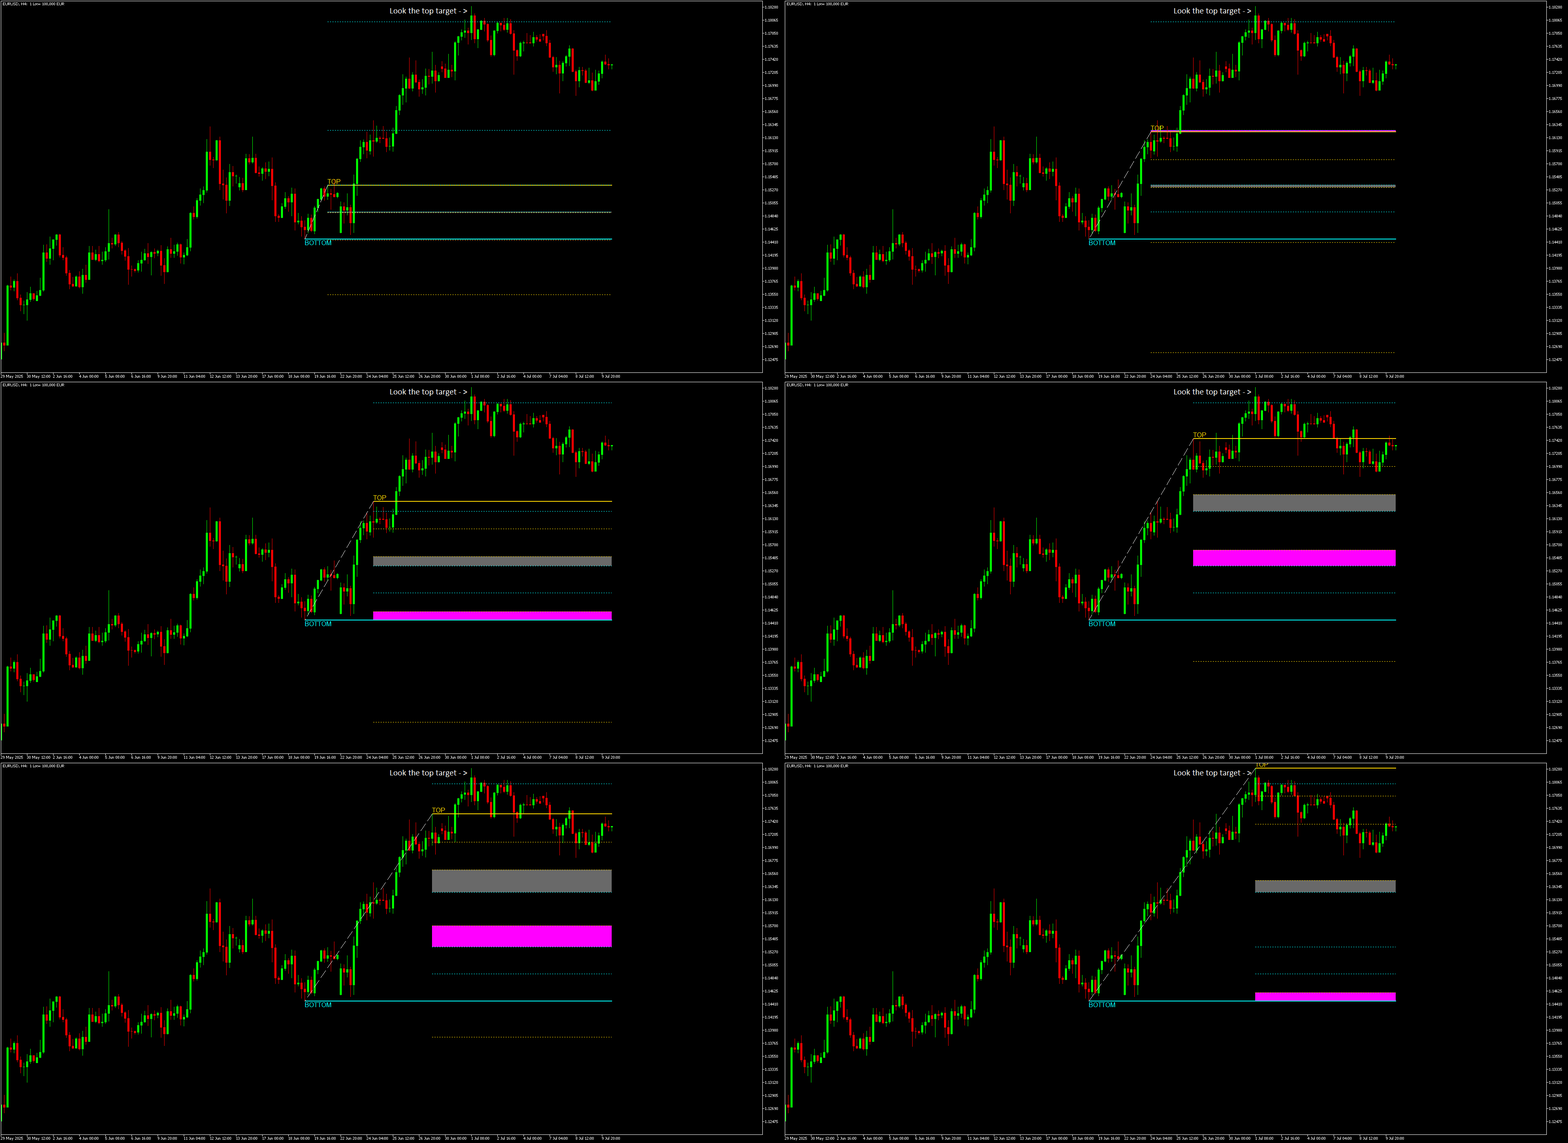
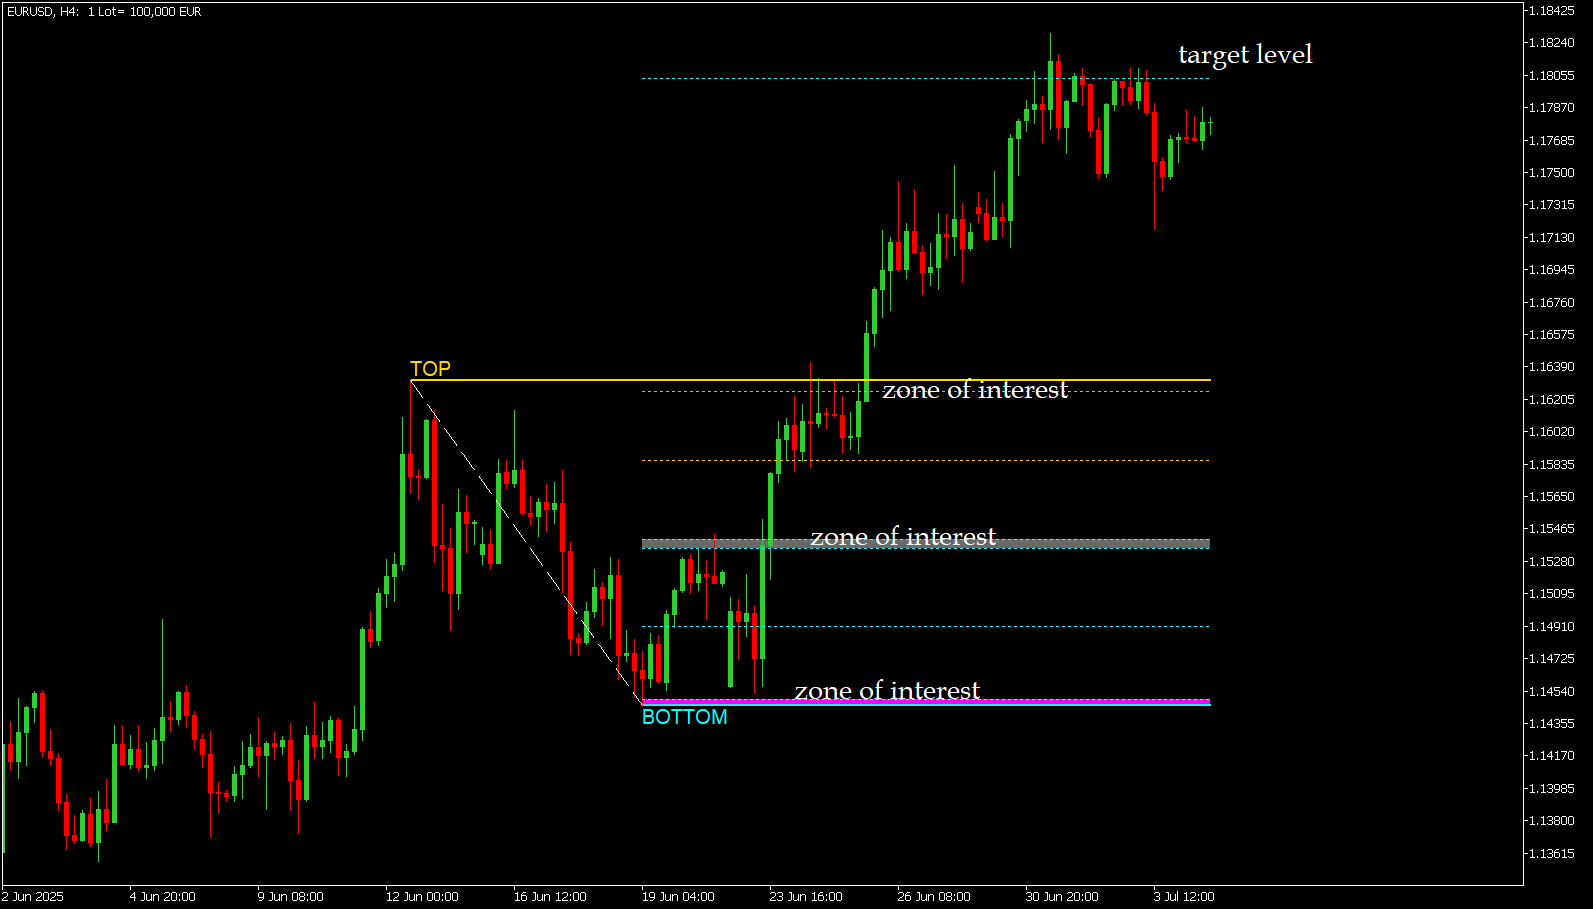
'Naturu' is a manual indicator that uses nature’s symmetry as its algorithm. Master the market with a simple strategy and hidden wisdom! ( This is a manual indicator and contains features that are not supported by the MetaTrader testing environment ) When you load the indicator, you’ll see two lines—Top and Bottom. Click once on a line to activate it. To move it, simply click on the candlestick where you want it placed. You define a high point and a low point, and the indicator then
'Naturu' is a manual indicator that uses nature’s symmetry as its algorithm. Master the market with a simple strategy and hidden wisdom! This is a manual indicator and contains features that are not supported by the MetaTrader testing environment When you load the indicator, you’ll see two lines—Top and Bottom. Click once on a line to activate it. To move it, simply click on the candlestick where you want it placed. You define a high point and a low point, and the indicator then


