|
13+ years
experience
|
86
products
|
234
demo versions
|
|
31
jobs
|
0
signals
|
0
subscribers
|
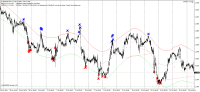
Veda http://ytg.com.ua resource - the author works for automation of trade on the forex market - advisers, experts will, trading robots, indicators, trading strategies, scripts, functions and libraries.
Provides the ability to create programs using a programming language and mql4 mql5 for trading platforms metatrader.
Provides the ability to create programs using a programming language and mql4 mql5 for trading platforms metatrader.