Forex volatility
I am not sure what you mean about volatility and how to measure it ... but there are some articles/video/indicators:
EES V Speed - indicator for MetaTrader 4"EES recommends using this indicator as a measure of volatility, and to signal an increase or decrease in volatility by watching the SMA. A cross up (when the SMA is below the V Speed line and crosses above it) of the SMA indicates a decrease in volatility and conversely, a cross down indicates an increase. The SMA values can be adjusted according to the specific pair and time frame used. V Speed can be referenced by strategies as an indication of volatility."
Forum on trading, automated trading systems and testing trading strategies
Sergey Golubev, 2014.06.07 07:43
3 Reasons Volatility Might Increase (adapted from Forbes article)
Where art thou volatility? Not here, nor there, but soon to revive, me
thinks. Volatility in risk markets is simply the measurement of
variation in prices which is often calculated over certain time periods
and against the idea of a normal distribution. The most important
markers are historical (statistical) volatility and implied volatility.
Historical volatility is a retrospective measurement of actual pricing
variations whereas implied volatility is the theoretical price of an
asset taking into account actual prices, historical volatility, a time
component and the risk free rate within a pricing model such as the
Black-Scholes model. Both historical and implied volatility have
recently declined to cycle lows in many asset classes. The consensus
call is for continued calm waters and a potential further decrease in
volatility. The consensus call for tame volatility may be
underestimating three potential drivers to higher volatility this year:
rising inflation and Federal Reserve policy, a taper tantrum and
geopolitical unknowns.
The most popular measure of market volatility in the US is the CBOE
Market Volatility Index (the “VIX”) which is also known rather ominously
as the “fear gauge.” The VIX measures a weighted average of the
implied volatility of a wide range of S&P 500 options with a 30 day
maturity. Quite simply, the VIX is the implied volatility of the
S&P 500 and is frequently thought of as the market’s broad
expectation of volatility over the next 30 day period. The VIX has been
on a downward trajectory since 2010.
The VIX has an audience across asset classes as it can give insight into
the short term biases and leanings of US equity market participants.
To be clear, the VIX is one tool to measure perceived volatility and
although a high VIX or an upward trend is most often the result of a
declining equity market, the gauge can increase as well when call
holders refuse to sell options absent a larger premium. Thus, the VIX
can be a measure of upside or downside moves with higher numbers
representing the anticipation of sharper moves. Somewhat ironically,
there are many instances where higher VIX prices correlate strongly to
higher prices in the S&P 500 as the fear dissipates and markets
readjust.
The VIX and other measurements of volatility have continued to trend
down for many reasons including the fact that the world’s central banks
have maintained highly accommodative monetary policies. The European
Central Bank has just announced a program of direct asset purchases
including the cessation of the “sterilization” of their current markets
program. Moreover, secondary central banks like the Bank of Mexico have
cut rates in an effort to spur higher inflation. Assuming a direct
correlation between liquidity and volatility, all of these programs
should act as a governor to higher volatility. Other reasons offered to
explain the calmness in markets include exceedingly low trading volumes,
range bound markets, recently improving economic data and fewer
economic surprises, the transparency of corporate reporting, and the
perception that there is no immediate catalyst to drive volatility
higher.
Although the trend in volatility is clearly downwards, current
complacency should not be mistaken for a permanent drift to lower levels
without significant bumps higher and mini-reversals within the trends.
Once again, investors are putting their faith into central banks which
are doing the one thing that they ostensibly know how to do and have
done continuously since 2008 – providing ever increasing amounts of
liquidity. To be sure, the ultimate effect of non-traditional monetary
policy is unknown and the Federal Reserve and the Bank of England are
poised to withdraw some of their stimulus in the medium term. Already,
markets are pricing in rate hikes in the US for mid-2015 yet doing so
without increased volatility. It is reasonable to suggest that the
greatest risk to increased volatility and general market stability may
be a mismatch between Federal Reserve policies, the expectations of the
bond market and microeconomic data. This triumvirate of fast friends
may find itself in an increasingly uncomfortable alliance should US
inflation data significantly or unexpectedly increase. Admittedly,
higher US inflation in a world currently exporting deflation to US
shores is not likely to result in the sustained kind. However, the
prospect of Chair Yellen attempting to explain away asymmetric inflation
readings as transitory should push up volatility in the bond market.
There is also sensibility in remembering that monetary policy changes
frequently take longer to translate to market prices than assumed. It is
quite possible that the lingering effects of central bank liquidity
will not be felt as a primary cause of higher volatility but rather a
second derivative premised upon some otherwise routine market upheaval.
When long positions are longer and short positions are shorter, based
upon liquidity rather than fundamentals, the correlation between
liquidity and volatility cited as calming the markets may cut both ways.
Increased liquidity may provide for smooth markets at the outset but
higher levels of risk may creep upon casually disciplined risk managers
and with it the miasma of higher volatility.
Another reason that volatility could creep higher is the possibility of a
“taper tantrum” over the final end of Quantitative Easing. As an
analogue one need only to look at the increase in volatility as measured
by the VIX after QE2 ended in June of 2011.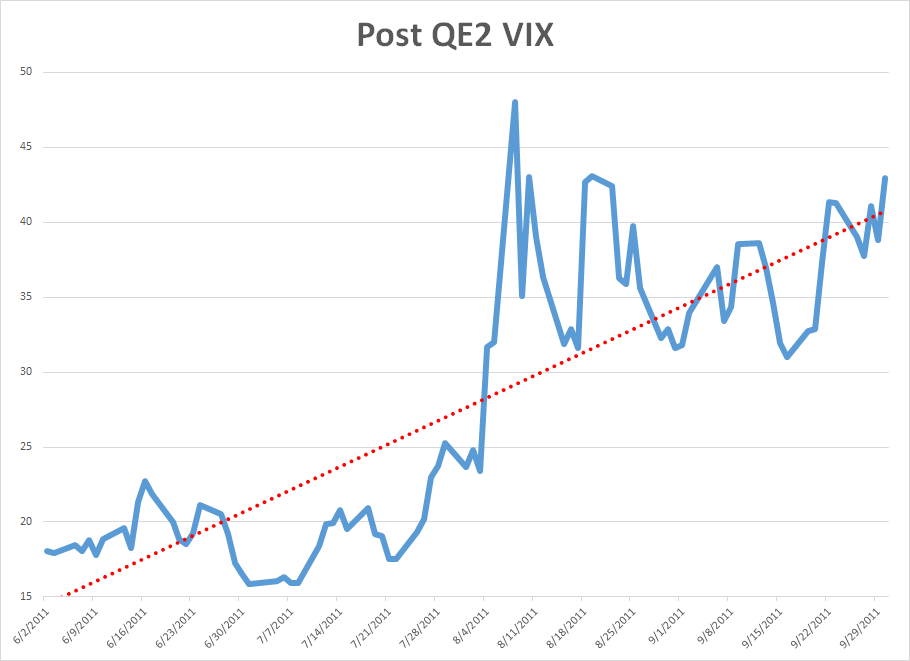
The Federal Reserve’s “stock versus flow” argument will be put to the
ultimate test assuming tapering continues apace and QE ends toward the
end of 2014.
Volatility may also temporarily and dramatically increase due to
unexpected geopolitical events. There is a mini civil war in Ukraine
right now and it threatens to draw European powers into supporting a
proxy contest for Eastern Ukraine between Russia and the West. While
Europeans go about deciding where to holiday this summer, the conflict
in Ukraine is likely to remain in a sort of pressure cooked stasis. Once
the weather turns cold and natural gas for heating is no longer an
abstraction the conflict in Ukraine will either resolve quickly or find
another gear. Beyond Ukraine, nuclear negotiations with Iran continue to
simmer, China and Japan yap at each other and Assad kills off his
critics in Syria. Any of these issue may cause a spike in volatility and
to expect all of these issues to transpire exactly as a game planned
seems rather naïve.
It is true that volatility has decreased. The CBOE Commitments of
Traders Report for VIX futures shows a significant net long position for
financial players confirming the bias to groupthink towards
increasingly lower volatility. This tendency towards anticipating ever
decreasing or steadily low volatility flies in the face of the fact that
the VIX currently trades at a 45% discount to its longer term
historical price average of $20. The odds of a temporary spike in
volatility are very good over the remainder of the year and a reversal
to slightly higher trend volatility is especially plausible should
microeconomic conditions warrant even a slight rethink of monetary
policy scenarios. To profit from volatility, is usually to buy it when
it is not needed, rather than when the consensus theory is
“unexpectedly” being pilloried and volatility is exploding higher.
The Bollinger Bands were created by John Bollinger in the late 1980s.
Bollinger studied moving averages and experimented with a new envelope
(channel) indicator. This study was one of the first to measure
volatility as a dynamic movement. This tool provides a relative
definition of price highs/lows in terms of upper and lower bands.
The
Bollinger Bands are comprised of three smooth lines. The middle line is
the simple moving average, normally set as a period of 20 (number of
bar/ticks in a given time period), and is used as a base to create
upper/lower bands. The upper band is the middle band added to the given
deviation multiplied by a given period moving average. The lower band is
the middle band subtracted by the given deviation multiplied by a given
period moving averages.
What can we use this for?
- Trend -- When price moves outside of the bands, it is believed that the current trend will continue.
- Volatility- The band will expand/contract as the price movement becomes more volatile/or becomes bound into tight trading patterns, respectively.
- Determine Oversold/Overbought Conditions -- When price continues to hit upper band, the price is deemed overbought (may suggest sell). When price continues to hit lower band, the price is deemed oversold (may suggest buy).
In today's lesson we are going to talk about another method which Dr. Van K Tharp talks about in his book Trade Your Way to Financial Freedom, the % Volatility Model for position sizing.
As we have discussed in our previous lesson on the Average True Range, Volatility is basically how much the price of a financial instrument fluctuates over a given time period. Just as the Average True Range, the indicator that was designed to represent average volatility in an instrument over a specified time, can be referenced when determining where to place your stop, it can also be used to determine how large or small a position you should trade in a given financial instrument.
To help understand how this works lets take another look at the example we used in our last lesson on the % Risk Model for position sizing, but this time determine our position size using the % Volatility Model for position sizing.
The first step in determining what your position size will be using the % Volatility Model is specifying what % of your total trading equity you will allow the volatility as represented by the ATR to represent. For this example we will say that we will allow Daily Volatility as represented by the ATR to account for a maximum of a 2% loss of trading capital.
If you remember from the example used in our last lesson we had $100,000 in trading capital and we are looking to sell crude oil which in that example was trading at $90 a barrel. After pulling up a chart of crude oil and adding the ATR you see that the current ATR for Crude is $2.55. As you may also remember from our last lesson a 1 point or 1 cent move in Crude equals $10 per contract. So with this in mind that volatility in dollars per contract for crude equals $10X255 which is $2550.
So as 2% of our trading capital that we are willing to risk on a volatility basis equals $2000 under this model we cannot put a position on in this instance and would have to pass up the trade.
As Dr. Van Tharp states in his book, the advantage of this model is that
it standardizes the performance of a portfolio by volatility or in
other words does not allow financial instruments with a higher
volatility to have a greater affect on performance than financial
instruments with a lower volatility and vice versa.
Volatility - indicator for MetaTrader 5
"A volatility indicator displays the amount of the corridor price movements for N period in points."
Chaikin Volatility (CHV) - indicator for MetaTrader 5
Forum on trading, automated trading systems and testing trading strategies
Indicators: Chaikin Volatility (CHV)
Sergey Golubev, 2013.10.29 16:26
========
Introduction
In 1966, stockbroker Marc Chaikin commenced his career on Wall Street. Successful and bright, he started to look into technical analysis as an alternative to fundamental research. He was the one that came up with several financial indicators that nowadays took his name. Now famous, the Chaikin Oscillator, the Chaikin Accumulation/Distribution indicator, the Chaikin Persistence of Money Flow indicator and the Chaikin Volatility indicator are used by traders across the world to analyze and forecast market movements.
Essential assumptions
The Chaikin Volatility Indicator (CVI) is helpful in determining the value extent
between high and low prices on a certain period of time. It measures the volatility
of a market which means it shows the predictability percentage of that market. Different
from the Average True Range, the CVI does not take into considerations the trading
gaps.
In general, Chaikin Volatility Indicator is used in conjunction with a moving average
system and on a given period of time, commonly 10 days.
Trading Signals
In trading, the Chaikin Volatility indicator is used to quantify the degree of certitude
about the next market progression. Calculated as the percent change in a moving
average of the high versus low price over a given time, the CVI may forecast a market
top and a bottom. As the indicator increases in value, the market is highly volatile
(uncertain, variable) and it could predict a market bottom. Contrarily, as the CVI
decreases and it ranges a narrow band, the market is said to be less volatile, more
secure and prone to reach a top. A market bottom is reached when prices vary a lot
from a short time period to another (hours, days) and people become anxious and
begin to sell securities. The market top is a secure and flourishing moment with
high prices (or a price explosion expected), also which follows a bull market and
is determined over a longer time period by the high CVI.
As the Chaikin Volatility indicator measures the instability of the stock market, its high values indicates that prices are changing fast and a lot during the day. Prices are constant when the indicator has low values. Basically, the flatter the CVI line on a graph, the more constant and secure the prices are.
A graphed market time period may have level prices or trendy prices. When a market is choppy, prices are variable and the market is insecure and contrarily, a trendy market tends to have an explosion/implosion of prices, following a trend – going up, or down. Both trendy and choppy markets can have high or low volatility on a certain time period, hence the 10 day generally used interval. This way, traders can better observe the true volatility of the market.
Sometimes, elevated volatility values are used in forecasting a trend reversal, such as a turning point in the market. Volatility peaks and abysses determine market tops and bottoms, points after which a new trend begins, be it upwards or downwards. Consequently, inferior volatility levels may be used to reflect the beginning of an upward price trend, which usually happens after a market consolidation period.
ConclusionAlthough some traders believe that markets movements are random, there are several mathematical rules that apply. Stockbroker Marc Chaikin has used simple mathematics to find financial indicators that are helpful in forecasting market trends. With the Chaikin Volatility Indicator, traders everywhere may input data in a facile formula to calculate and estimate when markets reach tops and bottoms. The CVI is calculated by the recurrence of price movements (high vs. low) on a time period. As the indicator rises, so does the market volatility (can be triggered by massive security sales) which in turn triggers a chain reaction followed by a bear market, that in the end leads to a market bottom; as the CVI decreases and its line flattens, the market loses volatility and becomes more secure, ergo prices begin to increase, which consequently create a bull market, that usually leads to a market top.
And if you are the coder so it may be the good article about:
MQL5 Cookbook: Developing a Multi-Symbol Volatility Indicator in MQL5I am not sure what you mean about volatility and how to measure it ... but there are some articles/video/indicators:
EES V Speed - indicator for MetaTrader 4"EES recommends using this indicator as a measure of volatility, and to signal an increase or decrease in volatility by watching the SMA. A cross up (when the SMA is below the V Speed line and crosses above it) of the SMA indicates a decrease in volatility and conversely, a cross down indicates an increase. The SMA values can be adjusted according to the specific pair and time frame used. V Speed can be referenced by strategies as an indication of volatility."
Hi,
maybe measure it with standard deviation etc.
I would like to see a measurement for volatility and a comparison to other currency pairs.
Currently, over the past candles and maybe with a forecast.
Chaikin Oscillator Colored Area - indicator for MetaTrader 5

Indicator iChaikin Oscillator (Chaikin Oscillator, CHO) made in the style of drawing DRAW_FILLING
- Free trading apps
- Over 8,000 signals for copying
- Economic news for exploring financial markets
You agree to website policy and terms of use
Hi,
where can I find statistics and forecasts for volatility of all currency pairs?
Thank you.
Regards.