What Indicators Would You Use To Predict The Next daily Candle?
What Indicators Would You Use To Predict The Next daily Candle?
no one can predict the next price ... next candle or next profit or loss :D
about forecasting.
1. i-DRProjections_v.0.1 indicator.
This indicator shows the support and resistance of/for current day forecasting on the base of previous day.
All the calculation is based on Thomas R. DeMark book "New Science of Technical Analysis".
2. DailyLevels indicator: support/resistence for previous day + max/min/middle daily according to Paramon system.
3. Calculation the future day indicator.
Based on Neal T. Weintraub 'The Weintraub Daytrader'. The full description are inside the code as small article (in Russian sorry).
As I understand it is forecasting of the support and resistance for the next day.
I personally used DailyLevels and Calculation the future day indicators for the long time. Those indicators are showing forecasting together with 'backtesting' - means: we can compare past forecasting with real data. I wanted to use both indicators to make forecasting (to create some page or to make some service for example).
Those 3 indicators are for MT4 platform. besides, I am not sure about 5 digit brokers' fixing sorry because I did not use them for the long time.
It may be good if someone can convert them to MT5 because indicators are really great.
Indicators are attached.
")
- votes: 10
- 2010.01.26
- MetaQuotes Software Corp.
- www.mql5.com
Yes, i agree with you. Forex is not predictable.
What Indicators Would You Use To Predict The Next daily Candle?
But we all are predicting anyway, right?
For example - trading. By any signal indicator (asctrend, silvertrend, braintrend, 2 ema crossing etc) - we are openning the order on the next bar based on something which was happened in past for example.
And overbough/oversold? This is prediction. Not by values but ... at least by direction.
Well. Some people call it techinical Analysis (which we all are doing before openning any order in Metatrader).
But it is the prediction.
When I decide to open sell order based on some indicators which are showing me the picture of something about "which was happened 1 bar ago, or 10 bars ago" so it is forecasting.
The problem is the following:
we do not have any reliable predictable tool other than technical analysis.
That is the power of analysis. We may not guess nex candle stick. But to be a successful trader, one should have skill to predict the trend of concurned currency pair.
Just about prediction (technical analysis).
As an example.
This is USDCHF, H4 timeframe (Metatrader 5).
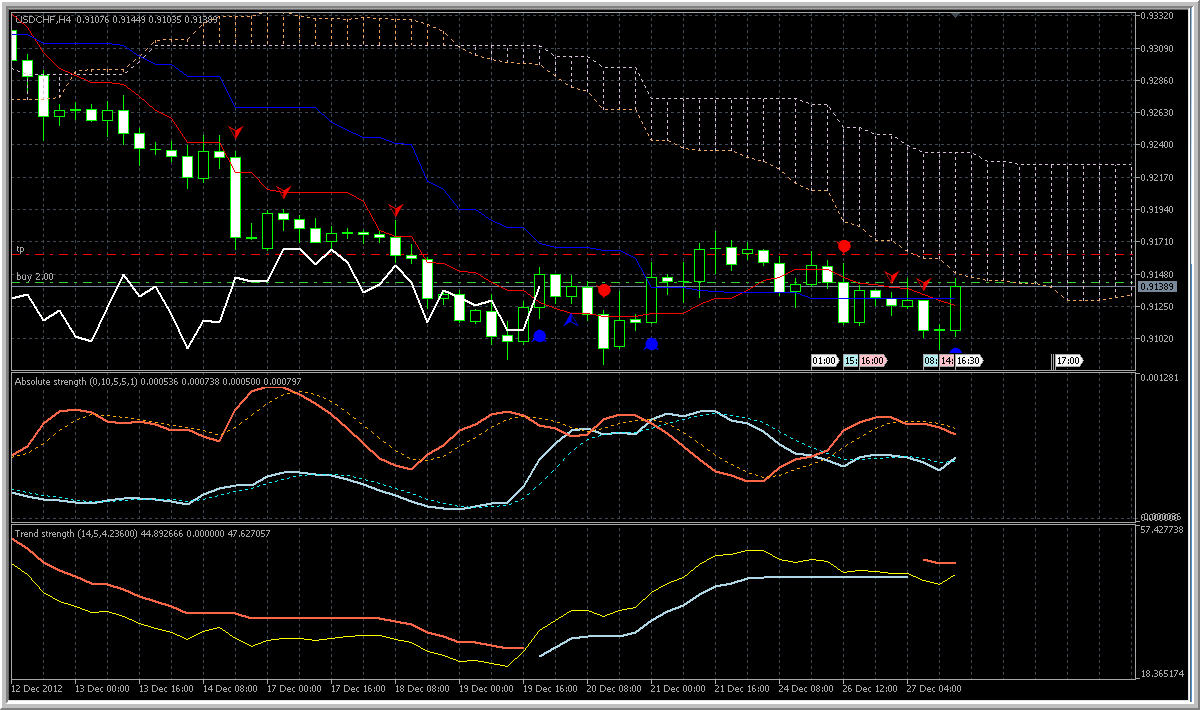
- primary trend?
bearish
- secondary trend?
correction
- what will be happened in the near future?
flat, breakout, or bearish will be continuing.
- when we can expect breakout?
when the price will break 0.9142 resistance line and Chinlou Span line (white color) will cross the price on closed bar.
- it will be breakout as secondary trend?
yes, it will be bearish anyway
:)
So, technical analysis is the forecasting.
Just about prediction (technical analysis).
As an example.
This is USDCHF, H4 timeframe (Metatrader 5).
- primary trend?
bearish
- secondary trend?
correction
- what will be happened in the near future?
flat, breakout, or bearish will be continuing.
- when we can expect breakout?
when the price will break 0.9142 resistance line and Chinlou Span line (white color) will cross the price on closed bar.
- it will be breakout as secondary trend?
yes, it will be bearish anyway
:)
So, technical analysis is the forecasting.
- Free trading apps
- Over 8,000 signals for copying
- Economic news for exploring financial markets
You agree to website policy and terms of use