Forecast for Q2'16 - levels for Hang Seng Index (HSI)
Forecast for Tomorrow - levels for Hang Seng Index
Hang Seng Index (HSI): bullish breakout. The price (H4 timeframe) is on bullish breakout which was started in the beginning of the last week: price broke key resistance levels on the way from Senkan Sen line to 21548 resistance level which seems to be 'top' level for now. So, there are 3 scenarios for the price movement for the week:
- bullish breakout to be continuing in case the price breaks 21,548 resistance level to above on close H4 bar, or
- secondary correction with possible bearish reversal will be started in case the price breaks 20,893 support to below, or
- bullish ranging within the levels.
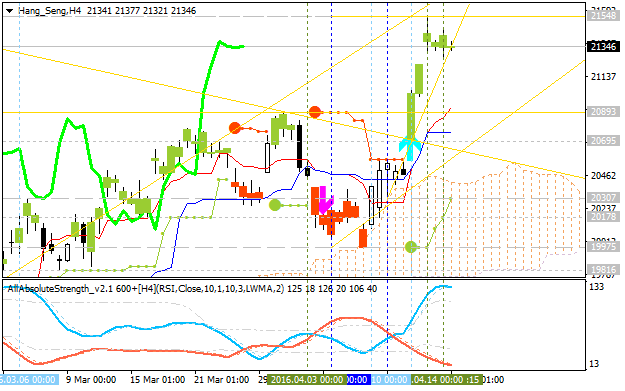
Chinkou
Span line is located above the price for the bullish ranging condition
to be started, and Absolute Strength indicator is estimating the ranging
condition in the near future as well.
- if the price breaks 21,548 resistance so the bullish breakout will be continuing;
- if the price breaks 20,893 support level so the secondary correction within the primary bullish condition will be started;
- if not so the price will be moved within the channel.
| Resistance | Support |
|---|---|
| 21,548 | 20,893 |
| N/A | 20,307 |
Hang Seng Index Technical Analysis 2016, 24.04 - 01.05: bullish ranging within new narrow s/r levels
Daily price is on bullish market condition located above Ichimoku cloud: the price is ranging within narrow support/resistance levels for the bullish trend to be continuing or for the secondary correction to be started. There are the folllwing key s/r levels:
- 21,666 key resistance level located far above Ichimoku cloud in the primary bullish area of the chart,
- 21,025 key support level located in the beginning of the secondary correction to be started, and
- 20,128 key support level located in the beginning of the primary bearish area of the chart.
If D1 price will break 21,025
support level on close bar so the local downtrend as the secondary correction within the primary bullish trend will be started.
If D1 price will break 20,128
support level on close bar so we may see the reversal of the price movement from the primary bullish to the ranging bearish market condition.
If D1 price will break 21,666
resistance level on close bar so the bullish trend will be continuing without ranging.
If not so the price will be on ranging within the levels.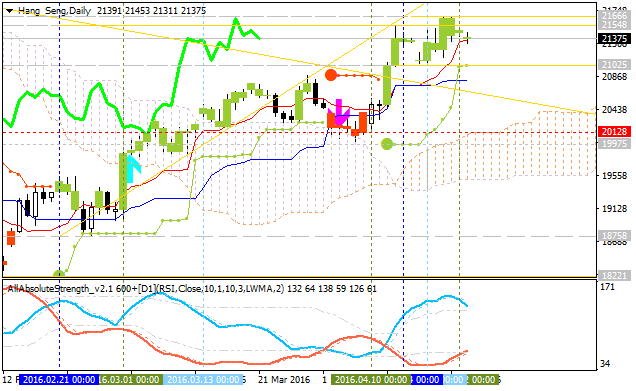
- Recommendation for long: watch close D1 price to break 21,666 for possible buy trade
- Recommendation
to go short: watch D1 price to break 20,128 support level for possible sell trade
- Trading Summary: ranging bullish
| Resistance | Support |
|---|---|
| 21,666 | 21,025 |
| N/A | 20,128 |
SUMMARY : bullish
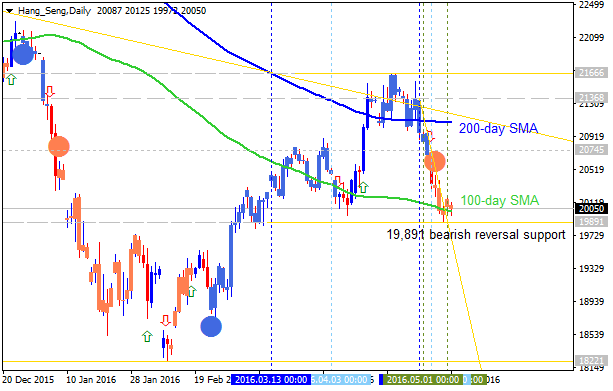
Quick Technical Overview - Hang Seng Index: ranging near 200-day SMA waiting for direction of the trend
Daily price is on bullish ranging near 200-day SMA 'reversal' level waiting for direction:
- the price is on ranging within 200 SMA and 100 SMA;
- if the resistance level at 21,666 will be broken by the price to above so the primary bullish trend will be continuing without secondary ranging;
- if support level at 19,975 is going to be broken by the price to below so the reversal of the price movement from the ranging bullish to the primary bearish market condition will be started;
- RSI indicator is estimating the ranging condition to be continuing in the near future;
- nearest support levels are 19,975 and 18,964;
- nearest resistance levels are 21,666 and 23,350.

| Resistance | Support |
|---|---|
| 21,666 | 19,975 |
| 23,350 | 18,964 |
- if daily price
breaks 21,666 resistance so the primary bullish trend will be continuing without secondary ranging;
- if daily price breaks 19,975 support level so
the reversal of the price movement from the ranging bullish to the primary bearish market condition will be started;
- if not so the price will be moved within the levels.
Forum on trading, automated trading systems and testing trading strategies
Something Interesting in Financial Video May 2016
Sergey Golubev, 2016.05.02 14:41
What is The Hang Seng Index?
The Hang Seng is the most widely quoted barometer for the Hong Kong
economy. Because of Hong Kong's status as a special administrative
region of China, there are close ties between the two economies and many
Chinese companies listed on the Hong Kong Exchange.
The Hang Seng
Index is maintained by a subsidiary of Hang Seng Bank, and has been
published since 1969. The index aims to capture the leadership of the
Hong Kong exchange, and covers approximately 65% of its total market
capitalization. The Hang Seng members are also classified into one of
four sub-indexes based on the main lines of business including commerce
and industry, finance, utilities and properties.
Hang Seng Index Technical Analysis: key support level at 19,891 to be broken for the bearish reversal
Daily price is located below 200-day SMA for the 100-day SMA crossing to below with the 19,891 level to be broken for the bearish reversal to be started without ranging.
- If price will break 19,891 support so the bearish reversal will be started without the secondary ranging.
- If not so the price will be ranging within the levels.
| Resistance | Support |
|---|---|
| 21,368 | 19,891 |
| 21,666 | 18,221 |
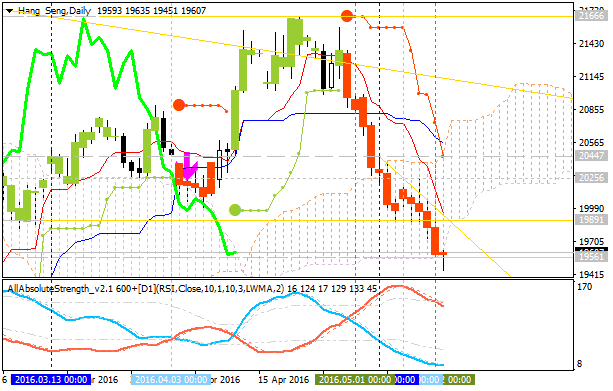
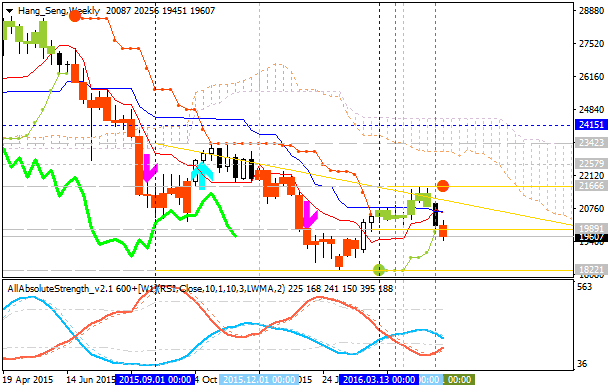
Hang Seng Index Technical Analysis 2016, 15.05 - 22.05: bearish ranging breakdown
Daily price is on breakdown with bearish reversal: the price broke Ichimoku cloud to below for the reversal of the price movement from the primary bullish to the primary bearish market condition. The price is testing 19,561 support level for the bearish breakdown to be continuing.
- Absolute Strength indicator is estimating the ranging bearish condition by direction.
- Chinkou Span line is indicating the bearish breakdown to be continuing in the near future.
- Descending triangle pattern was fomrd by the price to be crossed for the bearish trend.
Weekly price is on bearish condition located below Ichimoku cloud and Senkou Span line which is the virtual border between the primary bearish and the primary bullish trend on the chart. The price is on ranging within 21,666 'bullish reversal' resistance and 18,221 'bearish continuation' support levels waiting for direction of the trend.
If D1 price will break 19,561
support level on close bar so the bearish breakdown will be continuing up to 18,221 as the next target.
If D1 price will break 20,447
resistance level on close bar from below to above so the reversal of the price movement
from the primary bearish to the ranging bullish condition will be
started.
If not so the price will be on ranging within the levels.
| Resistance | Support |
|---|---|
| 20,447 | 19,561 |
| 21,666 | 18,221 |
SUMMARY : ranging breakdown
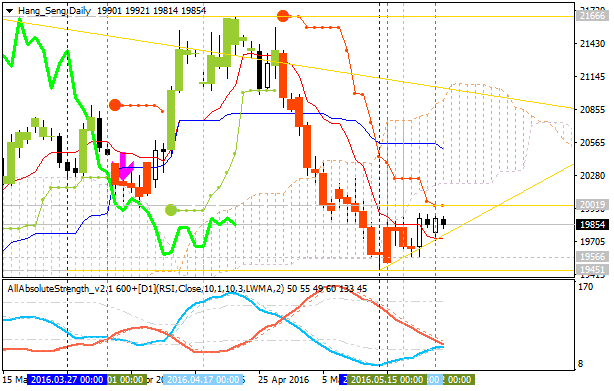
Hang Seng Index Technical Analysis 2016, 22.05 - 29.05: bearish ranging within narrow s/r levels waiting for breakdown or breakout
Daily price
is on bearish market condition located to be below Ichimoku cloud and Senkou Span line which is the virtual border between the primary bearish and the primary bullish trend on the chart. The price is ranging within narrow support/resistance levels waiting for breakdown or breakout of the price movement for direction of the trend to be established. Ascending triangle pattern was fomred by the price to be crossed to above for the secondary rally to be started, and Absolute Strength indicator is estimating the ranging condition to be continuing with possible bear market rally in the near future.
If D1 price will break 19,451
support level on close bar so the bearish trend will be continuing up to the next bearish target.
If D1 price will break 20,019
resistance level on close bar from below to above so the local uptrend as the bear market rally will be started with the good possibility to the bullish reversal in the secondary ranging way.
If not so the price will be on ranging within the levels.
| Resistance | Support |
|---|---|
| 20,019 | 19,566 |
| 21,666 | 19,451 |
SUMMARY : ranging
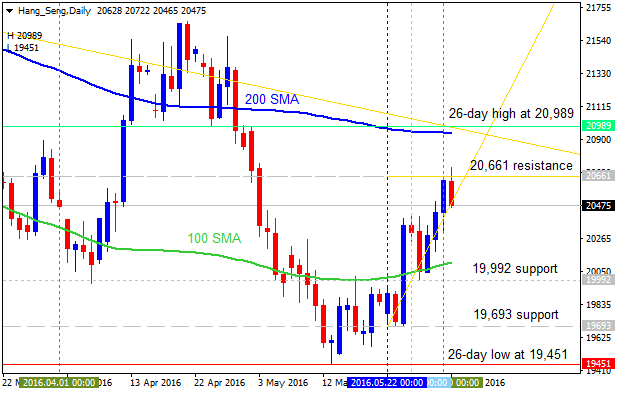
Hang Seng Index Technical Analysis 2016,
29.05 - 05.06: daily bearish with ranging near bullish reversal level
Daily price is located within 100 SMA/200 SMA reversal area and below 200-day SMA for the ranging bearish market condition. The price is on ranging within the following support/resistance levels:
- 26-day high at 20,989 located near 200 SMA on the border between the ranging bearish and the primary bullish trend on the chart, and
- 26-day low at 19,451 located far below 200 SMA in the primary bearish area.
The price is trying to break ascending triangle pattern together with 20,661 resistance to above for the 26-day high at 20,989 as the next target. Alterbative, if the price breaks 19,992 support and 19,693 support to beow so the primary bearish trend will be continuing with 26-day low at 19,451 as the target.
If D1 price will break 19,451
support level on close bar so the bearish trend will be continuing.
If D1 price will break 20,989
resistance level
on close bar from below to above so the reversal of the price movement from the ranging berarish to the primary bullish trend will be started.
If not so the price will be on bearish ranging within the levels.
| Resistance | Support |
|---|---|
| 20,661 | 19,992 |
| 20,989 | 19,693 |
| N/A | 19,451 |
SUMMARY : ranging
Hang Seng Index Technical Analysis 2016, 05.06 - 12.06: one-month high at 20,837 to be broken for the daily bullish reversal
Daily price is located within 100 SMA/200 SMA reversal area and below 200-day SMA for the ranging bearish market condition. The price is on ranging within the following support/resistance levels:
- one-month high at 20,837 located near below 200 SMA on the border between the ranging bearish and the primary bullish trend on the chart, and
- support level at 20,045 located below 200 SMA and near 100 SMA on the border between the ranging bearish and the primary bearish area.
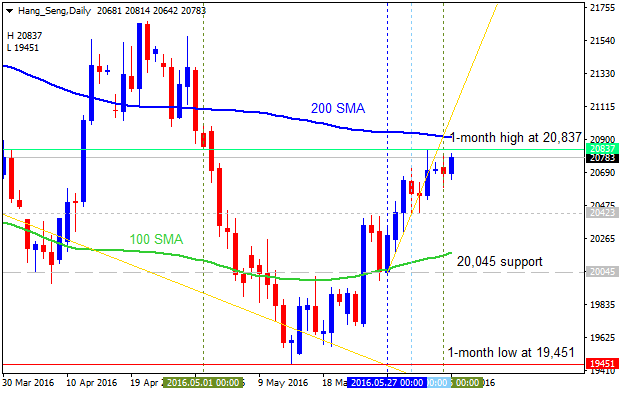
If D1 price will break 20,045
support level on close bar so the bearish trend will be continuing without secondary ranging up to one-month low at 19,451 target.
If D1 price will break 20,837
resistance level
on close bar from below to above so the reversal of the price movement
from the ranging berarish to the primary bullish trend will be started.
If not so the price will be on bearish ranging within the levels.
| Resistance | Support |
|---|---|
| 20,837 | 20,045 |
| N/A | 19,451 |
SUMMARY : ranging
Hang Seng Index Technical Analysis 2016, 12.06 - 19.06: daily breakdown with the bearish reversal
Daily price
is breaking Ichimoku cloud to be reversed from the primary bullish to the primary bearish market condition: the price is testing 20,289 support level to below for the bearish breakdown to be continuing.
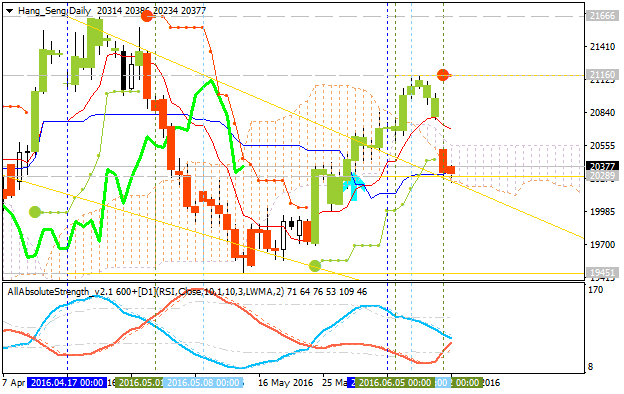
If D1 price will break 20,289
support level on close bar so the breakdown will be continuing with the bearish reversal to be started.
If D1 price will break 20.559
resistance level
on close bar from below to above so the bullish trend will be resumed.
If not so the price will be on bearish ranging within the levels.
| Resistance | Support |
|---|---|
| 20.559 | 20,289 |
| 21.160 | 19,451 |
SUMMARY : breakdown
- Free trading apps
- Over 8,000 signals for copying
- Economic news for exploring financial markets
You agree to website policy and terms of use
Hang Seng Index Technical Analysis 2016, 10.04 - 17.04: ranging within narrow reversal levels for direction
Daily price is located near SMA with period 100 (100 SMA) and below SMA with the period 200 (200 SMA) for the ranging within the narrow key reversed levels:
RSI indicator is estinating the possible bullish reversal in the future.
SUMMARY : ranging
TREND : waiting for reversal