Forecast for Q2'16 - levels for GOLD (XAU/USD) - page 2
You are missing trading opportunities:
- Free trading apps
- Over 8,000 signals for copying
- Economic news for exploring financial markets
Registration
Log in
You agree to website policy and terms of use
If you do not have an account, please register
Forum on trading, automated trading systems and testing trading strategies
Press review
Sergey Golubev, 2016.05.28 15:43
Fundamental Weekly Forecasts for Dollar Index, GBP/USD, USD/JPY, AUD/USD, USD/CAD and GOLD (based on the article)
GOLD (XAU/USD) - "Interim resistance stands at the 1242/46 with our bearish invalidation level at 1256. A rally surpassing the upper median-line parallel (~1270) would be needed to shift the broader focus back to the long-side. A break lower targets subsequent support objectives at the 1191 pivot & the 50% retracement of the advance off the December lows at 1175."Daily price is on secondary correction within the primary bullish market condition: the price is breaking 1207.86 support level together with 100-day SMA to below for the correction to be continuing with 1163.09 bearish reversal target.
If the price breaks 1163.09 support to below on close daily bar so the reversal of the price movement from the primary bullish to the primary bearish market condition will be started.
If the price breaks 1303.69 resistance to above so the primary bullish trend will be continuing.
If not so the price will be on bullish ranging within the levels.
Forum on trading, automated trading systems and testing trading strategies
Press review
Sergey Golubev, 2016.06.04 12:06
Fundamental Weekly Forecasts for Dollar Index, EUR/USD, GBP/USD, USD/JPY, AUD/USD, and GOLD (based on the article)
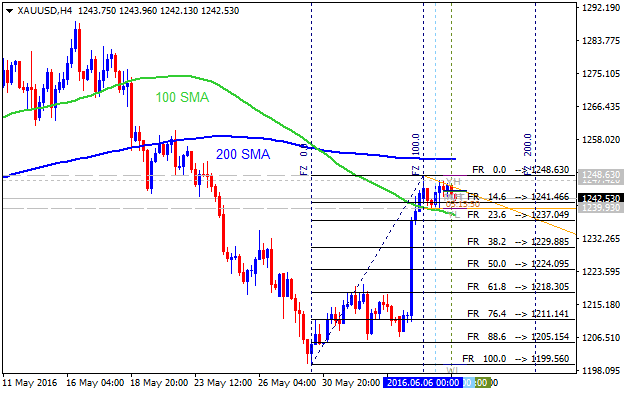
GOLD (XAU/USD) - "Heading into next week, the near-term focus remains higher while above Friday’s low. Initial resistance is eyed at 1250 where the 50% retracement of the May decline converges on basic trendline resistance off the yearly high. A breach here would suggest a more meaningful reversal is underway with subsequent topside objectives eyed at the upper median-line parallel, currently around ~1270/71. Note that daily RSI is approaching a resistance trigger and if compromised, would further reinforce the topside near-term outlook. Bottom line: looking for a pullback to stretch into an exhaustion high next week- likely to offer favorable short entries."Daily price is located above 200 SMA for the bullish market condition: the price was bounced from 1206.70 support level and 2-month low at 1199.56 to above for the bullish continuation target at 1252.17.
If the price breaks 1252.17 resistance to above on daily close bar so the primary bullish trend will be continuing with 2-month high as a possible target at 1303.69.If the price breaks 2-month low at 1199.56 to below on close bar so the bearish reversal of the price movement may be started.
If not so the price will be on ranging bullish within 2-month high/low levels
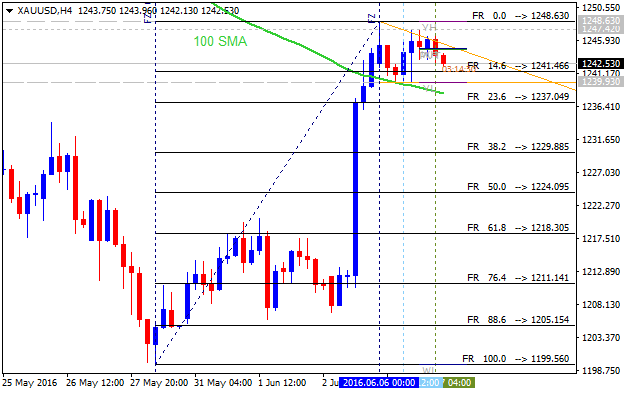
H4 price is located near and below 200 SMA for the secondary market rally within the primary bearish market condition. The price is located within the following key s/r level:
If the price breaks 1256.03 resistance to above on H4 close bar so the bullish reversal will be started.
If the price breaks 1199.56 support level to below on close H4 bar so the primary bearish trend will be continuing.
If not so the price will be on ranging bearish condition.
Forum on trading, automated trading systems and testing trading strategies
Press review
Sergey Golubev, 2016.06.07 07:51
Gold Prices Recovery Friday’s NFP report: daily bullish resumed; intra-day rally to the bullish reversal (based on the article)
"We looked at the precipitous fall in Gold prices on the back of a more hawkish Federal Reserve that spent much of the month of May talking up the prospect of higher rates in the United States. This prospect of higher rates was a huge change-of-pace for markets, which had built-in the expectation for the Fed to be extremely dovish after the risk-aversion that put up sizeable moves at the beginning of the year. And that inferred dovishness was hugely helpful to Gold prices, along with Equities and Commodities, as global markets appeared to be operating under the assumption that the Fed would do what they’ve been doing for the past six years by being dovish and passive with extremely loose monetary policy."
"But that about-face in May brought on a huge change of pace to the US Dollar, and this had an enormous impact on Gold prices. After tagging the $1,301 resistance level in the early portion of the month, Gold prices fell all the way back to the $1,200.41 Fibonacci level, which is the 61.8% retracement of the 45-year move in Gold prices, taking the 1968 low of $34.95 to the 2011 high at $1,920.80. Coming into June, Gold was continuing to dwindle near support at $1,207.69, which is the 38.2% retracement of the most recent major move."
"Friday’s NFP report provided a dose of cold water to those June rate hike expectations, as an abysmal print gave the appearance of a weaker US economy than initially hoped, and this brought in a significant bout of USD-weakness across the currency spectrum. Gold caught a significant bid, rallying all the way into a prior zone of support at $1,245.83, which is also the 23.6% retracement of the most recent major move, taking the January 2015 high to the December 2015 low. Since running into that resistance, price action has built-in to a box formation on the 4-hour chart, and this can be used to further help traders looking to set up the short-side position. Traders can look for a quick break of near-term price action support to denote down-side continuation potential. Should this break take place, traders can then begin to look to trigger the short position by looking for a price action reversal at resistance around current support of ~ $1,240."
Forum on trading, automated trading systems and testing trading strategies
Press review
Sergey Golubev, 2016.06.11 10:11
Fundamental Weekly Forecasts for Dollar Index, NZD/USD, GBP/USD, USD/CAD, USD/CNH, USD/JPY, AUD/USD and GOLD (based on the article)
GOLD (XAU/USD) - "On the back of last month’s dismal Non-Farm Payroll report, expectations for the timing of Fed normalization have been pushed out with markets now pricing in the first rate hike to be in February of 2017. If the Fed projections are adjusted to reflect market expectations, look for the repricing to remain supportive of gold prices as concerns about domestic growth, a material slowdown in China and the upcoming UK referendum continue to set a high bar for the possibility off Fed tightening."GOLD (XAU/USD) Technical Analysis - daily bullish trend to be resumed after ranging with 3-month high at 1303.69 as a target
Daily price is located above SMA with period 100 (100 SMA) and SMA with the period 200 (200 SMA) for the bullish market condition: the price is breaking 1288.67 resistance level to above for the bullish trend to be continuing with 3-month high at 1303.69 as the next bullish target. Alternative, of the price breaks 1234.74 support level to below so the local doantrend as the secondary correction within the primary bullish trend will be started with 3-month low at 1181.44 as the next target for the daily bearish reversal.
SUMMARY : bullish
Forum on trading, automated trading systems and testing trading strategies
Press review
Sergey Golubev, 2016.06.18 11:52
Fundamental Weekly Forecasts for Dollar Index, GBP/USD, USD/CAD, USD/JPY, AUD/USD and GOLD (based on the article)
GOLD (XAU/USD) - "Looking ahead, traders will be fixated on the upcoming UK referendum as well as the semi-annual Humphry Hawkins testimony with Fed Chair Janet Yellen. On the back of this week’s rate decision, Yellen’s testimony before the Senate Banking Committee on Tuesday and the House Financial Services Committee on Wednesday will be closely scrutinized as market participants attempt to ascertain both the timing and scope for Fed normalization amid the ongoing “uncertainty” she so passionately expressed on Wednesday. All eyes will be on the Brexit decision next Thursday and gold will likely see some serious volatility should voters choose to leave the EU."GOLD (XAU/USD) Technical Analysis 2016, 19.06 - 26.06: 100-day high at 1314.55 is going to be testing for the bullish trend to be continuing
Daily price is located above 100 SMA/200 SMA for the bullish market condition with the ranging within the following key support/resistance levels:
Descending triangle pattern was formed by the price to be crossed for the possible bearish reversal to be started.
If D1 price will break 1234.70 support level on close bar so the local downtrend as a secondary correction within the primary bullish trend will be started.

If D1 price will break 1199.64 support level on close bar so we may see the bearish reversal to be started with 100-day low at 1115.42 as a good bearish target.
If D1 price will break 1306.67 resistance level on close bar so the bullish trend will be continuing with 100-day high at 1314.55 target to re-enter.
If not so the price will be on ranging within the levels.
Forum on trading, automated trading systems and testing trading strategies
Press review
Sergey Golubev, 2016.06.27 10:28
After - Gold Prices Aims in Opposite Directions After Brexit (adapted from the article)
GOLD (XAU/USD), D1: