Discussion of article "Drawing Indicator's Emissions in MQL5"
Good article. Thank you to the author
Cool!
Breathless..
Really very interesting.
Looking for the possibility to easily change/add more different indicators.
If you have code ideas of how to it correctly, please paste
Well that's it, the broker-kitchens have not long to live, soon the algorithm of the markets will be revealed)
It's possible to rewrite this EA, in order that it, can draw emissions, also in shiftback, and not only in real-time?
In example, a function that set like this: draw emissions for the previous 100 bars back.
It would be useful to draw emissions, like an indicator do for the past/back bars, and not only begin to drawing
only in the moment it(EA) attached to the graph.
How to modify the code, in order to set a back-bars emissions-drawing function?
I hope my 'idea' would like you.
Thanks.
Nobody still interested in this (great) article/EA?
I founded it very interesting, freshly and promising.
I'm looking a way to add more indicators to merge and watch the emissions,
and also a possibility to add something opening positions for trade.
Some code modifications?
Really interesting, but when I compile and use them, nothing happens.
Not sure if I'm missing something?
Steven
- Free trading apps
- Over 8,000 signals for copying
- Economic news for exploring financial markets
You agree to website policy and terms of use
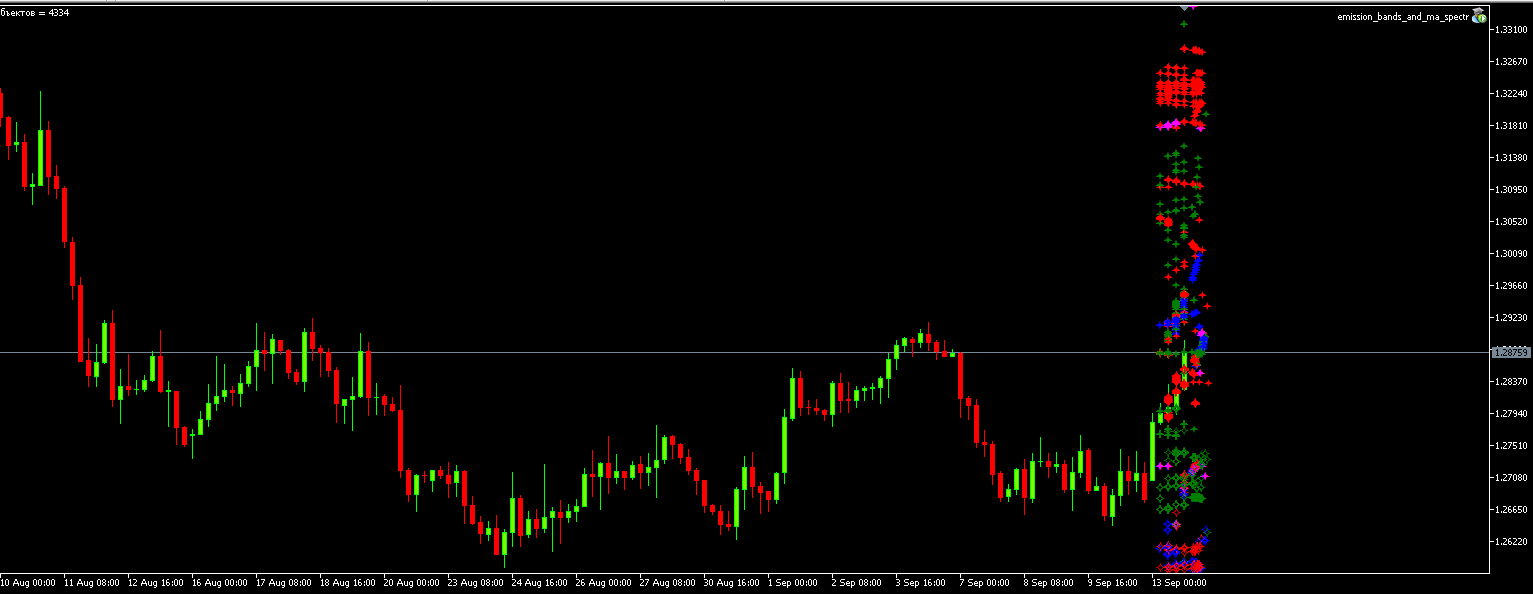
New article Drawing Indicator's Emissions in MQL5 is published:
In this article, we will consider the emission of indicators - a new approach to the market research. The calculation of emission is based on the intersection of different indicators: more and more points with different colors and shapes appear after each tick. They form numerous clusters like nebulae, clouds, tracks, lines, arcs, etc. These shapes help to detect the invisible springs and forces that affect the movement of market prices.
Author: Sergey