Indicators: PivotPoint
Compiled...
Ossspade!!! MT5, praised for its speed, recalculates it on each TF so relentlessly and for such a long time that my kettle boils faster. I didn't expect it, to be honest. I'm not even sure that it is recalculating again every time, as the levels are actually the same on each TF and there is no sense in intraday recalculation, so it all looks even stranger now.
Under MT4 I use https://c.mql5.com/3/2010/4/6/Pivot_fur_D1und_W1.rar - firstly, it works instantly on any TF; secondly, the values of each level are signed (due to the use of graphic objects "horizontal line"); thirdly, it can also show weekly pivots on TF W1, but the bad thing is that when you go to other TFs, weekly levels are not memorised and if necessary, you have to periodically look them up when returning to W1, but it would be great if weekly levels were visually saved on each TF! Besides, on W1 they appear so close to each other that it is very difficult to see them, but if they did not disappear on the lower TFs, they could be seen quite safely.
In general, it would be great to implement all of the above for MT4-PivotPoint with remarks in MT5-indicator PivotPoint, thinking also about the acceleration of the calculation.
Or is slow calculation a question for MT5 developers and not for indicator and script writers?
Or is slow calculation a question for MT5 developers, not for indicator and script writers?
In this case, the slow calculation (compared to the example given by you) is caused by the specific implementation of PivotPoint - it uses 7 indicator buffers to show regular horizontal lines, and if the number of bars on the chart (specified in Service->Settings->Parameters->Graphs->Max.bars in the window) is large, the calculation speed will be low.
As you noted, the code you mentioned for MetaTrader4 uses graphical objects "horizontal lines", that's why it "works instantly on any TF". With this approach, it will also work instantly on any TF in MetaTrader5. This is the right way to speed up the calculation.
This code is a translation - you can address this question to the author of the code in the discussion of the original version.
Also, no one forbids you to offer your own version of this indicator, written in an optimal way - the code will be published and translated.
Thank you for the explanations and separately for the indicator.
Here is your indicator rewritten in MQL5 - please check it.
The logic and structure are the same, the previous MQL4 code is given in the comments.
Here is your indicator rewritten in MQL5 - please check it.
The logic and structure are the same, the former MQL4 code is given in the comments.
1. You cannot set the line colours in the settings.
2. I think it works as slow as PivotPoint in MT5.
3. After removing the indicator from the chart, the lines remain as objects - I have to manually clean them as well, although in MT4 it was enough to remove the indicator to clear the chart completely.
4. On W1, the lines should be at different levels - weekly.
This is all just in case you want to clone it completely.
Nevertheless - thank you for your work!
P.S.: the 2nd point is cancelled - everything accelerated after restarting the terminal, but this acceleration applies only to pivot_fur_d1_und_w1.mq5.
the code is the same as it was in MT4 - compare them.
regarding deletion - corrected the names of deleted objects (horizontal lines) in OnDeInit, because in MT5 lowercase and uppercase names are different.
the code is the same as it was in MT4 - compare them.
regarding deletion - corrected the names of deleted objects (horizontal lines) in OnDeInit, because in MT5 lowercase and uppercase names are different.
Mm-hmm. It seems to be cuckooing in a more familiar voice now.
I should start to study MQL5 and become independent. And even post something useful. I even have inspiration, but I don't have time - that's why my endeavours have lasted for an inconceivably long time....
Forum on trading, automated trading systems and testing trading strategies
Indicators: Pivot Lines TimeZone
newdigital, 2014.01.30 11:06
How to Use Forex Yearly Pivot Points to Forecast Euro Targets (based on dailyfx article)
- Pivot points is a popular and easy way that traders can identify potential support and resistance
- Pivot points are based on a mathematical calculation that uses the previous high, low and close of a specified period; weekly, daily, monthly, yearly
- Yearly pivots can forecast maximum and minimum price extremes for the coming year as well as areas where price can change direction.
While most traders are familiar with daily, weekly, and even monthly pivots which fit their type of trading, yearly pivots can also be used to forecast future potential support and resistance areas. Buying at or near a significant area of support and selling at a key area of resistance is the main focus of any trader no matter what the market or the duration traded. Yearly pivots can be monitored for those key trading opportunities.
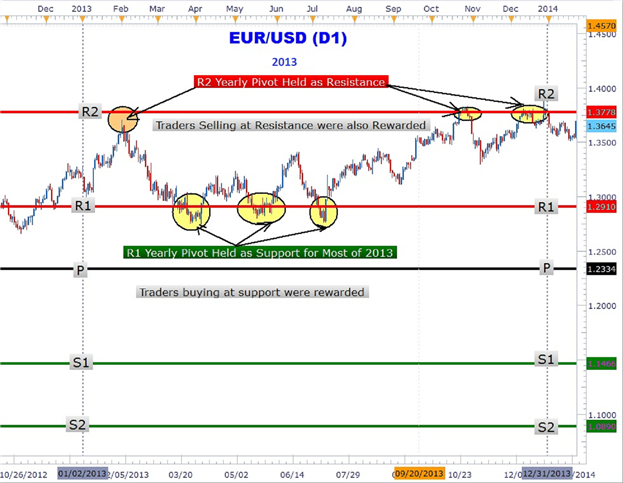
As you can clearly see in the Euro chart above, forex yearly pivots have been plotted. Notice how the Euro rallied up to the R2 pivot and turned around sharply falling over 600 pips in February. Another significant area that can be easily seen showing the power of yearly pivots is the triple touch of the R1 yearly pivot at 1.2910. The third and final touch led to over a 600-pip rally back to the R2 yearly pivot to close out 2013 up over 4%.
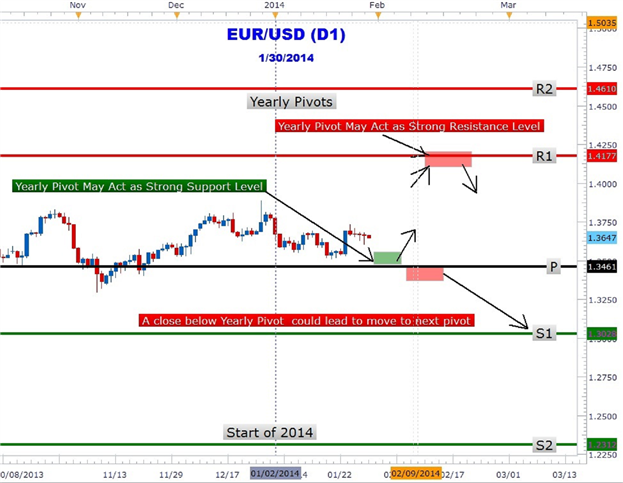
Could forex yearly pivots show traders the next move in the Euro? In the chart above the 2014 yearly pivots are plotted on the EURUSD chart. The year is just getting started and the great thing about yearly pivots is only having to draw them once a year! EURUSD is trapped between the central pivot at 1.3461 and R1 at 1.4177. As at the time of this writing, the Euro has not tested either pivot. However, forex traders may be waiting for a move down to the central pivot (1.3461) for a move back toward the R1 (1.4177) yearly pivot resistance.
Alternative scenario is for the Euro to make an immediate run for it up to the R1 level. At R1 pivot resistance, traders may look to take profit on their longs and/or short the Euro at this level. However, a close above R1 could lead to a move higher to the R2 pivot (1.4610). Traders should also consider the possibility of a close below the central pivot that could lead to a prolonged down push to the S1 (1.3028) level.
Forex traders who scalpers, position or swing traders can make use of yearly pivots to locate key areas of support and resistance. Look for future articles on other currency pairs that lay out the yearly pivot ‘landscape’ to help you navigate the forex market.
- Free trading apps
- Over 8,000 signals for copying
- Economic news for exploring financial markets
You agree to website policy and terms of use
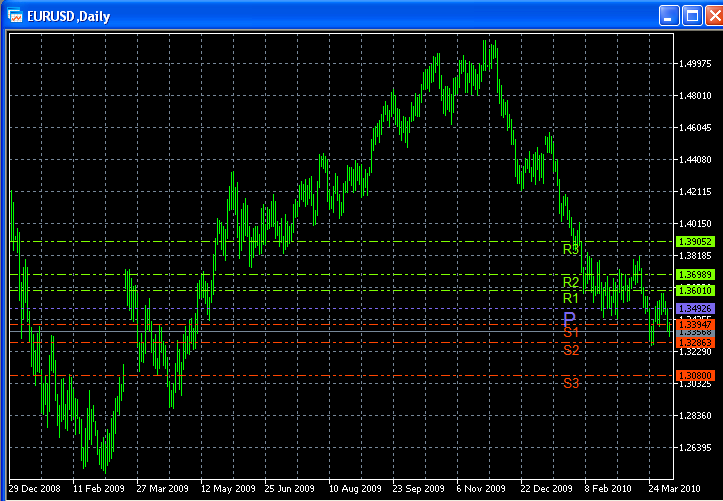
PivotPoint:
Pivot Points are always very useful for trading, this is a simple way to have some idea of where the market is heading during the day.
The indicator also provides the first three supports and resistances. The orange line is the pivot point of the day, the red lines are supports and the green lines are resistances.
Author: okh