GBPUSD Technical Analysis 2015, 20.12 - 27.12: global bearish breakdown
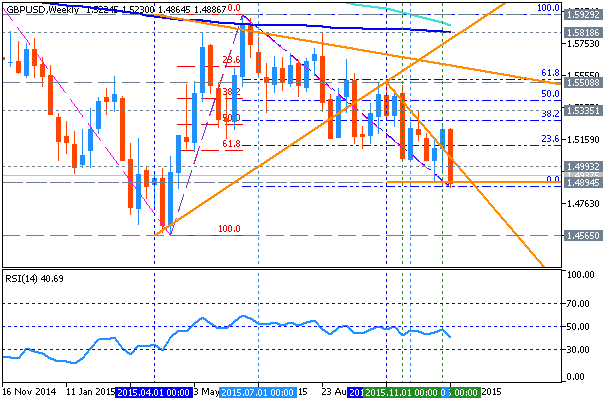
1.45 is the weekly target (the bearish target for weekly price), and this is near 8 month low for now. So, it is related to price action technical analysis on weekly chart for this pair:
M5 price is located below SMA with period 100 (100-SMA) and below SMA with the period 200 (200-SMA) within the following key reversal support/resistance levels:
- Fibo resistance level at 1.5929 located on the border between the primary bearish and the primary bullish trend on the chart, and
- 1.4565 key support level located far below 100-SMA/200-SMA in the primary bearish trend.
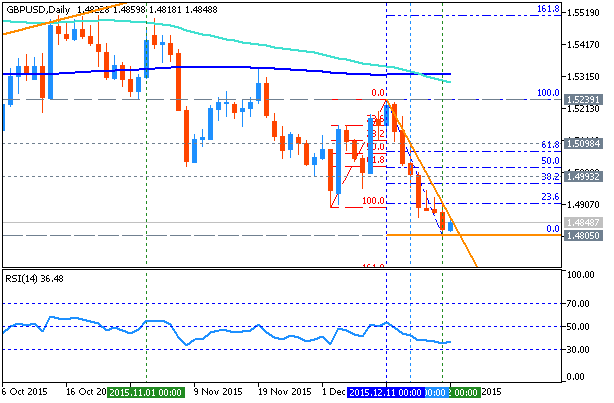
The price is breaking the bearish triangle pattern with Fibo support level at 1.4867 to below for the bearish trend to be continuing with 1.4564 level as the next bearish target.
- If the price will break Fibo resistance level at 1.5929 so the reversal of the price movement from the primary bearish to the primary bullish market condition will be started.
- If price will break Fibo support level at 1.4867 so the bearish trend will be continuing up to 1.4564 level as the next bearish terget.
- If not so the price will be ranging within the levels.
| Resistance | Support |
|---|---|
| 1.5398 | 1.4867 |
| 1.5929 | 1.4564 |
- Recommendation to go short: watch the price to break 1.4867 support level for possible sell trade
- Recommendation to go long: N/A
- Trading Summary: ranging bearish
SUMMARY : ranging bearish
Forum on trading, automated trading systems and testing trading strategies
Sergey Golubev, 2015.12.21 07:18
EUR/USD and GBP/USD: End Of Week Technicals by Barclays Capital (adapted from the article)
Barclays is forecasting the EUR/USD price and GBP/USD price at year-end as the following:
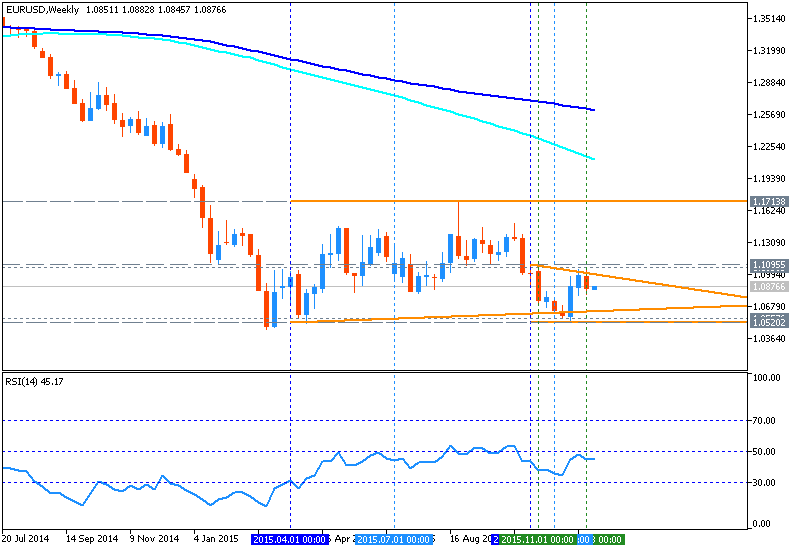
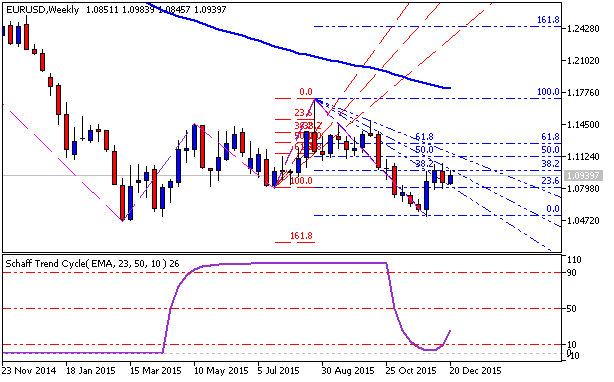
EUR/USD. Ranging. Weekly price is on bearish for the ranging within 1.1713 key erversal reversal level and 1.0520 key support bearish level. RSI indicator is estimating for the ranging bearish trend to be continuing. The most likely scenario for the price movement up to the end of this year is the ranging trend to be continuing within 1.1713/1.0520 s/r area.
| Resistance | Support |
|---|---|
| 1.1095 | 1.0557 |
| 1.1713 | 1.0520 |
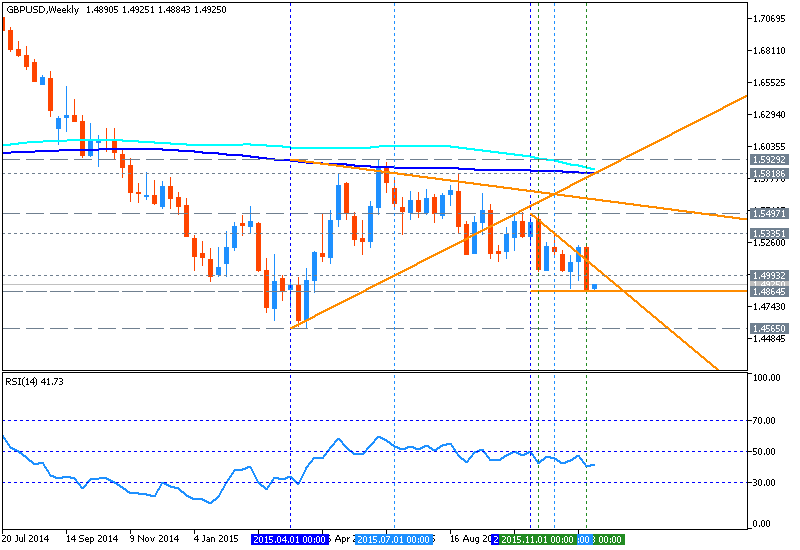
GBP/USD. Bearish. The price is located below 100 period SMA and 200 period SMA for the ranging bearish breakdown: price is breaking descending triangle pattern to below with 1.4864 support level for the bearish trend to be continuing with 1.4565 support level as the next bearish target. The most like scenario for this pair to be moved at the end of the year is the following: bearish breakdown will be continuing with 1.4565 target level.
| Resistance | Support |
|---|---|
| 1.1095 | 1.0557 |
| 1.1713 | 1.0520 |
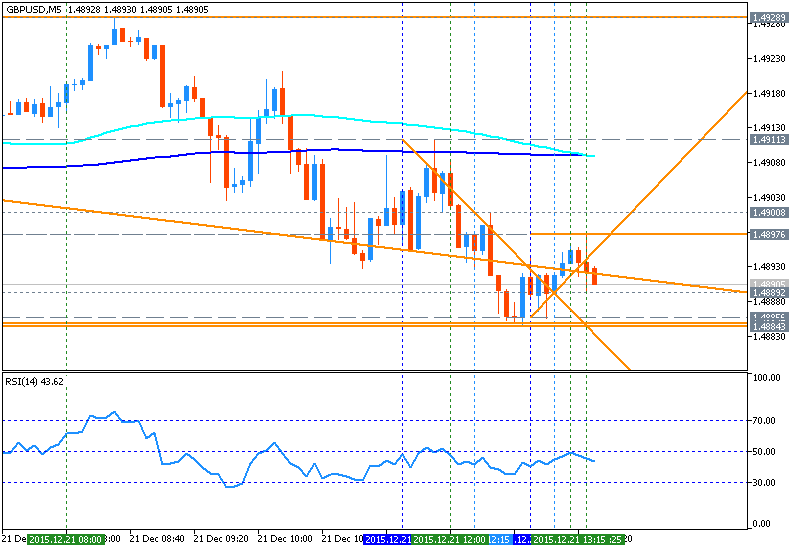
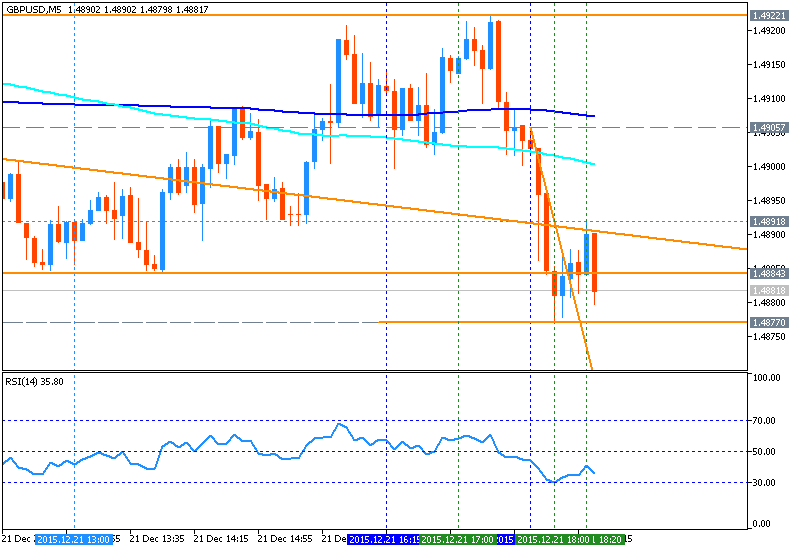
M5 price is on bearish market condition located below SMA with period 100 (100-SMA) and SMA with the period 200 (200-SMA). The price is ranging within the following key s/r levels:
- 1.4884 support level located below 100-SMA/200-SMA in the primary bearish area of intra-day chart, and
- 1.4911 resistance level located on the border between the primary bearish and the primary bullish area.
RSI indicator is estimating the ranging bearish trend to be continuing.
- If the price will break 1.4911 resistance level so reversal of intra-day price movement from the primary bearish to the primary bullish market condition will be started.
- If price will break 1.4884 support so the bearish trend will be continuing.
- If not so the price will be ranging within the levels.
| Resistance | Support |
|---|---|
| 1.4911 | 1.4884 |
| 1.4928 | N/A |
- Recommendation to go short: watch the price to break 1.4884 support level for possible sell trade
- Recommendation to go long: watch the price to break 1.4911 resistance level for possible buy trade
- Trading Summary: ranging
SUMMARY : ranging
- Recommendation
to go short: watch the price to break 1.4884 support level for possible sell trade
- Recommendation
to go long: watch the price to break 1.4911 resistance level for possible buy trade
- Trading Summary: ranging
The price is breaking 1.4884 support level from above to below with 1.4877 target to re-enter:
Forecast for Tomorrow - levels for GBP/USD
GBP/USD M30: bear market rally to the ranging area. The price is located below 200 period SMA (200 SMA) and near 100 period SMA (100 SMA) which is the virtual border between the primary bearish and the ranging bearish trend on the chart. There are the following key s/r levels:
- 1.4907 resistance level located between 100 SMA/200 SMA and near 100 SMA on the border between the primary bearish/ranging bearish condition;
- 1.4928 resistance level located on the border between the primary bearish and the primary bullish area of the chart;
- 1.4877 support level located far below 100 SMA/200 SMA in the primary bearish area of the H4 chart.
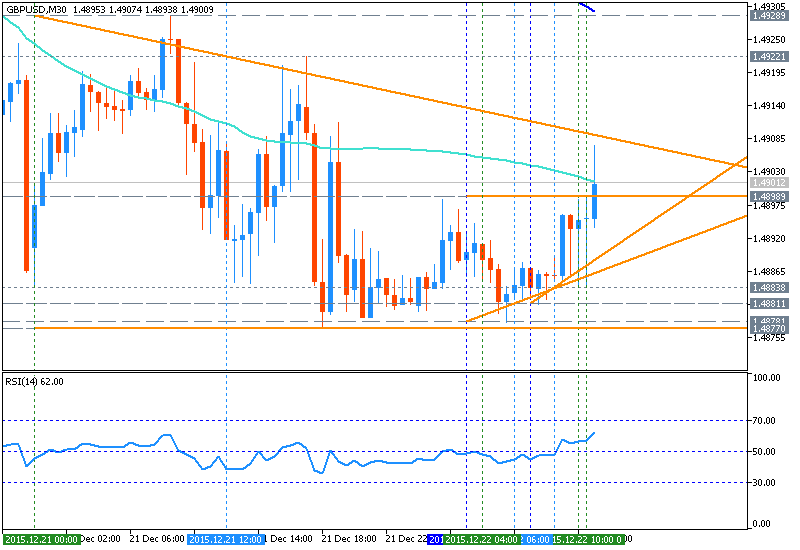
RSI indicator is estimating the possible local uptrend as the secondary bear market rally to be continuing.
- if the price breaks 1.4907 resistance so the local uptrend as the bear market rally will be continuing to the ranging area of the chart located to be between 100 SMA and 200 SMA;
- if the price
breaks 1.4928 resistance so the reversal of the price movement from the primary bearish to the primary bullish trend will be started;
- if the price breaks 1.4877 support level so the primary bearish will be continuing without ranging up to the new 'bottom' to be forming;
- if not so the price will be moved within the channel.
| Resistance | Support |
|---|---|
| 1.4907 | 1.4877 |
| 1.4928 | N/A |
The price broke 1.4877 support level to below with +49 pips in profit for now:

As to Brainwashing trading system (read this page for the rules and to download) so this system made 19 pips in profit by one sell trade, and the trade was closed by stop loss using trailing stop line:

So, signal sistems (Brainwashing for example) is making less profit compare with price action systems (support/resistance systems) but in less risk for deposit and drawdown.
I mean:
- signal sistems (Brainwashing, BrainTrading, Asctrend, etc) = less profit with less risk and small drawdown;
- price action systems Is/r systems, Fibo systems, patterns, etc) = good profit with high risk for deposit and big drawdown sometines.
That is why I like signal trading systems.
Forum on trading, automated trading systems and testing trading strategies
Sergey Golubev, 2015.12.23 10:29
GBP/USD in downtrend towards 1.45; EUR/USD is targeting at at 1.0960/80 (adapted from the article)
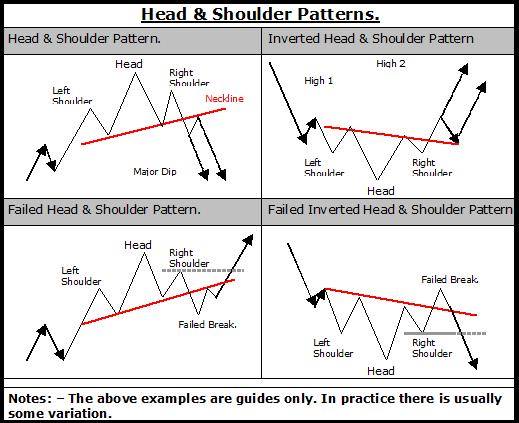
Societe Generale found Head & Shoulders pattern for EUR/USD and GBP/USD:
- "If we drop down to daily chart, the pair has recently confirmed a head and shoulders pattern and is currently testing a descending channel limit at 1.4860/1.48...A move below 1.4860/1.48 will mean persistence in downtrend towards 1.45."
- "Turning to EUR/USD, the pair appears to be
forming the right shoulder of a short term H&S pattern at 1.0960/80."
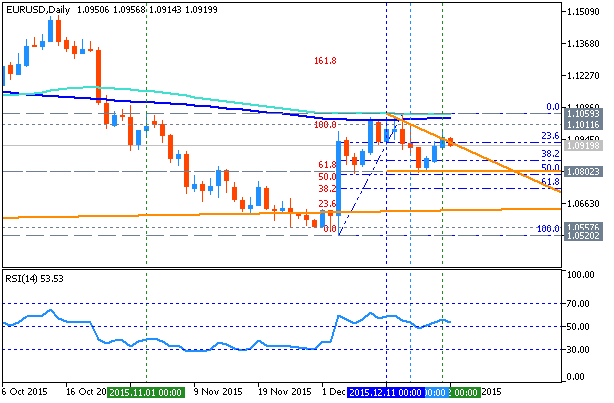
EUR/USD. Bearish ranging on the bullish reversal. The price is located near and below 100-day SMA and 200-day SMA for the ranging within the following key reversal support/resistance levels:
- 1.1059 resistance level located in the beginning of the bullish trend of the daily chart, and
- 1.0802 support level located below 100 SMA/200 SMA in the primary bearish area.
Bearish triangle pattern was formed by the price to be broken for the bearish condition, and RSI indicator is estimating the ranging condition to be continuing.
If the price breaks 1.0802
support level so the primary bearish will be continuing.
If the price breaks 1.1059
resistance level so the price will be started to be reversed from the
primary bearish to the primary bullish condition.
If not so the price will be ranging within the levels.
- Recommendation for long: watch close the price to break 1.1059 for possible buy trade
- Recommendation to go short: watch the price to break 1.0802 support level for possible sell trade
- Trading Summary: ranging
| Resistance | Support |
|---|---|
| 1.1059 | 1.0802 |
| N/A | 1.0557 |
GBP/USD. Bearish breakdown. The price is
on primary bearish market condition to be located far below 100-day SMA and 200-day SMA
within the following key reversal support/resistance levels:
- 1.5239 resistance level located on the border between the primary bearish and the primary bullish trend of the daily chart, and
- 1.4805 support level located below 100 SMA/200 SMA in the primary bearish area.
Descending triangle pattern was formed by the price to be broken for the bearish trend to be continuing, and RSI indicator is estimating the ranging bearish condition by direction.
If the price breaks 1.4805
support level so the primary bearish will be continuing up to 1.4565 level as the target.
If the price breaks 1.5239
resistance level so the bullish reversal will be started.
If not so the price will be ranging within the levels.
- Recommendation for long: watch close the price to break 1.5239 for possible buy trade
- Recommendation
to go short: watch close daily price to break 1.4805 support level for possible sell trade
- Trading Summary: bearish breakdown
| Resistance | Support |
|---|---|
| 1.5239 | 1.4805 |
| N/A | 1.4565 |
Forum on trading, automated trading systems and testing trading strategies
Sergey Golubev, 2015.12.24 15:40
Targets for GBP/USD, USD/JPY and EUR/USD in 2016? - Deutsche Bank (based on the article)
EUR/USD:
"2016 year-end forecasts have changed slightly, while end-2017 forecasts are largely unchanged. EUR/USD is now forecast at 0.95 at the end of 2016, up from our original 0.90 forecast."
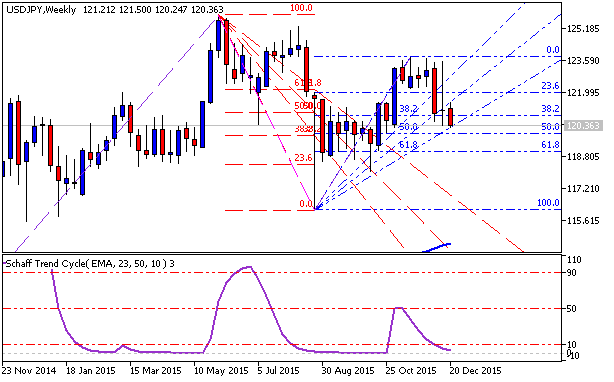
USD/JPY:
"The yen will outperform almost all other currencies barring the USD in 2016, with a USD/JPY peak just shy of Y130."
GBP/USD:
"In 2016/7, Cable is expected to test and likely break the 1.35 – 1.40 bottom end of the range that has prevailed for 30 years."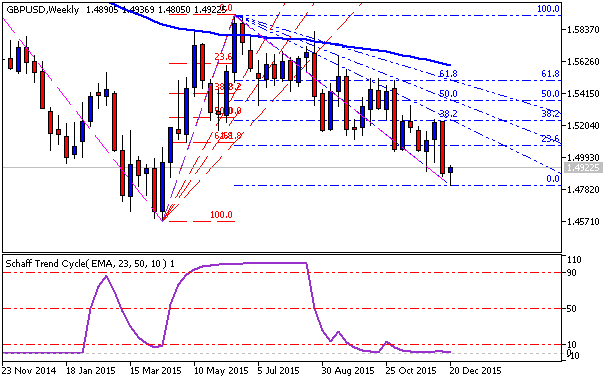
- Free trading apps
- Over 8,000 signals for copying
- Economic news for exploring financial markets
You agree to website policy and terms of use
Daily price is on berarish breakdown located below Ichimoku cloud and 'reversal' Senkou Span line which is the border between the primary bearish and the primary bullish trend on the chart:
Daily price is located within the following key s/r levels:
- 1.5239 key resistance level located on the border between the primary bearish and the primary bullish trend on the daily chart, and
- 1.4864 key support level located far below Ichimoku cloud in the primary bearish area.
W1 price is on bearish breakdown for 1.4894 resistance level together with bearish triangle pattern to be broken for the beakdown to be continuing.Monthly price is on bearish breakdown as well with symmetric triangle pattern to be already broken with 1.4565 resistance level as the nearest bearish target.
If D1 price will break 1.4864 support level on close bar so the bearish trend will be continuing without ranging.
If D1 price will break 1.5239 resistance level on close bar so the reversal of the price movement from the primary bearish to the primary bullish market condition will be started with the secondary ranging: the price will be located inside Ichimoku cloud in this case.
If not so the price will be on ranging within the levels.
SUMMARY : breakdown
TREND : bearish