EURUSD Technical Analysis 2015, 06.12 - 13.12: bear market rally to the bullish reversal
Forum on trading, automated trading systems and testing trading strategies
Sergey Golubev, 2015.12.08 11:42
We like short GBP/USD more than short EUR/USD in Q1'16 - Societe Generale (adapted from the article)
Societe Generale made a forecast for EUR/USD compare with GBP/USD telling that both the pairs will be on bearish condition for Q1'16. And GBP/USD will be in more bearish related to EUR/USD. Let's review this forecast with technical point of view.
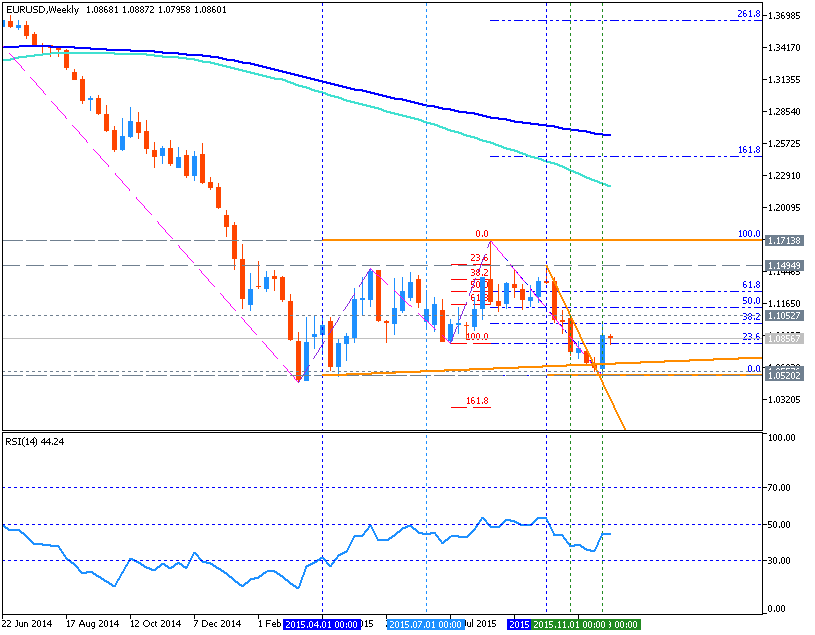

As we see from the charts above - both pairs are located below 100 period SMA and 200 period SMA in the primary bearish area of the chart ranging within key support/resistance levels:
| Instrument | Bearish Target | RSI | Chinkou Span | Absolute Strength |
|---|---|---|---|---|
| EUR/USD | 1.0520 | ranging bearish | ranging bearish | ranging |
| GBP/USD | 1.4565 | strong bearish | strong bearish | ranging for direction |
The price for GBP/USD is having more signs to be bearish in Q1/16 than EUR/USD, and that is why Societe Generale is expecting more bearish for GBP/USD compare with EUR/USD for example.
Forum on trading, automated trading systems and testing trading strategies
Sergey Golubev, 2015.12.09 07:37
EURUSD long-term forecasts updated: more ranging than bearish - Goldman Sachs (based on article)
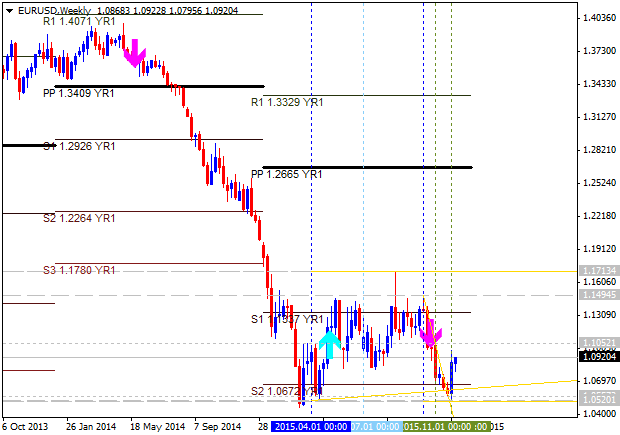
Goldman Sachs updated their long-term forecast for EUR/USD with more bullish than in previous one: the price will be droped to 1.07 for 3 months instead of 1.02 as the previously forecasted, half a year forecast is 1.05 instead of 1.000, and one year fiorecast is 1.0000 instead of 0.9500 previous one.
| Instrument | 3 month forecast | 6 month forecast | 12 month forecast |
|---|---|---|---|
| EUR/USD | 1.0700 vs 1.0200 prev | 1.0500 vs 1.00 prev | 1.00 vs 0.9500 |
According to Goldman Sachs - the price will reach second pivot support level at 1.0672 for 3 months only, and the price will be in the bearish market condition for the ranging within S2 Pivot at 1.0672 and 1.0520 support level. And the bearish trend will be re-started in the second half of 2016 only: price will reach 1.0000 psy level by the end of 2016 for example.
Thus, we will see the ranging bearish market condition since January till June 2016, and the primary bearish condition will be continuing with good breakdown possibility without ranging since July till December 2016.Forum on trading, automated trading systems and testing trading strategies
Sergey Golubev, 2015.12.10 13:06
Setups For EUR/USD by Barclays (based on efxnews article)
Barclays Capital made a forecast for EUR/USD for today and tomorrow:
- the price will break 1.1085/1.1120 resistance area to be reversed to the primary bullish market condition,
- if the price breaks 1.0795 support area so 1.0700 psy level may be the nearest bearish target in this case.
Let's evaluate this forecast with the technical point of view.
M5 timeframe. Ranging bearish. The price is located below 100 period SMA (100 SMA) and 200 period SMA (200 SMA) for the primary bearish market condition with the secondary ranging within the following support/resistance levels:
- 1.1042 key reversal resistance level located above 100 SMA/200 SMA in the primary bullish area of the chart, and
- 1.0932 support level located below 100 SMA/200 SMA in the primary bearish area of intra-day chart.
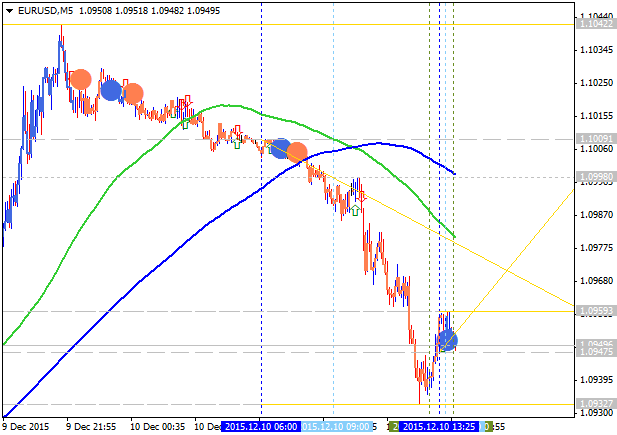
If the price will break 1.0932 support level on close bar so the bearish trend will be continuing.
If the price will break 1.1042 resistance level on close bar so we may see the reversal of the intra-day price movement to the primary bullish market condition.
If not so the price will be on ranging within the levels.
- Recommendation for long: watch close the price to break 1.1042 for possible buy trade
- Recommendation
to go short: watch the price to break 1.0932 support level for possible sell trade
- Trading Summary: ranging near reversal area waiting for direction
Forum on trading, automated trading systems and testing trading strategies
Sergey Golubev, 2015.12.11 10:11
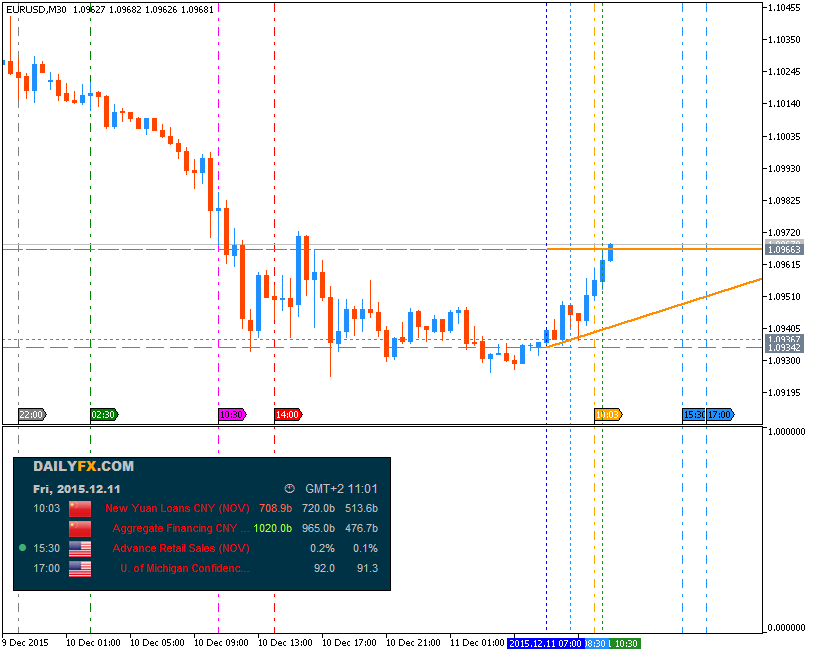
Trading News Events: U.S. Retail Sales (adapted from the article)
Another 0.2% expansion in U.S. Retail Sales may fuel speculation for a
December Fed rate-hike and spur a near-term pullback in EUR/USD as
central bank officials largely endorse an upbeat outlook for the world’s
largest economy.
What’s Expected:
Why Is This Event Important:
Signs of stronger consumption may encourage the Federal Open Market
Committee (FOMC) to remove the zero-interest rate policy (ZIRP) at the
next meeting as it remains one of the leading drivers of growth and
inflation but, a weak sales report may drag on rate expectations as
Chair Janet Yellen appears to be in no rush to normalize monetary
policy.
However, subdued wages accompanied by the slowdown in private credit may
drag on sales, and a dismal outcome may prompt the FOMC to lower its
interest-rate forecast at the December meeting as it undermines the
central bank’s scope to achieve the 2% inflation target over the policy
horizon.
How To Trade This Event Risk
Bullish USD Trade: Retail Sales Expands 0.2% or Greater in November
- Need red, five-minute candle following a positive print to consider a short EUR/USD trade.
- If market reaction favors a bullish dollar trade, sell EUR/USD with two separate position.
- Set stop at the near-by swing high/reasonable distance from entry; look for at least 1:1 risk-to-reward.
- Move stop to entry on remaining position once initial target is hit; set reasonable limit.
- Need green, five-minute candle to favor a long EUR/USD trade.
- Implement same setup as the bullish dollar trade, just in reverse.
EUR/USD Daily
- EUR/USD stands at risk of further retracing the decline from the October high (1.1494) as the bull flag formation takes shape following the European Central Bank (ECB) interest rate decision, while the Relative Strength Index (RSI) appears to breaking out of the bearish formation from back in August.
- Interim Resistance: 1.1052 (November high) to 1.1090 (50% retracement)
- Interim Support: Interim Support: 1.0380 (78.6% expansion) to 1.0410 (61.8% expansion)
- Free trading apps
- Over 8,000 signals for copying
- Economic news for exploring financial markets
You agree to website policy and terms of use
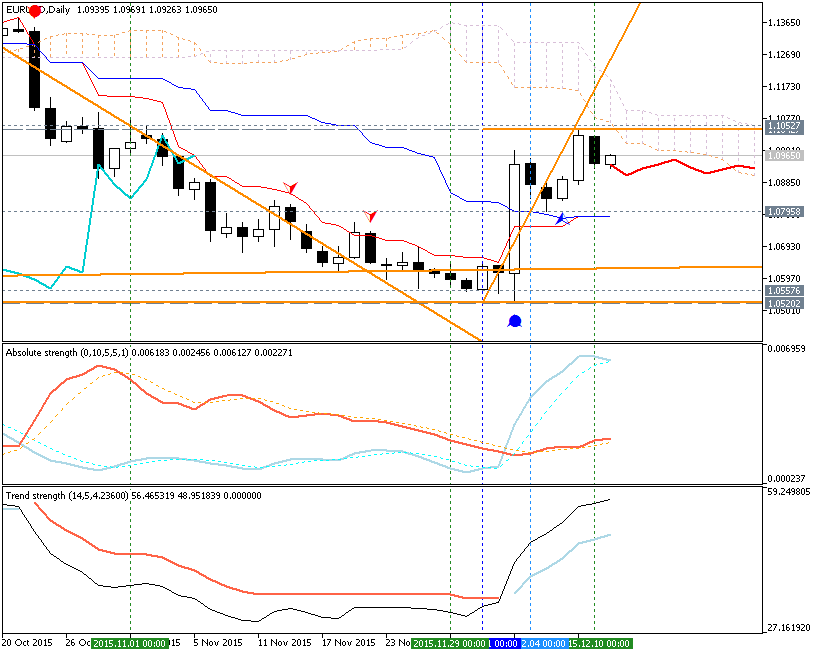
Daily price is on the primary bearish market condition located near and below Ichimoku cloud and 'reversal' Senkou Span lines within the following key support/resistance levels:
- 1.0980 key resistance level located on the border between the primary bearish and the primary bullish on the chart, and
- 1.0516 key support level.
The daily price was on breakout (bear market rally) in the end of the last week: price broke key resistance levels to above to be stoped near bullish reversal levels.D1 price - bear market rally:
If D1 price will break 1.0516 support level on close bar so the bearish trend will be continuing without secondary ranging up to 1.0461 level as the next bearish target.
If D1 price will break 1.0980 resistance level on close bar so the reversal of the price movement from the primary bearish to the ranging bullish condition will be started.
If D1 price will break 1.1494 resistance level on close bar so the price will be fully reversed to the bullish market condition located to be above Ichimoku cloud in the bullish area of the chart.
If not so the price will be on ranging within the levels.
SUMMARY : bearish
TREND : bearish breakout