AUDUSD Technical Analysis 2015, 13.12 - 20.12: correction for the possible bearish reversal
Forum on trading, automated trading systems and testing trading strategies
Sergey Golubev, 2015.12.14 08:18
AUD/USD Fundamental Analysis and Forecast (based on the article)With no major domestic data scheduled on this week, CBA's Chief Currency Strategist Richard Grace believes markets will be paying close attention to movements in the Chinese renminbi given the PBOC signaled on Friday its intention to change the way it will manage the value of the CNY moving forward.
"The PBoC signaled its intention to change the way it will manage the value of the CNY by potentially loosening the peg to the USD and starting to track CNY against a trade-weighted basket of currencies," wrote Grace.
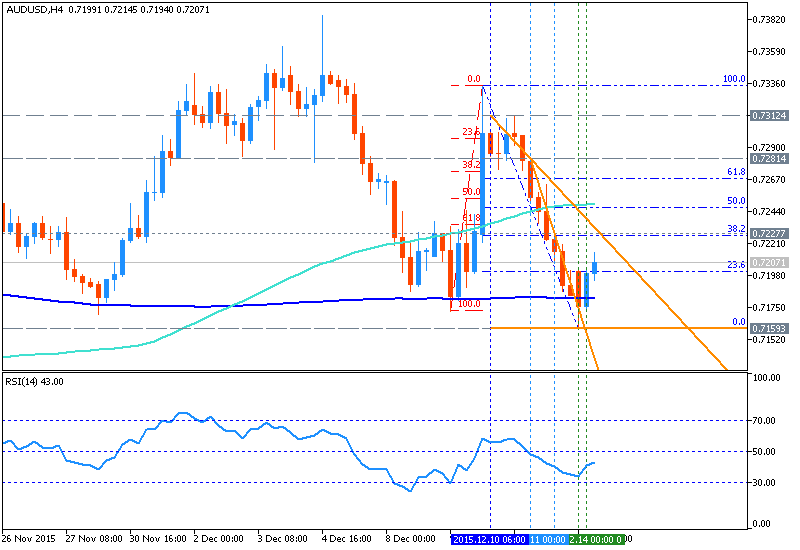
From the technical point of view - intra-day price (H4) is on ranging market condition: the price was bounced from 0.7159 support level to be between 100 SMA/200 SMA area breaking 23.6% Fibo level from below to above for 50.0% Fibo level as the next target:
- if the price breaks 50.0% Fibo resistance level at 0.7246 to above so the reversal of intra-day price to the primary bullish market condition will be started;
- if the price breaks 0.7159 support level so we may see the bearish market condition for this pair on intra-day H4 chart;
- if not so the price will be ranging within the levels.
Forum on trading, automated trading systems and testing trading strategies
Sergey Golubev, 2015.12.14 14:08
AUD/USD: short-term strategy, long-term strategy and the levels to watch - Swiss Finance Corporation (based on the article)
- Short-term strategy: "Negative below 0.7240/7310 with scope for limited losses ahead. Short strategy off 0.7250 is stil in the money. Reconsider booking profits on downticks or stick to shorts with stops trailed down to entry level, targeting retest of recent lows."
- Long-term strategy: "No change. Positive above m/t support @
0.7020. Sustained break above 0.7720 opens 0.7380/7440 (partially met)as
next targets. Sharp rejection off 0.7380 signals bull exhaustion and
possible top in place. Book profits on upticks or trail stops up to
0.7160."
- Levels to watch: "0.7160 on the downside 0.73 on the upside."
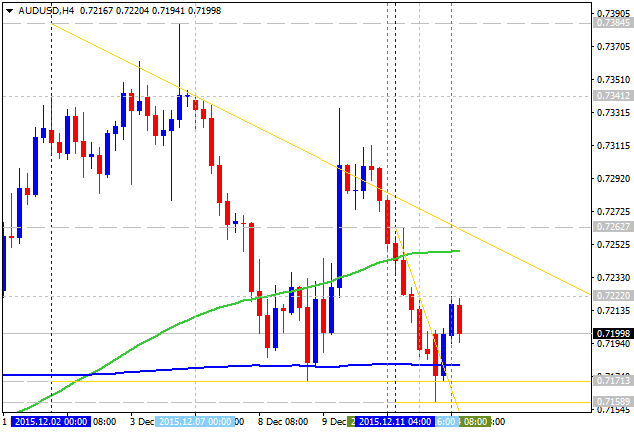
As we see from the chart above - the price (H4) is ranging between 100 period SMA and 200 period SMA waiting for direction.
- If the price will break 0.7262 resistance level on close H4 bar so the bullish trend to be started on this timeframe.
- If price will break 0.7158 support on close H4 bar so we may see the bearish market condition for this intra-day price.
- If not so the price will be ranging within the levels.
| Resistance | Support |
|---|---|
| 0.7262 | 0.7171 |
| 0.7341 | 0.7158 |
- Recommendation to go short: watch the price to break 0.7158 support level for possible sell trade
- Recommendation to go long: watch the price to break 0.7262 resistance level for possible buy trade
- Trading Summary: ranging
Forum on trading, automated trading systems and testing trading strategies
Sergey Golubev, 2015.12.15 06:50
AUD/USD Technical Analysis: re-enter for short (based on the article)
- "The Australian Dollar continues to consolidate below the 0.73 figure against its US counterpart having broken support set from early November. Overall positioning may be carving out a bearish Head and Shoulders topping pattern, although confirmation is still pending for now."
- "From here, a daily close below resistance-turned-support at 0.7184 opens
the door for a challenge of 0.7089, the intersection of a rising trend
line set from September lows and the 23.6% Fibonacci expansion.
Alternatively, a push above horizontal pivot resistance at 0.7283 paves
the way for a test of the 38.2% Fib retracement at 0.7387."
-
"We sold AUD/USD at 0.7250 and subsequently booked profit on half of the position."
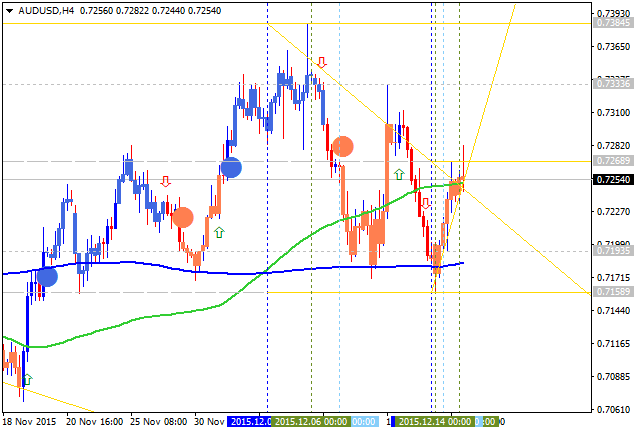
Anyway, H4 price is located near 100 period SMA on the border between the primary bullish and the ranging bearish trend on the chart with the symmetric triangle pattern to be crossed for direction:
- if the price breaks 0.7268 resistance so the reversal to the primary bullsh condition will be started;
- if the price breaks 0.7158 support level so the primary bearish trend will be continuing with the secondary ranging up to the new 'bottom' to be forming;
- if not so the price will be moved within the channel.
| Resistance | Support |
|---|---|
| 0.7268 | 0.7158 |
| 0.7384 | N/A |
Forum on trading, automated trading systems and testing trading strategies
Sergey Golubev, 2015.12.15 17:31
AUD/USD: intra-day bearish reversal (adapted from the article)
Swiss Finance Corporation made the following forecast for this pair:
- Short-term strategy: "Mixed.Conflicting s/t and m/t signals. Respect 0.7160-0.7340 range for now. Shorts off 0.7250 closed @ 0.7185 & 0.7220. No position at present."
- Long-term strategy: "No change.Positive above m/t support @ 0.7020.Sharp rejection off 0.7380
signals bull exhaustion and possible top in place. Close longs on
rallies or trail stops up to 0.7160, targeting retest of recent highs."
- Levels to watch: "0.7180/60 on the downside 0.73 on the upside."
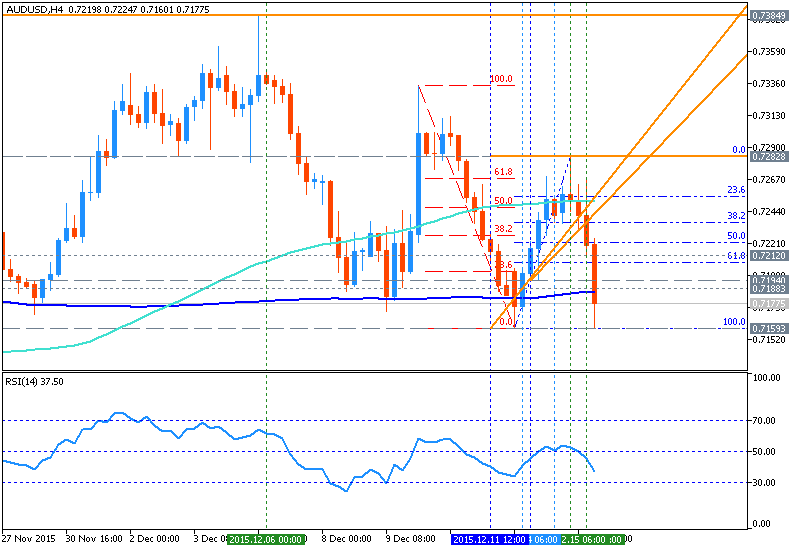
The price (H4) is on bearish reversal for the 200 period SMA crossing within the following key reversal support/resistance levels:
- Fibo resistance level at 0.7282 located above 100 SMA/200 SMA in the primary bullish area of the chart, and
- Fibo support level at 0.7159 located below 100 SMA/200 SMA levels in the primary bearish area.
RSI
indicator is estimating the bearish breakdown to be started.
- If the price will break Fibo resistance level at 0.7282 from below to above on close H4 bar so the bullish trend will be continuing.
- If price will break Fibo support level at 0.7159 from above to below on close H4 bar so we may see the reversal of the price movement from the primary bullish to the primary bearish market condition.
- If not so the price will be ranging within the levels.
| Resistance | Support |
|---|---|
| 0.7282 | 0.7159 |
| 0.7384 | N/A |
- Recommendation to go short: watch close H4 price to break 0.7159 support level for possible sell trade
- Recommendation to go long: watch close H4 price to break 0.7282 resistance level for possible buy trade
- Trading Summary: possible bearish breakdown
Forum on trading, automated trading systems and testing trading strategies
Market Condition Evaluation based on standard indicators in Metatrader 5
Sergey Golubev, 2015.12.16 10:50
AUD/USD: Technical Price Action Analysis - daily ranging near bearish reversal area
D1 price is on ranging bearish market condition located below 200 day SMA (200 SMA) and near 100 day SMA (100 SMA) within the following key reversal support/resistance levels:
- 0.7384 resistance level located near 200 SMA on the border between the primary bearish and the primary bullish trend on the daily chart, and
- 0.7015 support level located below 100 SMA/200 SMA in the primary bearish area.
RSI indicator is estimating the ranging bearish condition to be continuing by direction.
- If the price will break 0.7384 resistance level so the reversal of the price movement from the ranging bearish to the primary bullish condition will be started.
- If price will break 0.7015 support so the bearish trend will be continuing without secondary ranging up to 0.6907 level as the next bearish target.
- If not so the price will be ranging within the levels.
| Resistance | Support |
|---|---|
| 0.7384 | 0.7015 |
| N/A | 0.6907 |

- Recommendation to go short: watch close daily price to break 0.7015 support level for possible sell trade
- Recommendation to go long: watch close daily price to break 0.7384 resistance level for possible buy trade
- Trading Summary: ranging bearish
SUMMARY : bearish
Forum on trading, automated trading systems and testing trading strategies
Sergey Golubev, 2015.12.16 13:34
USD, EUR/USD, AUD/USD and GBP/USD Into FOMC (adapted from the article)
Credit Suisse and Credit Agricole are forecasting the Fed rates hike for today telling that Fed will maintain a dovish tone during the FOMC Statement:
2014-12-16 19:00 GMT | [USD - Federal Funds Rate]
- past data is 0.25%
- forecast data is 0.50%
- actual data is N/A
according to the latest press release
if actual > forecast (or previous one) = good for currency (for USD in our case)
[USD - Federal Funds Rate] = Interest rate at which depository institutions lend balances held at the Federal Reserve to other depository institutions overnight. Short term interest rates are the paramount factor in currency valuation - traders look at most other indicators merely to predict how rates will change in the future.
==========
Credit Suisse, Credit Agricole and some other int'l financial institutions are forecasting the ranging volatile market condition during and after FOMC mettings because of the following:
- they predict for Federal Funds Rate actual value to be 0.50% compare with the 0.25% as the previous one, and if actual > forecast (or previous one) = good for currency (for USD in our case), but
- they are expecting less hawkish (more dovish tone) during the FOMC Statement, and as we know: less hawkish is bad for currency (for USD in our case).
Thus, we may see the ranging condition in intra-day basis for the major currency pairs.
What does it mean for EUR/USD, AUD/USD and GBP/USD for example?
==========
EUR/USD H4: Ranging. The price is on ranging condition located near and above 100 SMA/200 SMA within the following key reversal support/resistance levels:
- 1.1059 resistance located above 100 SMA/200 SMA in the bullish area of the chart, and
- 1.0520 support level located below 100 SMA/200 SMA in the primary bearish area of the chart.
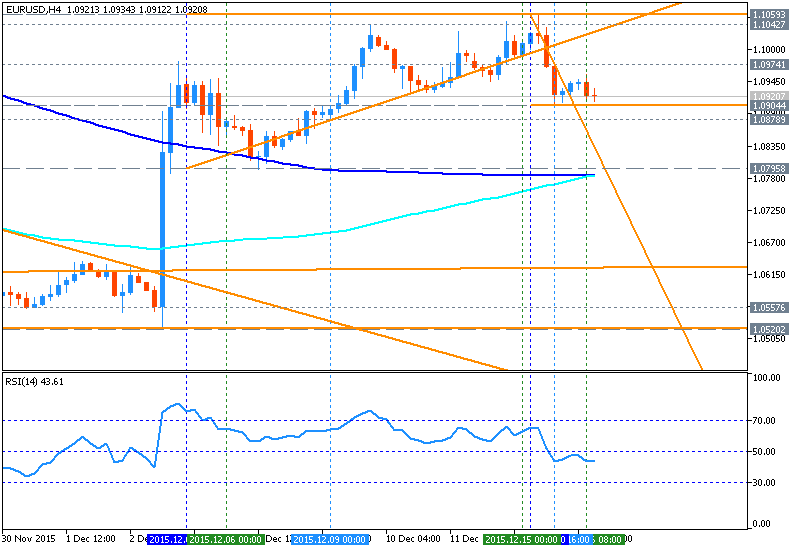
According to above mentioned forecast - the price will continuing with the ranging condition within the levels.
==========
AUD/USD H4: Ranging on bearish reversal. The price is on ranging condition located near 200 SMA on the border between the primary bearish and the primary bullish trend on the chart within the following key reversal support/resistance levels:
- 0.7384 resistance located above 100 SMA/200 SMA in the bullish area of the chart, and
- 0.7159 support level located below 100 SMA/200 SMA in the primary bearish area of the chart.
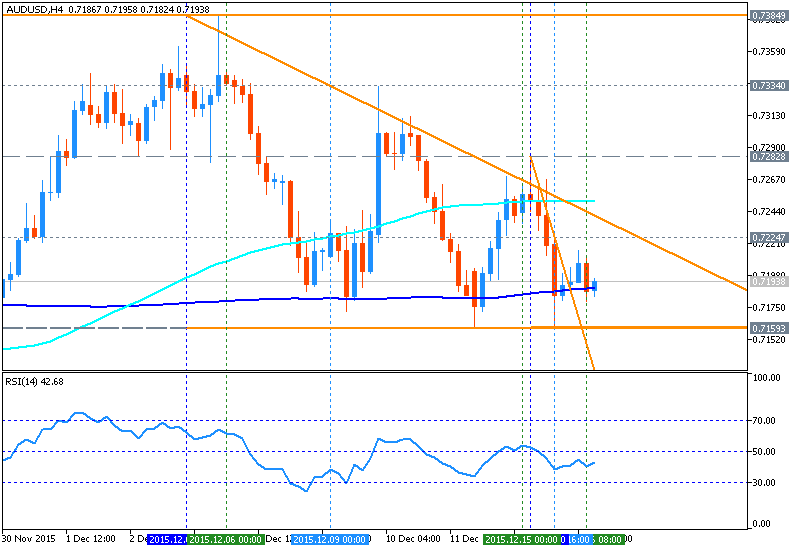
Thus, we can foresee the price to break 200 SMA from above to below for 0.7159 as the next bearish target which means the reversal of intra-day price movement to the primary bearish market condition.
==========
GBP/USD H4: Ranging. The price is located near and below 100 SMA/200 SMA for the ranging market condition within the following key reversal support/resistance levels:
- 1.5239 resistance located above 100 SMA/200 SMA in the bullish area of the chart, and
- 1.4894 support level located below 100 SMA/200 SMA in the primary bearish area of the chart.
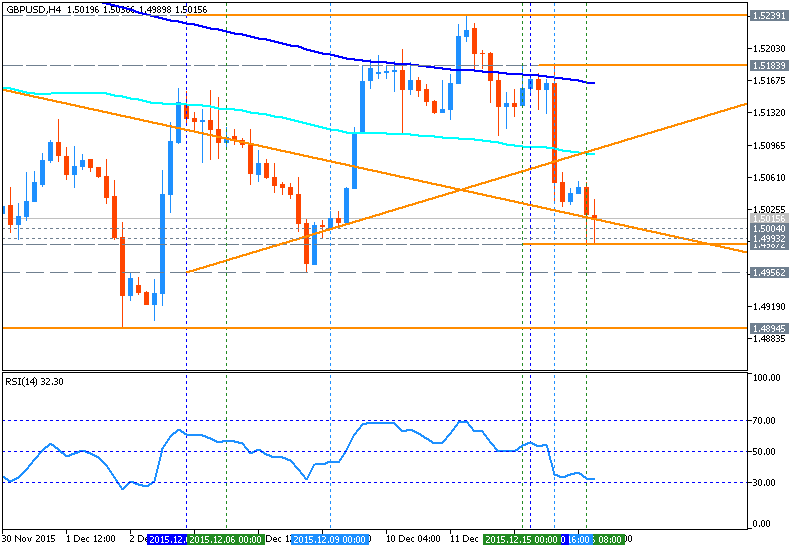
The most likely scenario for the intra-day price is to be moved during and immediate after FOMC meetings with the ranging condition within the levels, and in long-term situation - bearish market condition by 1.49/1.48 support area to be broken.
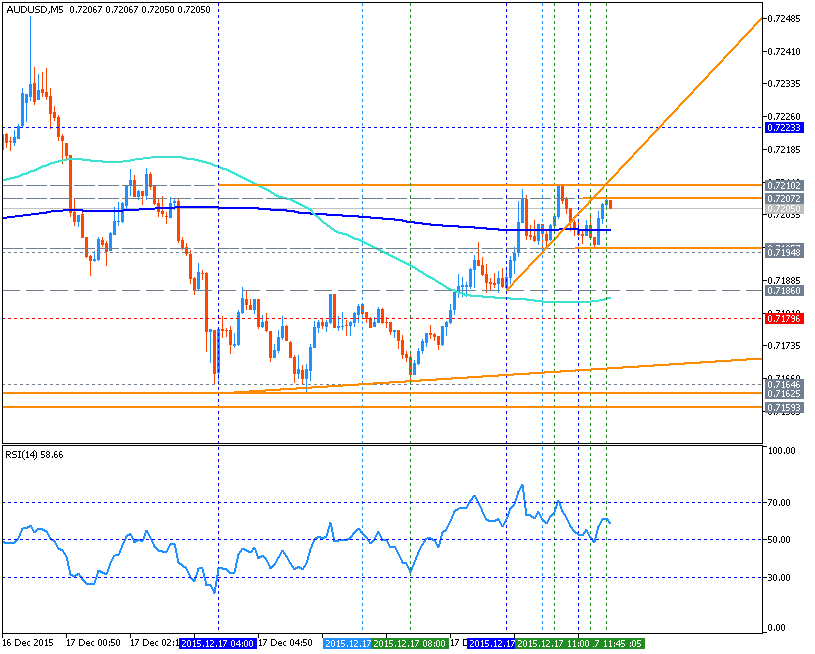
AUD/USD Intra-Day Technical Analysis - ranging on reversal levels
M5 price is ranging around 200 period SMA on the border between the primary bearish and the primary bullish trend on the chart with the following key reversal support/resistance levels:
- 0.7223 resistance level located above 100 SMA/200 SMA in the primary bullish area of the chart, and
- 0.7179 support level located below 100 SMA/200 SMA in the primary bearish area of the chart.
Absolute Strength indicator is estimating the ranging bullish condition in the near future.
- If the price will break 0.7223 resistance level so the bullish trend will be continuing without the secondary ranging.
- If price will break 0.7179 support so the bearish reversal will be started.
- If not so the price will be ranging within the levels.
| Resistance | Support |
|---|---|
| 0.7223 | 0.7179 |
| 0.7279 | 0.7159 |
- Recommendation to go short: watch the price to break 0.7179 support level for possible sell trade
- Recommendation to go long: watch the price to break 0.7223 resistance level for possible buy trade
- Trading Summary: ranging
SUMMARY : ranging
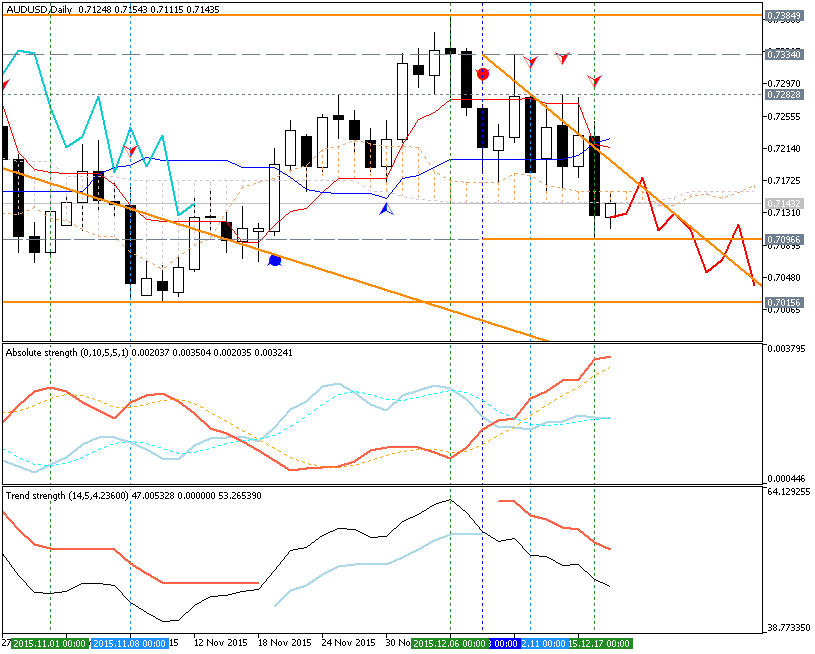
AUD/USD: End Of Week Technicals - Ranging Bearish Breakdown
D1 price
is on ranging bearish breakdown: the price broke Ichimoku cloud and Senkou Span line which is the virtual border between the primary bullish and the
primary
bearish on the chart. Daily price is located on the border between the primary bearish and the primary bullish trend on the chart trying to break 0.7096 support level to below for the bearish trend to be continuing. descending triangle pattern was formed by the price to be crossed for the breakdown, and Absolute Strength indicator is estimating the bearish market condition to be continuing in the near future.
If the price will break 0.7384 resistance level so the price will be fully reversed to the bullish market condition with good breakout possibility.
If not so the price will be ranging within the levels.
- Recommendation for long: watch close D1 price to break 0.7384 for possible buy trade
- Recommendation
to go short: watch D1 price to break 0.7096 support level for possible sell trade
- Trading Summary: bearish breakdown
| Resistance | Support |
|---|---|
| 0.7282 | 0.7096 |
| 0.7384 | 0.7015 |
SUMMARY : ranging
TREND : bearish
- Free trading apps
- Over 8,000 signals for copying
- Economic news for exploring financial markets
You agree to website policy and terms of use
Daily price finished the week with good breakdown: the price broke key support levels for the correction and stopped near & above Ichimoku cloud, 'reversal' Senkou Span line and 0.7171 support level on the border between the primary bullish and the primary bearish on the chart within the following key s/r levels:
- 0.7384 key resistance level located far above Ichimoku cloud in the primary bullish area of the chart, and
- 0.7015 key support level located far below Ichimoku cloud in the primary bearish area.
Absolute Strength indicator is estimating the downtrend to be continuing, and Chinkou Span line is located to be near & above the price to be ready to cross it from above to below for the possible breakdown to be continuing.If D1 price will break 0.7171 support level on close bar so the reversal of the price movement from the primary bullish to the primary bearish market condition will be started with the secondary ranging.
If D1 price will break 0.7384 resistance level on close bar so the bullish trend will be continuing without ranging.
If not so the price will be on ranging within the levels.
SUMMARY : breakdown
TREND : daily bearish reversal