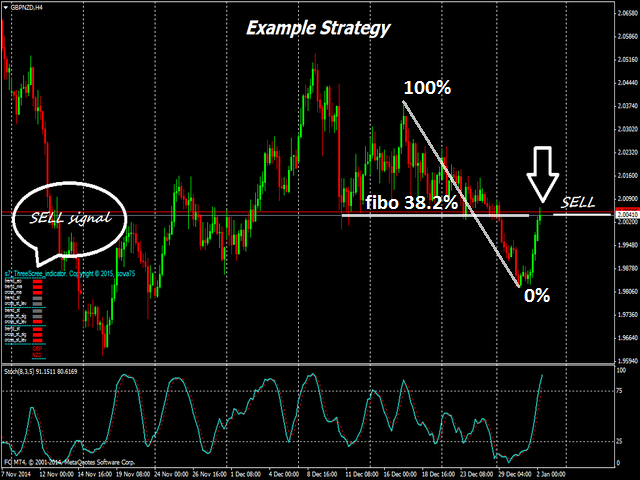
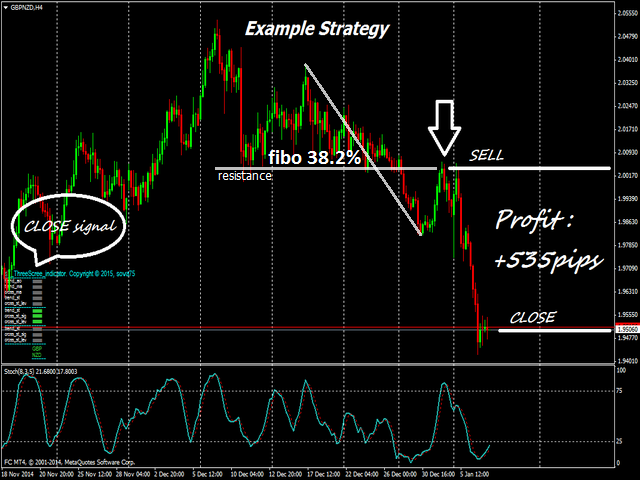
im new for the trading..how gonna be using this indicator buy and sell?
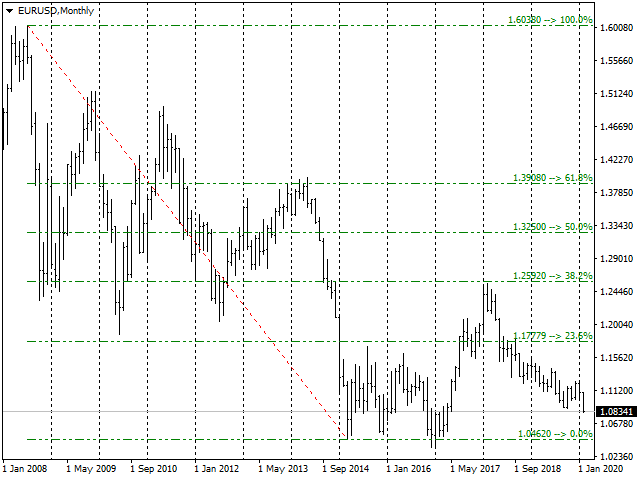
The pivot levels and Fibonacci retracements can be used as levels of support and resistance zones for possible reversal of the price movement.

See more...
TRADING MANUAL - How To Use Fibonacci
The Forex Trader’s Guide to Support and Resistance
![Fibonacci Retracements [ChartSchool] Fibonacci Retracements [ChartSchool]](https://c.mql5.com/36/7/fibonacci-retracements-chartschool.png)
- stockcharts.com
I like the pivot indicator, but is there a way to remove the words, "yesterday, today and open" of the chart.
Correct code:
Line 270: SetTimeLine("YesterdayStart", "yesterday", idxfirstbarofyesterday, CadetBlue, level - 4*Point);
Line 271: SetTimeLine("YesterdayEnd", "today", idxfirstbaroftoday, CadetBlue, level - 4*Point);
Line 327: SetLevel("T\'s Open", today_open, Orange, LineStyle, LineThickness, startofday);
Thanks for your quick responds.
Best regards.
Hello,
I take a look indicator XIT_FIBS.mq4 (Automatically plot Fibonacci retracement lines with price on visible chart). It can be used to build levels at any timeframe.
Good luck)


- www.mql5.com
- Free trading apps
- Over 8,000 signals for copying
- Economic news for exploring financial markets
You agree to website policy and terms of use


SDX-TzPivots_3:
Calculation of pivot and similar levels based on time zones.
Author: Aleh Sasonka