Indicators: Value Charts
Hello. Overbought/oversold levels are counted only by high/low candlestick. Please add the option to select the Close price option as well.
Thank you.
how do I make these arrows a lil bit more far away from candles?
Error to load...
Hi, thanks for this indicator. I have a question: is it possible to have alert on this indicator? Thanks a lot for your reply...
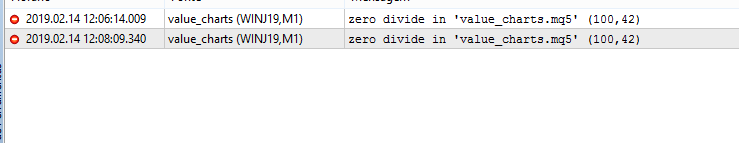
Erroe "zero divide" because variable _AValue is equal to zero!!! Please correct it!
You are missing trading opportunities:
- Free trading apps
- Over 8,000 signals for copying
- Economic news for exploring financial markets
Registration
Log in
You agree to website policy and terms of use
If you do not have an account, please register
Value Charts:
Value Charts is a detrended price indicator, it shows the overbought and oversold states using the detrended price extremes.
For a nice description, see the "Dynamic Trading Indicators: Winning with Value Charts and Price Action Profile" book Mark Helweg and David Stendahl, this book is very good.
Author: FxGeek