On Approximating the Price Change per Tick (Per Unit of Tick Volume) in Historical Data
It is available for MT5 on all brokers I know about, but how far it goes back, depends. Some brokers only offer a few months, while others offer many years of historical tick data.
So, yes you can read the available tick data for each bar and analyse it to calculate whatever metric you wish. I have done this quite often, for calculating things like the max/min/average spread, or the mid-prices for OHLC values, etc.
Gets ticks in the MqlTick format into ticks_array
Gets ticks in the MqlTick format within the specified date range to ticks_array
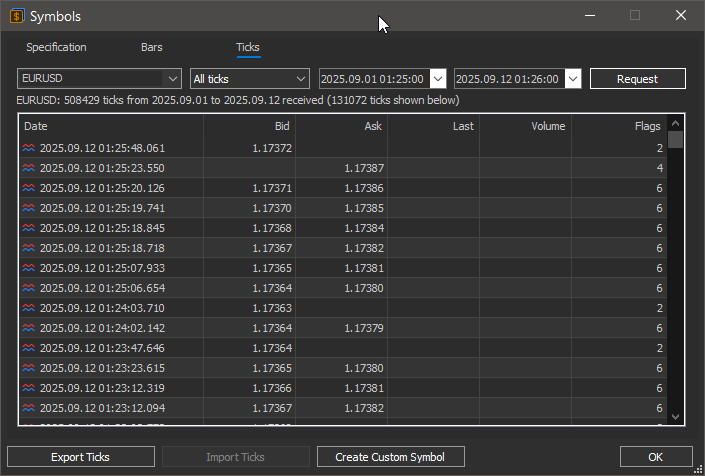
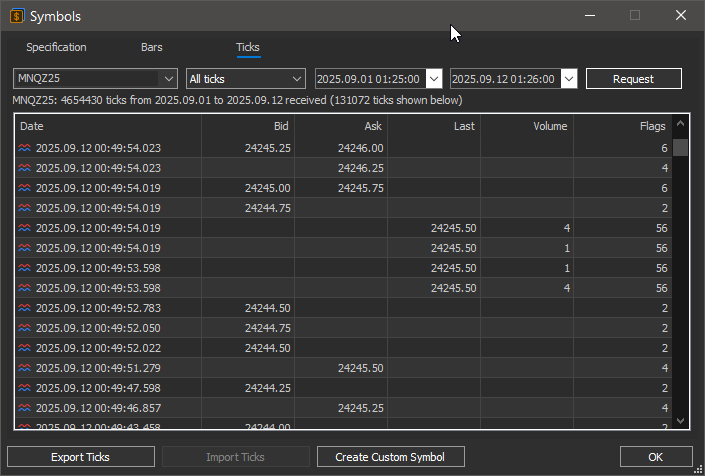
Besides doing it programmatically, you can also use the Symbols (Ctrl-U) panel to request and view the tick data.

- www.mql5.com
To Stanislav Korotky & Fernando Carreiro
Thank you all very much for your valuable feedback.
For now, I plan to work on creating code that allocates tick volume using the CopyTicks function.
Since I am still quite inexperienced when it comes to coding, I expect that I will have more questions to bring up in future conferences. I would be very grateful for your guidance and advice at those times as well.
Note that the volume retrieved via MqlTick is real volume for stocks and futures and not the tick volume seen in forex. If you want to extract volume tick-by-tick, I made an indicator to do that before, and the ticks are taken from tick_volume buffer.
I made an indicator which splits incoming buyer volume and seller volume, and also made another indicator which plots incoming volume in tick time.Not quite! "Tick Volume" is just a count of each tick change, so all you have to do is count them per the required time interval when processing the tick data. It's that simple!
You still missing the point—CopyTicks for tick volume does not return 0—it is in itself the tick volume. The volume field in ticks is the real volume, because the tick-volume for a tick is in fact just "1".
How do you think MetaQuotes comes up with the value to place in the "tick_volume" in that field in the first place?
All the M1 bar data was first originally build up from the tick data, and the "tick_volume" field was calculated by simply counting the ticks.
So no, the OP does not have to use the CopyTickVolume() when processing ticks. They simply have to count the ticks to derive the tick volume, because the tick-volume for a tick is simply "1".
He was also talking about an idea of calculating a standard deviation of ticks which would be involving bars of tick volume if it is timeframe based. The most simple thing to use for calculation is tick_volume, that's all.
So no, the OP does not have to use the CopyTickVolume() when processing ticks. They simply have to count the ticks to derive the tick volume, because the tick-volume for a tick is simply "1".
All I have said here originally was that it's pointless to waste time with CopyTicks or CopyTick (which uses the MqlTick struct)
The OP wants to calculate the standard deviation of the tick volume in regards to "per-tick price change" and "allocating tick volume into buy-side and sell-side".
There is no way to avoid using CopyTicks() and the tick volume has to be counted based on direction or any other conditions the OP has.
Using the bar's volume (e.g. CopyTickVolume) would be useless for the requirements posted.
The OP wants to calculate the standard deviation of the tick volume in regards to "per-tick price change" and "allocating tick volume into buy-side and sell-side".
What I interpreted from that is that it gathers the data from previous bars first, and then continues on tick by tick =>as all indicators do
In regard to splitting tick volume into buy side and sell side, that has been published in the codebase
Conor Mcnamara, 2025.07.29 20:05
An indicator that provides a clear visualization of volume pressure on each side of the market- Free trading apps
- Over 8,000 signals for copying
- Economic news for exploring financial markets
You agree to website policy and terms of use
I have a question for everyone, and I would greatly appreciate your insights.
I would like to approximate the price change per tick (i.e., per unit of tick volume) in historical data.
The reason is that I would like to use this per-tick price change as a basis for allocating tick volume into buy-side and sell-side components.
For the current bar, this allocation is straightforward: in real time, we can simply check whether the price moved up or down compared to the previous tick, which gives us an accurate distribution.
However, for past bars, tick-by-tick data is not available, so the only option is to calculate some kind of approximation.
One idea I have considered is the following:
Calculate the standard deviation (or median) of tick volume, and focus on the parts where the Z-score is less than or equal to zero.
Further restrict this to cases where the tick volume is greater than or equal to 1.
In other words, take the average per-tick price change over a chosen period, but only in situations where trading activity is relatively low.
My reasoning is that in such conditions, there is less likelihood of buy and sell forces canceling each other out, so the price movement per tick is more directly reflected in one direction.
That said, if anyone has ideas or suggestions for a more accurate way to estimate the per-tick price change in historical data, I would be very grateful to hear them.
Thank you very much.