Struggling to use "apply to" indicator
OK, after another round of testing and checking, I apologize because the data is correct (it's related to RSI), but I cannot see the indicator on the backtest (or when I run the EA on the chart).
The indicator is always applied to the main chart.
I tried using ChartIndicatorAdd as well, but without success :(
For the tester - check TesterHideIndicators function.
As for ChartIndicatorAdd for regular charts, your words "without success" means nothing. You need to provide technical details, because it should work normally.

- www.mql5.com
For the tester - check TesterHideIndicators function.
As for ChartIndicatorAdd for regular charts, your words "without success" means nothing. You need to provide technical details, because it should work normally.
Hi, thank you for your help.
On the regular chart, I solved it by invoking ChartIndicatorAdd "with success" :) (it was my mistake) and now that works fine.
However, in the tester I cannot see the indicator. I mean, I can see all other indicators (I also tried to force TesterHideIndicators to false) but the indicator I'm applying is always attached to the main chart (though the values are correctly related to the RSI indicator).

- www.mql5.com
Hi, thank you for your help.
On the regular chart, I solved it by invoking ChartIndicatorAdd "with success" :) (it was my mistake) and now that works fine.
However, in the tester I cannot see the indicator. I mean, I can see all other indicators (I also tried to force TesterHideIndicators to false) but the indicator I'm applying is always attached to the main chart (though the values are correctly related to the RSI indicator).
Did you check visual mode in the Tester?

[T[he data is correct (it's related to RSI)...
The indicator is always applied to the main chart.
I just noticed a potential discrepancy in your Post #1.
A typical RSI indicator is not displayed in the main chart window. If you're using it, make sure that your ChartIndicatorAdd() function is referencing a separate/sub window.
I just noticed a potential discrepancy in your Post #1.
A typical RSI indicator is not displayed in the main chart window. If you're using it, make sure that your ChartIndicatorAdd() function is referencing a separate/sub window.
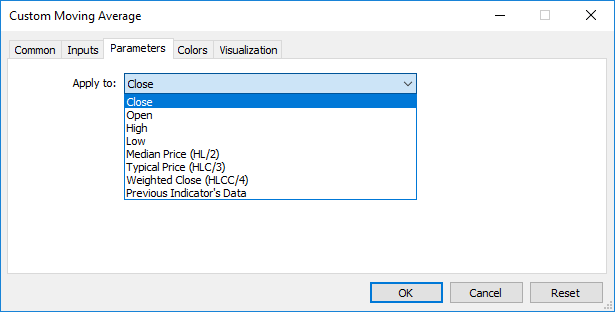
Hi Ryan, yes I checked the visualization. As I stated before, I can see all other indicators including the RSI indicator (in subwindows). What I cannot see is the indicator applied to RSI. To be clear --> https://www.mql5.com/en/docs/img/applyto.png, the indicator is applied/calculated on the data of another indicator. In my case, I can see it on the same subwindow on the live chart, but not on the tester.
Ah, I see. Got it.
I seem to recall having a problem mixing standard MQL5 indicator functions with iCustom() in the past--where iATR(), iStdDev(), and a custom MA (edited to subwindow) were called by my master indicator. I solved a strange conflict by changing over to all custom indicators.
Based on that experience, I would try replacing iRSI() with an iCustom call to the "factory" RSI indicator in your Indicators==>Examples folder.
yep, thank you for the hint! I changed from indicator_chart_window to indicator_separate_window and now i can see it, it is not on the same RSI subwindow, but i can see it.
You're welcome.
And by the way, you might be able to add them to the same subwindow by specifying the same subwindow number within the ChartIndicatorAdd() functions.
- Free trading apps
- Over 8,000 signals for copying
- Economic news for exploring financial markets
You agree to website policy and terms of use
Hi, I'm writing an EA and I'm trying to use the indicator "Linear Regression Value (apply to) - indicator for MetaTrader 5" --> https://www.mql5.com/en/code/50569
I'm trying to apply the indicator to the RSI indicator. Reading the documentation:
When you call a custom indicator from mql5-program, the Applied_Price parameter or a handle of another indicator should be passed last, after all input variables of the custom indicator.So I'm writing something like:
I have no errors, but the custom indicator is always applied to the main chart and not to the RSI subwindow.
Also, when I read the data, it refers to the prices and not RSI values.
I tried to use IndicatorCreate to instantiate the indicator, tried to instatiate (for testing pourpose) after the OnInit, cycling through the subwindow and so on, but nothing worked.
I'm a bit lost, any help is appreciated.
Thank you.