Indicators: PSAR Zigzag (Non lagging)
Just down loaded the indicator, and initial looks are great. It is really a novel idea to use pSAR for zigZag. We encounter it everyday to use as stop loss but never thought of using this way.
Thanks for sharing it.

@Conor Mcnamara
Just down loaded the indicator, and initial looks are great. It is really a novel idea to use pSAR for zigZag. We encounter it everyday to use as stop loss but never thought of using this way.
Thanks for sharing it.
No problem. It's confusing to code the vertices so it's non lagging to the current bar, but I prove that it can be done. If you want to alter the zigzag, it involves changing the sar step, because the zigzag religiously follows the sar trend change. If you increase the sar step by a fractional amount, the zigzag will be more sensitive to price changes. Decreasing sar step by a fractional amount will make it less sensitive to price changes.
Thanks for reply, I will try out the suggestion.
Supertrend is also good to create ZigZags... Each signal represents a High or Low, although it is lagging.
now that we have a trend-following zigzag code, it can basically be applied to all trend indicators. I applied it to the psar as it helps for the visualization of where the dots start and end, especially when the market ranges. The supertrend already has a good visualization I guess. It could be reconstructed with zigzag vertices, but many might be already already satisfied with how it is as it is using ATR line distance
now that we have a trend-following zigzag code, it can basically be applied to all trend indicators. I applied it to the psar as it helps for the visualization of where the dots start and end, especially when the market ranges. The supertrend already has a good visualization I guess. It could be reconstructed with zigzag vertices, but many might be already already satisfied with how it is as it is using ATR line distance
Now that people are satisfied with supertrend consider how good it could be to use zigzags detected based on supertrend to count waves.
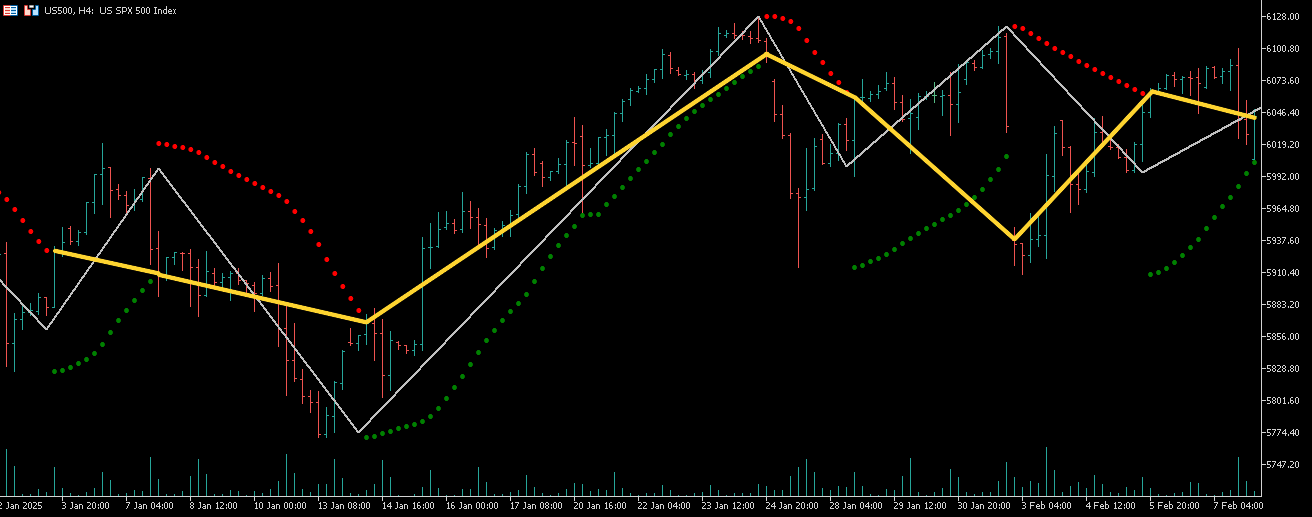
Extremely misleading image. If we mark up the close prices (where you'd actually be entering and exiting) rather than magical points in the air, the indicator is much worse.
Extremely misleading image. If we mark up the close prices (where you'd actually be entering and exiting) rather than magical points in the air, the indicator is much worse.
As written in the description, it follows the parabolic sar trend change. Also I wrote that it will find the most recent resistance or support if it can't link to a high or low on the trend change...so if you don't like the indicator, that's fine, you don't need to use it. It is literally a parabolic sar with a zigzag drawing. I made it clear that it isn't like a traditional zigzag that you're already familiar with. I don't see why you would like skewed looking legs as in your yellow drawing... this is why I implemented a backstep.
These "magical points in the air" are actually valid support and resistance points where someone could put a buy limit or sell limit if the market retreats to those zones. I made this indicator how I wanted to.
- Free trading apps
- Over 8,000 signals for copying
- Economic news for exploring financial markets
You agree to website policy and terms of use
PSAR Zigzag (Non lagging):
A zigzag based on the trend change of the parabolic sar
Author: Conor Mcnamara