Is there a pattern to the chaos? Let's try to find it! Machine learning on the example of a specific sample. - page 25
You are missing trading opportunities:
- Free trading apps
- Over 8,000 signals for copying
- Economic news for exploring financial markets
Registration
Log in
You agree to website policy and terms of use
If you do not have an account, please register
At TP=SL, it will be about 50%. At TP = 2*SL, it will be 33%, etc.
Always the average profit from 1 trade is very small. About 0,00005. But it will be spent on spread, slippage, swap, which are not taken into account in the teacher's markup (the spread is taken into account, but the minimum per bar, the real one will be higher).
And this Using TP=SL=0,00400. I.e. with a risk of 400 we get a profit of 5 pts, i.e. the advantage of 1%.
I would like to take at least 10 pts from the movement of 50 pts, but there all options are plum.
But this is all with my chips and targets. Perhaps there are better options.
This strategy gives 43% of profitable trades on EURUSD from 2008 to 2023, with TP/SL ratio of 61.8, and 39% of profitable trades are enough for breakeven. I haven't checked the numbers yet, I may be wrong somewhere, and these are of course ideal conditions. However, there is a learning perspective here, which means you can pull out a higher percentage at the expense of MO.
Regarding predictors, did you take my predictors from my article? They are often found in the models I have, among others.
Added: Yes, I did not take into account that there are profitable trades, but not closed by TP, and there will be less profit of course.This strategy gives 43% of profitable trades on EURUSD from 2008 to 2023, with TP/SL ratio of 61.8 in ideal conditions, and 39% of profitable trades are enough for breakeven. I haven't checked the numbers yet, I may be wrong somewhere, and these are of course ideal conditions. However, there is a learning perspective here, which means you can pull out a higher percentage at the expense of MO.
Regarding predictors, did you take my predictors from my article? They are often found in the models I have, among others.
Not really sure what your strategy is. It looks like you get a signal to enter once a day. I think it is very little to talk about the statistical significance of the results.
I trained your 5000+ predictors on your dataset. They don't give more than the same 5 pts, so I think they are no better than my simple price deltas and zigzags, which also give 5 pts.
I will check other ideas for now. If they don't give anything, I will try your predictors to generate my own model.
I don't really understand what your strategy is. It looks like a signal to enter once a day.
The strategy is as follows:
At the opening of the day we calculate the expected limit range of price movement, for this purpose we can use ATR(3) at the end of the last day, I use a slightly different formula. We postpone this range from the beginning of the opening of the current day (bar) - we consider it to be 100%.
When reaching a significant level above/below the opening (I stopped at 23.6 as it often turns out to be such on different instruments according to my observations), we open a position with TP on the next significant level (I use 61.8), and put SL on the opening price of the day.
If we closed at take profit, we enter again when a signal appears.
It is better to close at the end of the day (23:45) if the take-outs did not work, but in fact I am waiting for TP/SL.
Now the initial markup works like this - if we closed in profit, we put 1, if we closed in loss -1.
When splitting the sample, I made the target offset by 300 pips, so if the profit is less than 300 pips, it is zero.
I think this is very little to talk about the statistical significance of the results.
I took the data from 2008. Yes, there is not much data, but it depends on how you look at it, because if you consider that the level of 23.6 is not random and its crossing is significant for the market, then it will be like similar events that can be compared with each other, unlike the situation when generating entries on each bar - there are many similar events, which only complicates learning.
So I think it makes sense to train in this way, but the events that influence the decision of market participants should be different in different strategies. And, further trade sets of models.
I trained your 5000+ predictors on your dataset. They don't give more than the same 5 pts, so I think they are no better than my simple price deltas and zigzags, which also give 5 pts.
I will check other ideas for now. If they don't give anything, I will try your predictors to generate my own model.
Are you talking about the first sample or the second sample? If it is the first one, then I had an expectation matrix of about 30 points for good variants.
I can try to train your sample on CatBoost, if you upload it, of course.
Here's the strategy:
At the opening of the day we calculate the expected limit range of price movement, for this purpose we can use ATR(3) at the end of the last day, I use a slightly different formula. We postpone this range from the beginning of the opening of the current day (bar) - we consider it to be 100%.
When we reach a significant level above/below the opening (I stopped at 23.6 as it often turns out to be such on different instruments according to my observations) we open a position with TP on the next significant level (I use 61.8), and put SL on the opening price of the day.
If we closed at take profit, we enter again when a signal appears.
It is better to close at the end of the day (23:45) if the take-outs did not work, but in fact I am waiting for TP/SL now.
Now the initial markup works like this - if we closed in profit, we put 1, if we closed in loss -1.
When splitting the sample, I made the target offset by 300 pips, so if the profit is less than 300 pips, it is zero.
I took data from 2008. Yes, there is not much data, but it depends on how you look at it, because if we consider that the level of 23.6 is not accidental and its crossing is significant for the market, then these are similar events that can be compared with each other.
Now the target is more or less clear.
Do you have an estimate of the result in pips or just win/loss? Looks like the latter. It's better to estimate in pts.
So that the model giving 75% does not work in fact 50/50.
unlike the situation when inputs are generated on every bar - there are many such events, which only complicates learning.
I would like to add thinning - similar bars, if the price has not gone by 100...1000 pts, then skip.
Are you talking about the first sample or the second sample? If you are talking about the first one, then I had an expectation matrix of about 30 pips for good variants.
The second one on H1. Well, the first one was not better (but I researched it less, I did not select features, for example).
I can try to train your sample on CatBoost, if you upload it, of course.
I have hundreds of them. And I don't like any of them to put into trade. I change TP or SL or something else - that's a new variant. So there's no point.
Now the target is more or less clear.
Do you have an estimate of the outcome in points or just win/loss? Looks like the latter. It's better to estimate in pts.
So that a 75% model doesn't really work 50/50.
I have a valuation in money :) Plus target, as it used to be. The target can be moved later, if you want more points.
In the specific strategy now everything is take profit. I made a calculated lot, in fact it turned out that the spread worsens the proportion significantly, but it's fine, but there will be stability without emissions of super profitable entries - the risk is almost the same everywhere. If you then use the pauses, you will be able to improve the result.
I would like to add thinning - similar bars, if the price has not gone by 100...1000 pts, then skip.
And then evaluate on each bar, well model to apply?
The second one on H1. Well, the first one was not better, (but I researched it less, I did not select chips for example).
I have hundreds of them. And none of them I like to put in the trade. I change TP or SL or something else - that's a new variant. So there is no point.
My point is that if there is the same algorithm for creating a sample, it will be possible to compare predictors.
And then to estimate at each bar, well the model to apply?
Yes, if at least XX pips have passed, as in training. But there will be distortions - only the first bars from 100 to 120 (200-220, etc.) if up and 999-979 (899-979) will work more often.
My point is that if there is the same algorithm for creating a sample, it will be possible to compare predictors.
I don't really want 5000+, it will take a long time to count. But as a search for significant predictors it may be necessary to check them.
Good afternoon!
I have one approach that can solve this problem, but preferably the sample files should be without predictors. I.e. 5000+ predictors are not needed, only the motion graph itself. Whether it consists of OHLC or has one variable is not important. However, I tried the existing method on one variable from the sample, namely on column 5584, which I converted into a chart using the formula D(i)=D(i-1)+ Target_100_Buy . For all three files I got these graphs:
1) train: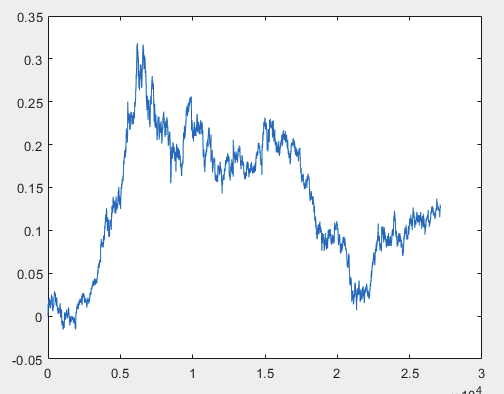
2)test: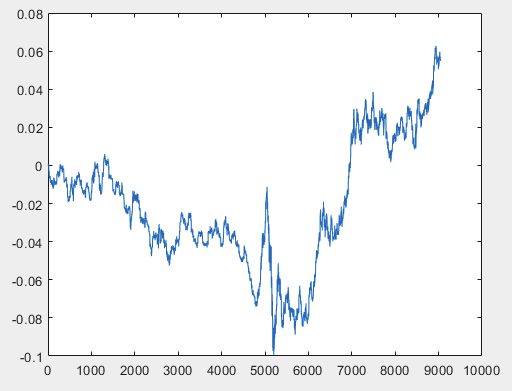
3)exam: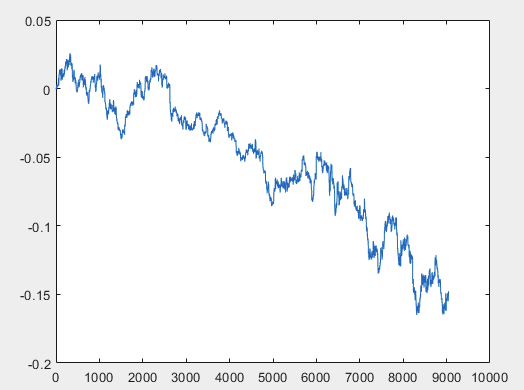
I don't know whether I did it correctly or not, but if the topikstarter makes new samples without predictors, I will test the method on new data and tell you about the approach.
Well, and the actual profit for each of the samples after training the committee of neural networks (there are 10 of them in total). Profit is expressed in the number of points, with spread=0 and commission=0:
1) train: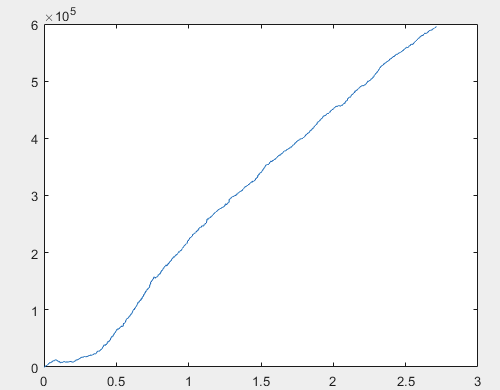
2) test: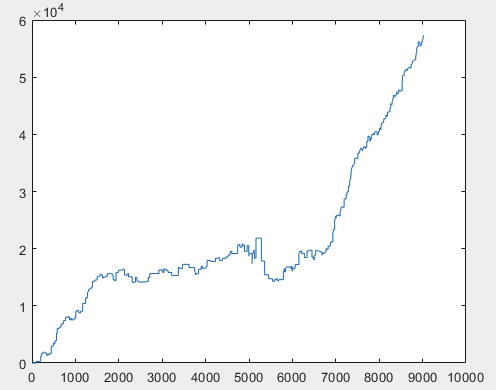
3) exam: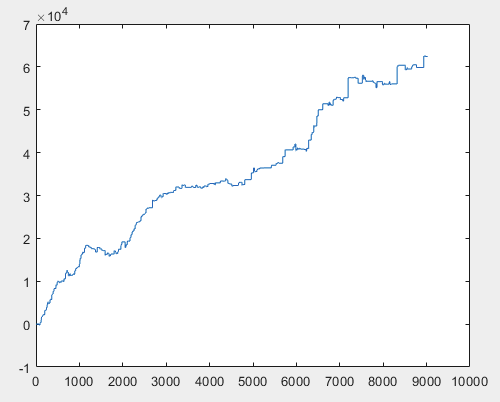
I think the result of 60000+ pips is quite acceptable.
I suggest the topikstarter to make new samples, only of the most "chaotic" signal.
The method will be applied to the new signal and the results will be shown, as well as the approach will be described to a certain extent.
Regards, RomFil!
P.S. The future is not known, but a method to control it can always be found ... :)
Good afternoon!
I have one approach that can solve this problem, but preferably the sample files should be without predictors. I.e. 5000+ predictors are not needed, only the motion graph itself. Whether it consists of OHLC or has one variable is not important. However, I tried the existing method on one variable from the sample, namely on column 5584, which I converted into a chart using the formula D(i)=D(i-1)+ Target_100_Buy . For all three files, the graphs are as follows:
I don't understand what you did and why a new sample is needed if your approach works with pure prices.
The columns from the list below are the result of the event that happened, i.e. they should not participate in the training. At most 5582 - but there I think it is easy to predict, so it will be recovered by the model as it is.
5581 Auxiliary
5582 Auxiliary
5583 Label
5584 Auxiliary
5585 Auxiliary
I don't understand what you did and why a new sample is needed if your approach works with pure prices.
The columns from the list below are the result of an event that happened, i.e. they should not participate in the training. At most 5582 - but I think it is easy to predict, so it will be recovered by the model.
5581 Auxiliary
5582 Auxiliary
5583 Label
5584 Auxiliary
5585 Auxiliary
"What did I do?":
The sample train is about 1GB in size. It takes quite a long time to load it into the workspace. I have an i5-3570 with 24GB of RAM and a fast SSD and it takes several minutes for Excel to open this file. That's why I decided that it should be shortened. I was too lazy to figure out the superscripts for 5000+ columns. I took 5584 5586 column and applied a signal to all rows, for example BUY (honestly, I don't remember which one, maybe SELL). Thus, this column formed a chart according to the above formula. I.e. the first step was zero, then 0.00007, then 0.00007-0.00002=0.00005, then 0.00005+0.00007=0.00012, etc. I.e. from column 5584 5586 I have formed a motion chart with no binding, so to speak a relative motion chart. As if it were a Close chart, i.e. at the end of each step of the chart the price of the asset changes by the corresponding value.
P.S. Cheated about the column number ... I took the most recent 5586 (I just looked it up in Excel) with the SELL signal.
"... why a new sample":
To show and tell in a certain amount about the approach on its example. If you name the numbers of columns where you can take OHLC or just Clause prices, it will be enough.
About the rest:
The data from the sample files is not used at all. On the basis of columns 5584 5586 from each file, a graph is made as described above. And the approach is already applied to these obtained graphs.
Well, since the topikstarter does not want to give new samples, I suggest anyone interested to post their own ... :)
Regards, RomFil!
Good afternoon!
I have one approach that can solve this problem, but preferably the sample files should be without predictors. I.e. 5000+ predictors are not needed, only the motion graph itself. Whether it consists of OHLC or has one variable is not important. However, I tried the existing method on one variable from the sample, namely column 5584, which I converted into a chart using the formula D(i)=D(i-1)+ Target_100_Buy . For all three files, the graphs are as follows:
Repeatability of the target function is trained? For example, if it was successful 20 times, will it be successful 21 times?
How many values do you input as predictors?
Here are the simplest targets for buy and for sell with TP/SL=50 pts
M5 for about 5 years.
The markup is on each M5 bar, i.e. most likely the trade from the last signal (5 min ago) has not finished yet. I'm not sure it would be correct to stack them. Stacking would be ok for a target with only 1 trade at 1 moment in time - even 100 at the same time may not be completed overnight.
P.S. - I have them untrainable. They always fail on my set of predictors.