help for dragged chart
Your question is unclear. We have no ideia what is supposedly wrong with your chart nor what you expect it to look like.
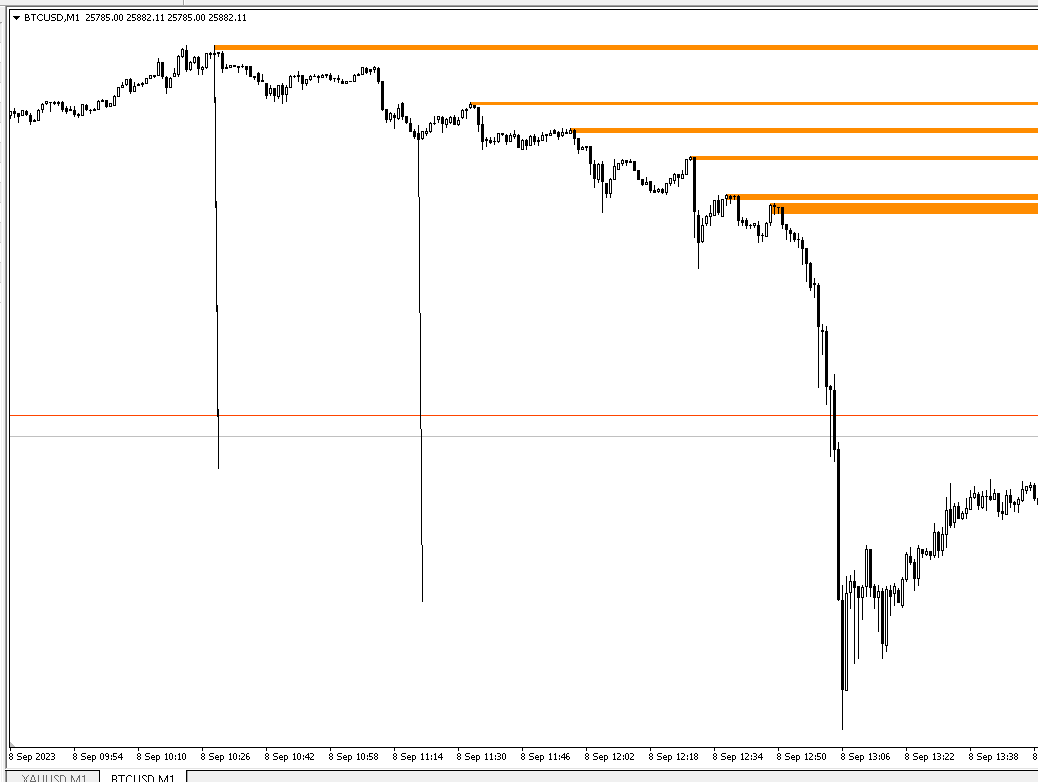
If you are referring to those strange almost vertical black lines, then please say so. We do not know if that is expected or not.
Remember, that we cannot read your mind, so please explain in detail what it is that you expect to see on your chart and what does not correspond with your expectations.
Also, you will have to show your code if you want help in correcting it.
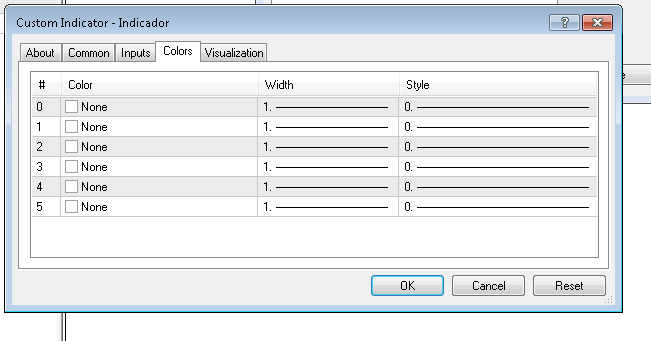
But I already managed to discover the problem, in the indicator's color tab, 6 color selections appear, all in black.
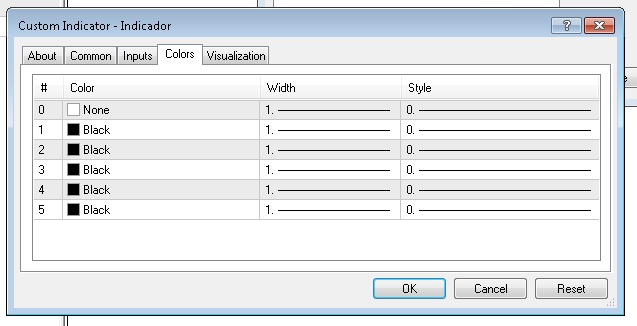
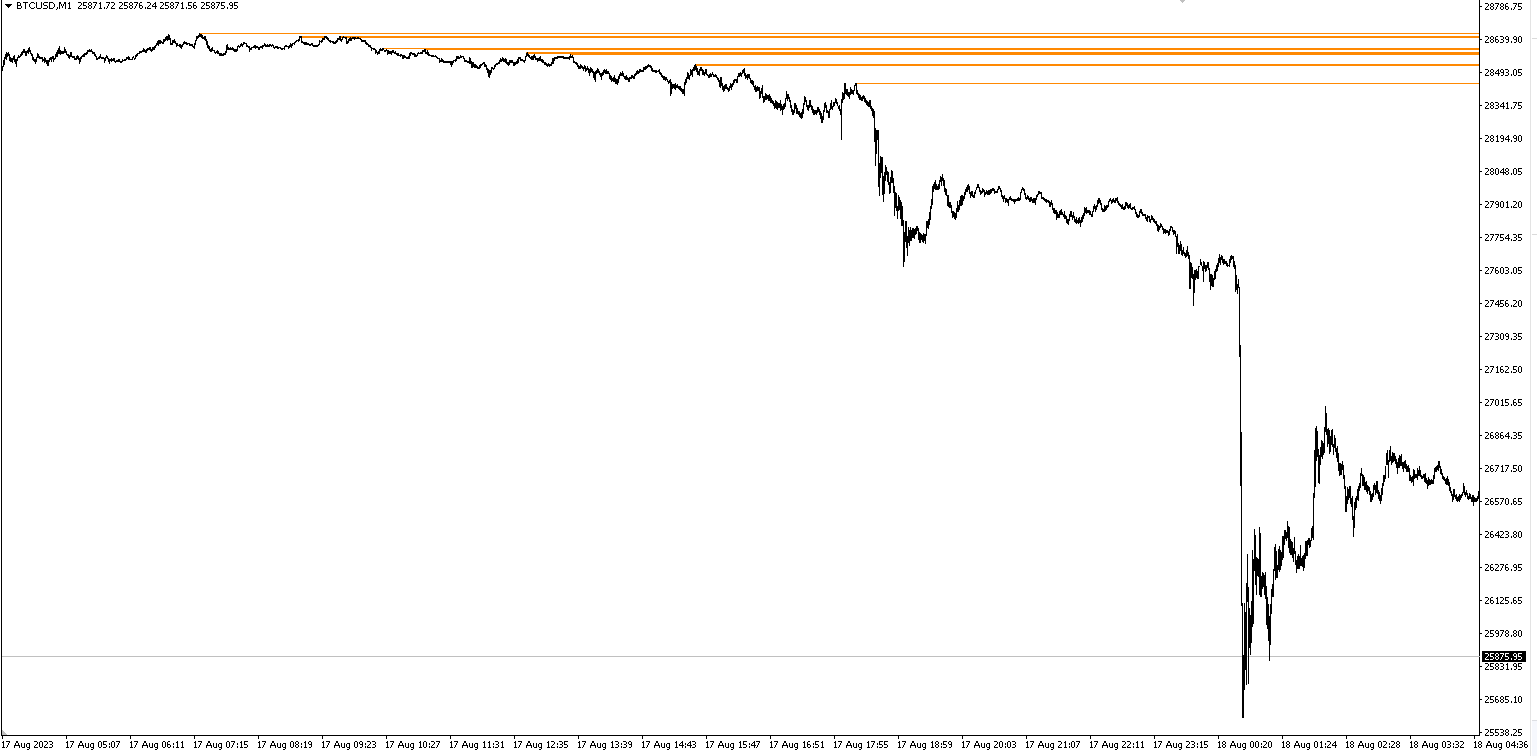
I changed it to other colors, and this is actually what makes the vertical lines.
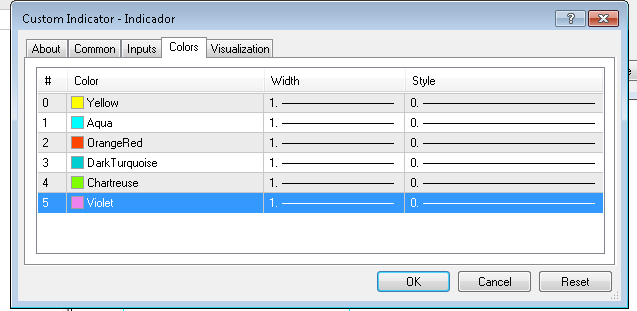
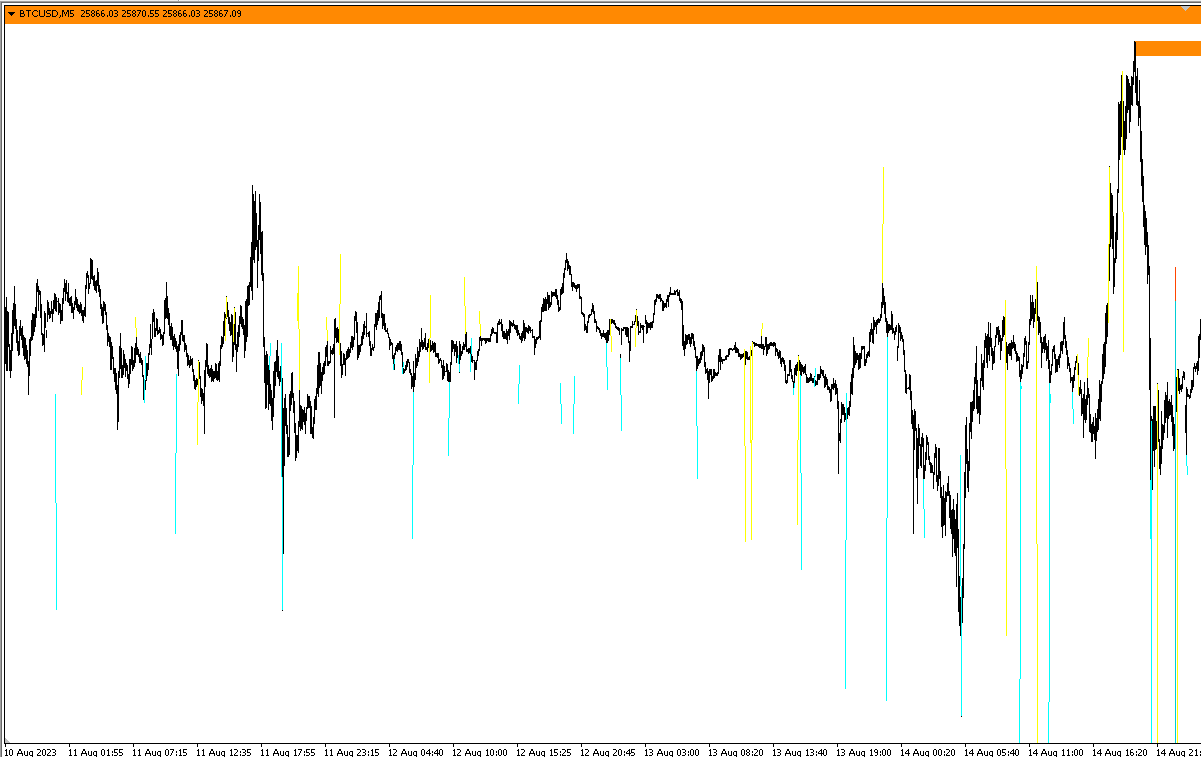
and this happens:
However, if you set it to "NONE", it is resolved. Now I'm trying to figure out how I code these colors to "NONE". It seems to me that there is something related to the list of "Buffers" that I use in the indicator.
and clean chart:
Therefore, if the graph is clean, with all colors set to "NONE", the indicator will already present correct calculations for the objects that I intend to draw.
Yes, the problem is the vertical lines that I don't create.
But I already managed to discover the problem, in the indicator's color tab, 6 color selections appear, all in black.
I changed it to other colors, and this is actually what makes the vertical lines.
and this happens:
However, if you set it to "NONE", it is resolved. Now I'm trying to figure out how I code these colors to "NONE". It seems to me that there is something related to the list of "Buffers" that I use in the indicator.
and clean chart:
Therefore, if the graph is clean, with all colors set to "NONE", the indicator will already present correct calculations for the objects that I intend to draw.
If you don't want those plots to appear, then set the number of plots to lower number and set your indicator buffers to "Calculation" mode and not "Data" mode.
If you don't want those plots to appear, then set the number of plots to lower number and set your indicator buffers to "Calculation" mode and not "Data" mode.
Thank you Fernando,
I have already updated the indicator with what you told me and the problem persists.
I tried:
#property indicator_plots 0 (and i tried with 10 and 3 and 1)
and i set this too:
SetIndexBuffer(0, HPivots, INDICATOR_CALCULATIONS);
However, I put the following in all buffers and it was resolved (apparently):
SetIndexStyle(0,DRAW_NONE,EMPTY,EMPTY,clrNONE);
From what I understand, now with more attention and experimenting with charts of other currency pairs that you hadn't opened before. Those lines appear when I slide the chart to see the history of a currency pair.
As if the indicator wants to make calculations, but as it doesn't have enough history, it generates those "errors".
In my case I have the code to run the entire chart, which in turn is limited to 65000 bars. But sometimes what I have in history is less than 65000 bars. Is there any way for the indicator to force the download of the remaining history until it reaches, for example, 65000 bars?
Improperly formatted code edited by moderator. Please use the CODE button (Alt-S) when inserting code.
Setting the colour to "clrNONE" is not a good solution, because those plot values are still going to appear in the Data Window and the end user may still try to changes the colours in the Indicator properties, which is not ideal.
If you are willing to show your full code in the forum, it might be good for you to do so, that we can help you fix it correctly.
I just realised that your question is about MQL4 and not MQL5.
SetIndexStyle(0,DRAW_NONE,EMPTY,EMPTY,clrNONE);
MQL4 does not have "plots", only buffers. It works differently. You need to control the number of display buffers and internal buffers in a different way to MQL5.
"INDICATOR_CALCULATIONS" has no effect on MQL4 and you will need to control it via the IndicatorBuffers function.
So, it really is more beneficial for you to show your code to have some guidance on how to fix it properly.
I have also moved your thread to the section: MQL4 and MetaTrader 4. It is really very important for you to consider the appropriate section or you will get the wrong answers.
PS! I should have paid more attention to your initial screenshots. Now that I look at them again I can see that they are MetaTrader 4 and not 5.

- docs.mql4.com
This is my first version of the indicator and it was where I started to notice that some lines appear when sliding the chart to see the history of a currency pair.
//+------------------------------------------------------------------+
//|                                                    Indicador.mq4 |
//|                                                     CésarAlmeida |
//|                    https://www.mql5.com/en/users/cesarericeira95 |
//+------------------------------------------------------------------+
#property copyright "CésarAlmeida"
#property link      "https://www.mql5.com/en/users/cesarericeira95"
#property version   "1.00"
#property strict
#property indicator_chart_window
#property indicator_buffers 2

//+------------------------------------------------------------------+
//--- input parameters
//+------------------------------------------------------------------+
input int period = 5;         // Highs/Lows search period (5=Default)
input int bars = 0;           // Number of candles to calculate (0=Unlimited)
//+------------------------------------------------------------------+
//--- Buffers/Variaveis
//+------------------------------------------------------------------+
double HPivots[];
double LPivots[];
//+------------------------------------------------------------------+
//| Custom indicator deinitialization function                       |
//+------------------------------------------------------------------+
void OnDeinit(const int reason)
  {
   ObjectsDeleteAll();
   ArrayFree(HPivots);
   ArrayFree(LPivots);
  }
//+------------------------------------------------------------------+
//| Custom indicator initialization function                         |
//+------------------------------------------------------------------+
int OnInit()
  {
//--- indicator buffers mapping
   SetIndexBuffer(0, HPivots);
   SetIndexBuffer(1, LPivots);
   SetIndexLabel(0, "Highs Pivots");
   SetIndexLabel(1, "Lows Pivots");
   //SetIndexStyle(0,DRAW_NONE,EMPTY,EMPTY,clrNONE);
   //SetIndexStyle(1,DRAW_NONE,EMPTY,EMPTY,clrNONE);
//---
   IndicatorSetInteger(INDICATOR_DIGITS,Digits);
//---
   return(INIT_SUCCEEDED);
  }
//+------------------------------------------------------------------+
//| Custom indicator iteration function                              |
//+------------------------------------------------------------------+
int OnCalculate(const int rates_total,
                const int prev_calculated,
                const datetime &time[],
                const double &open[],
                const double &high[],
                const double &low[],
                const double &close[],
                const long &tick_volume[],
                const long &volume[],
                const int &spread[])
  {
   int barras;
   if(bars==0 || bars>rates_total-period*2){barras=rates_total-period*2;} else{barras=bars;} //Ajustar numero de velas a calcular
//---
   if(prev_calculated < rates_total){calcularHL(barras);}
//--- return value of prev_calculated for next call
   return(rates_total);
  }
//+------------------------------------------------------------------+
void calcularHL(int barras)
{
   for(int i = period; i < barras;i++){               //ciclo para ver Highs/Lows
      int bari1=iHighest(NULL,0,MODE_HIGH,period,i);  //procura o mais alto do primeiro periodo
      HPivots[bari1]=High[bari1];                     //actualiza o index
//---
      bari1=iLowest(NULL,0,MODE_LOW,period,i);  //procura o mais baixo da primeira parte
      LPivots[bari1]=Low[bari1];                //actualiza o index
   }
}
At the moment I don't have these codes as they are not the correct solution or recommended for MQL4.
#property indicator_plots 0
and
SetIndexBuffer(0, HPivots, INDICATOR_CALCULATIONS);
and
SetIndexStyle(0,DRAW_NONE,EMPTY,EMPTY,clrNONE);
For now of the things I tried, this last part of the code was the one that apparently solved it. I've been checking other currency pairs and timeframes, with this code it's already resolved and in the data window everything seems to be correct.
My intention is not to draw anything on the graph, just a rectangle that I will later draw.
If you don't want to draw anything via the "buffers" then set the number of displayed buffers to 0:
#property indicator_buffers 0 // Number of buffers displayed
And set the number of allocated buffers to the number of buffers used for calculations:
//--- indicator buffers mapping
   IndicatorBuffers(2); // Number of buffers allocated, used for calculations
   SetIndexBuffer(0, HPivots);
   SetIndexBuffer(1, LPivots);
Please reference the documentation for a complete example ... IndicatorBuffers - Custom Indicators - MQL4 Reference

- docs.mql4.com
- Free trading apps
- Over 8,000 signals for copying
- Economic news for exploring financial markets
You agree to website policy and terms of use
Hi everyone, I'm developing an indicator and as soon as I started developing it, I left the indicator running for 3 hours and the chart appears like this. How can I solve? I've had the indicator for some time and only recently has it been like this... I don't really understand the problem but I suspect it's when my indicator draws on the chart at the same time that the chart shows the new candle. This is what practically always happens in periods of low volatility.
Any suggestions/thoughts?
Thank you