EMA Color
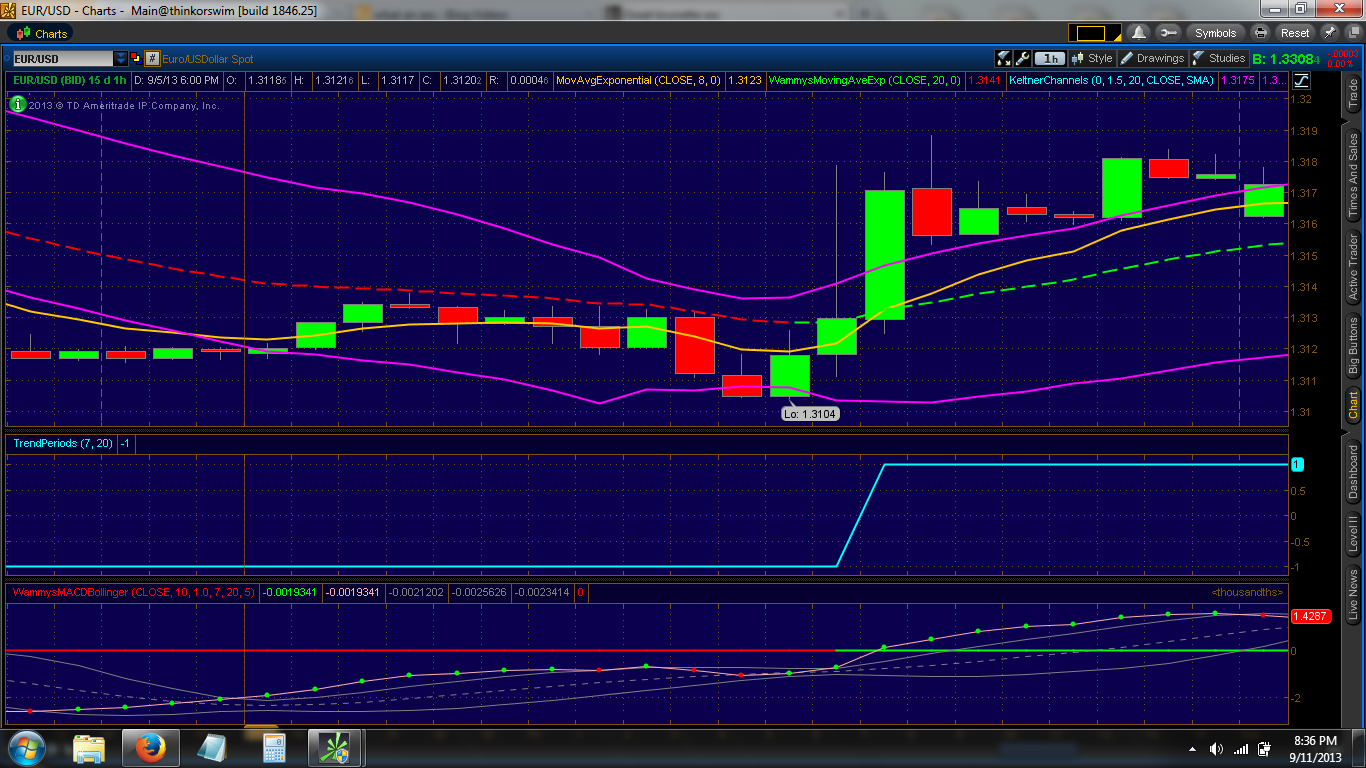 Why does the EMA in color have the line breaks? How can i have it all continuous like the one i have in ThinkorSwim? Also how can i change the line style and width at the same time? It seems with alot of these indicators you can only change one or the other. Please and thankyou.
- How can I change the color of one only bar
- how can change color for indicator line & an object and they must have same color ?
- XP Volume!
Are you referring to 2 custom indis?
If you have the source code, then you can change it.
If you don't have the source code and the option does not appear in the input parameters, then you can't.
Try changing the chart background colour, sometimes part of the line is the same colour and so doesn't show.
check/uncheck this: F8 / common / chart on foreground.
looks to me the line is build with 2 buffervalues
when there is a buffervalue for bar[x-1] and for bar[x] you see the line between those points
moment you see no color then 'trend' change and the value is gone to other buffer
displaying line with dots gives a nicer outlook then what you see now a broken line
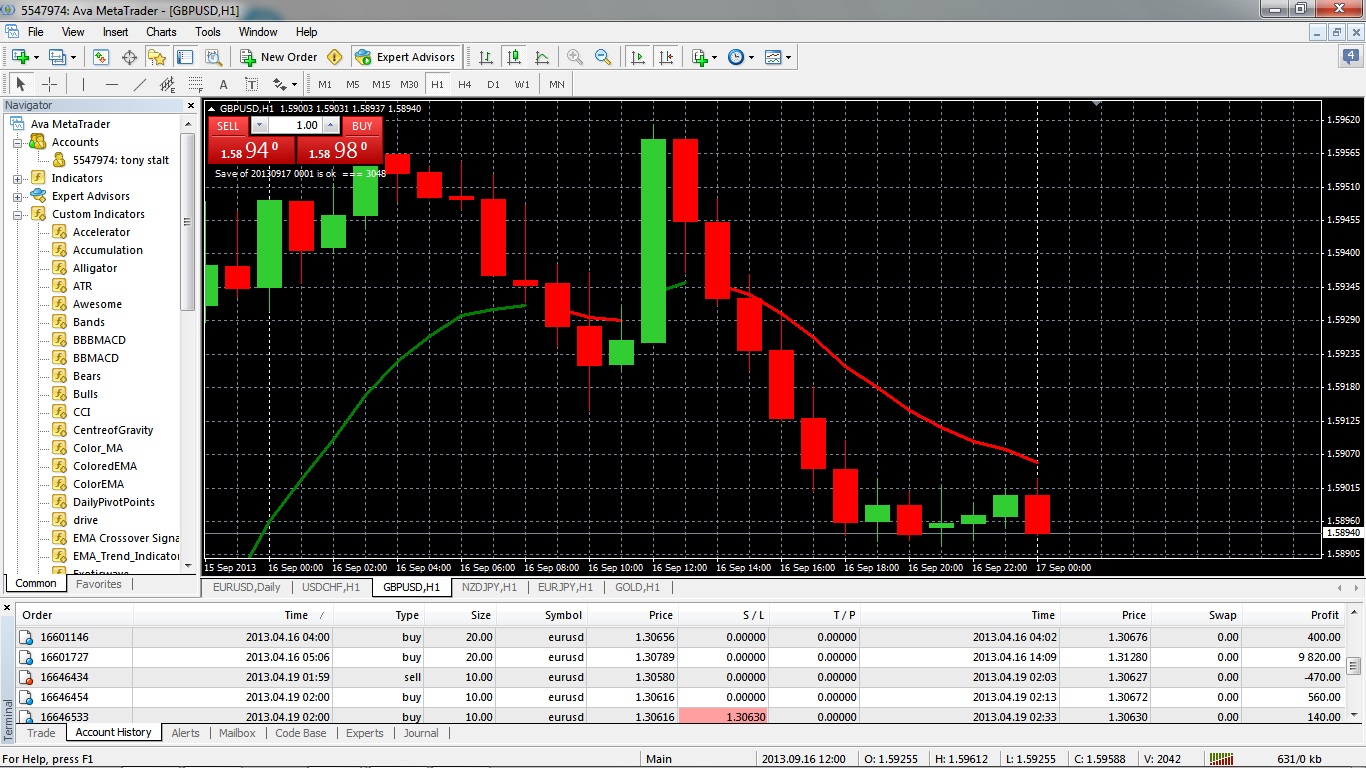
tonythetiger: Why does the EMA in color have the line breaks? How can i have it all continuous
- Because the coder didn't code it correctly. When the color changes, both buffers must have the same value.
- Get the code and fix it.
You are missing trading opportunities:
- Free trading apps
- Over 8,000 signals for copying
- Economic news for exploring financial markets
Registration
Log in
You agree to website policy and terms of use
If you do not have an account, please register