I cannot display both the high and low daily lines
Please edit your post (don't create a new post) and replace your code properly (with "</>" or Alt-S), or attach the original file directly with the "+ Attach file" button below the text box.
NB! Very important! DO NOT create a new post. EDIT your original post.
You are giving the same "name" to both objects, using the symbol name as the name of the objects.
Please use distinct names for each object (and not just the symbol name) — Documentation on MQL5: Object Functions / ObjectCreate
From next time, I will be more careful.
Thank you very much for the explanation.
Finally, I was able to fix the index code."
void DeMarker()
  {
   double DeMarker_Value =iDeMarker(_Symbol,_Period,14,0);
   string DeMarker_Value_String = DoubleToStr(DeMarker_Value, 2);
   Alert("The DeMarker Indicator Value is: " + DeMarker_Value_String);
  }
Hi,
I would like to create a dashboard with 28 rows and 14 columns using classes. However, I am having trouble with the 12th and 13th columns as they are not displaying correctly on the chart (please refer to the attached photo). I would greatly appreciate your help in resolving this issue.
Thank you.
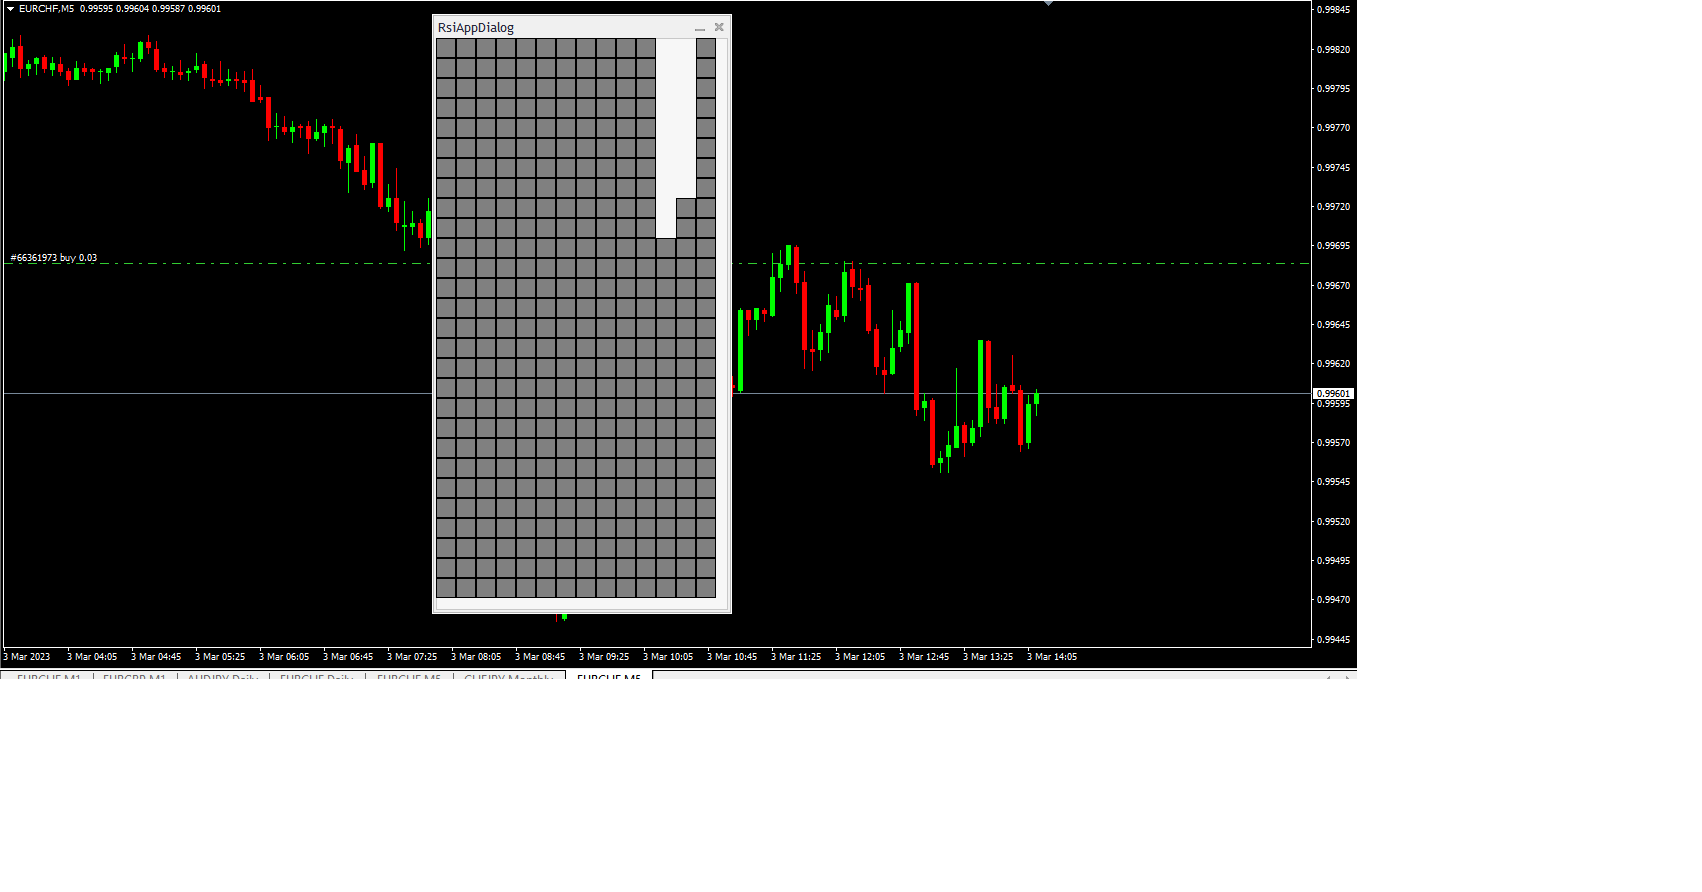
#include <Controls\Dialog.mqh>
CAppDialog RsiAppDialog;
CPanel OurPanelArray[14][28];
int panelWidth=20,panelHeight=20;
int AppDialogTop=10,AppDialogLeft=30,AppDialogWidth=300,AppDialogHeight=600;
//+------------------------------------------------------------------+
//| Custom indicator initialization function                         |
//+------------------------------------------------------------------+
int OnInit()
  {
   RsiAppDialog.Create(0,"RsiAppDialog",0,AppDialogLeft,AppDialogTop,AppDialogLeft+AppDialogWidth,AppDialogTop+AppDialogHeight);
   CreatePanels();
//   RsiAppDialog.Add("OurPanel");
   RsiAppDialog.Run();
   return(INIT_SUCCEEDED);
  }

//+------------------------------------------------------------------+
//| Custom Indicator De-Initialization                               |
//+------------------------------------------------------------------+
void OnDeinit(const int reason)
  {
   RsiAppDialog.Destroy(reason);
  }

//+------------------------------------------------------------------+
//| Custom indicator iteration function                              |
//+------------------------------------------------------------------+
int OnCalculate(const int rates_total,
                const int prev_calculated,
                const datetime &time[],
                const double &open[],
                const double &high[],
                const double &low[],
                const double &close[],
                const long &tick_volume[],
                const long &volume[],
                const int &spread[])
  {
//---
//--- return value of prev_calculated for next call
   return(rates_total);
  }
//+------------------------------------------------------------------+
//| ChartEvent function                                              |
//+------------------------------------------------------------------+
void OnChartEvent(const int id,
                  const long &lparam,
                  const double &dparam,
                  const string &sparam)
  {
//---
   RsiAppDialog.OnEvent(id,lparam,dparam,sparam);
  }
//+------------------------------------------------------------------+
//|  Function to create panels                                       |
//+------------------------------------------------------------------+
void CreatePanels()
  {
   int left=0;
   int right=left+panelWidth;
   int top =0;
   int bottom =top+panelHeight;

   for(int i=0; i<14; i++)
     {
      for(int j=0; j<28; j++)
        {
         OurPanelArray[i][j].Create(0,string(i)+string(j),0,left,top,right,bottom);
         OurPanelArray[i][j].ColorBackground(clrGray);
         OurPanelArray[i][j].ColorBorder(clrBlack);
         RsiAppDialog.Add(OurPanelArray[i][j]);
         top+=panelHeight;
         bottom+=panelHeight;
        }
      top=0;
      bottom=top+panelHeight;
      left+=panelWidth;
      right=left+panelWidth;

     }
  }
- Free trading apps
- Over 8,000 signals for copying
- Economic news for exploring financial markets
You agree to website policy and terms of use
Hi
I cannot display both the high and low daily lines with the next code
Please help
Thanks
void Dayly_High_Low_Lines()
{
double Low_price=iLow(Symbol(),PERIOD_D1,0);
ObjectCreate(0,Symbol(),OBJ_HLINE,0,0,Low_price);
ObjectSet(Symbol(),OBJPROP_COLOR,clrRed); // changing the color of the lower line
ObjectSet(Symbol(),OBJPROP_WIDTH,2); // now the lower line will be dashed
double High_price=iHigh(Symbol(),PERIOD_D1,0);
ObjectCreate(0,Symbol(),OBJ_HLINE,0,0,High_price);
ObjectSet(Symbol(),OBJPROP_COLOR,clrGreen); // changing the color of the Higher line
ObjectSet(Symbol(),OBJPROP_WIDTH,2); // now the Higher line will be dashed
Alert("The Daily Low price is: " + DoubleToStr(Low_price, Digits));
Alert("The Daily High price is: " + DoubleToStr(High_price, Digits));
}