Discussion of article "Non-linear indicators"
Interesting ideas, something to work with. :)
Thanks for the article!
the median does not always coincide with the moving average... rather, they most often do not coincide. The median is a rigid structure (for example, if you draw trend lines along it, you will get a completely different picture).
And the non-coincidence happens precisely because the median is very stable, even on short periods.... Try to compare your indicator with Bayesian smoothing
the median is not always the same as the moving average.... rather, they most often do not coincide. The median of medians is a rigid structure (for example, if you draw trend lines along it, you will get a completely different picture)
And the non-coincidence happens precisely because the median is very stable, even on short periods.... Try to compare your indicator with Bayesian smoothing
Oh, yeah, I wasn't paying attention.
Oh, I see
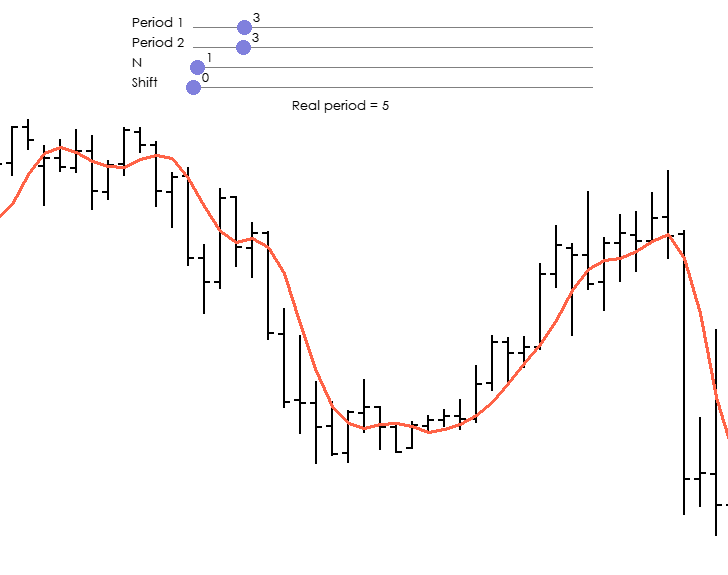
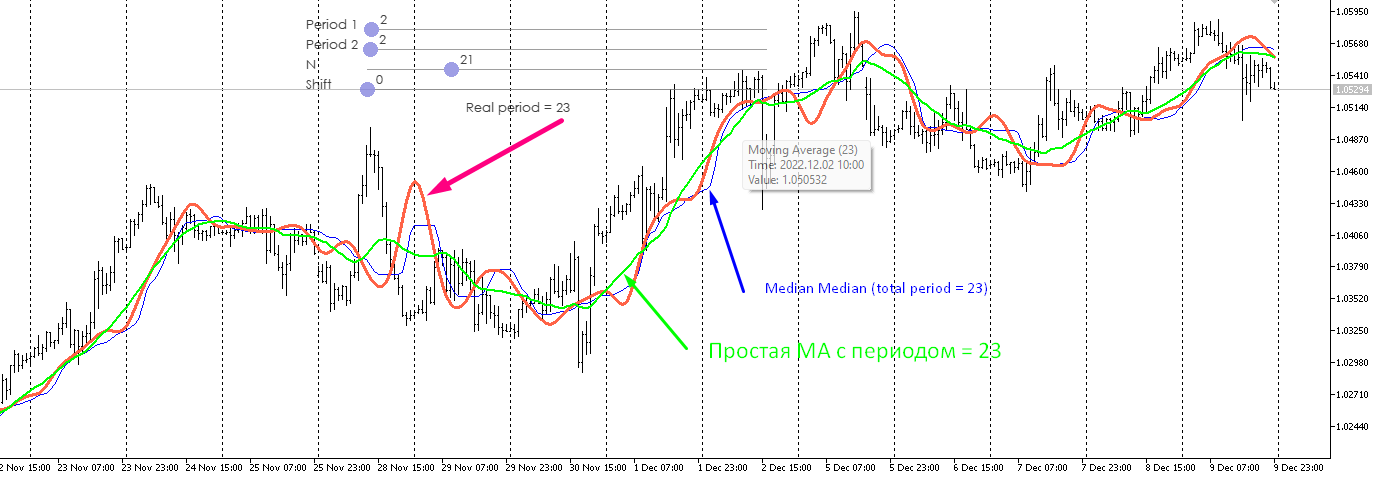
I looked in the code.
It says one thing, but the graph shows something else. The period is not 3 from 3, but 14 from 14.
I.e. the indicator shows one value from the last 23 values.
I analysed it and compared it with other moving types. Unfortunately, I did not find any advantages, despite the significantly higher computational load due to sorting.
The conclusion is the same.
All attempts of any manipulations with the previous data of a certain size (period) - add, multiply, divide, increase in degree, take a logarithm, etc., to get a new line - currently makes no sense, because all these numerous indicators (lines) predict further price behaviour on the next bar (down or up) with a probability close to the probability of heads or tails of a tossed coin. This is easily checked and proved.
ah, I see
I looked into the code.
It says one thing, but on the chart it is quite different. The period is not 3 from 3, but 14 from 14.
I.e. the indicator shows one value from the last 23 values.
I analysed it and compared it with other slides. Unfortunately, I did not find any advantages, despite the significantly higher computational load due to sorting.
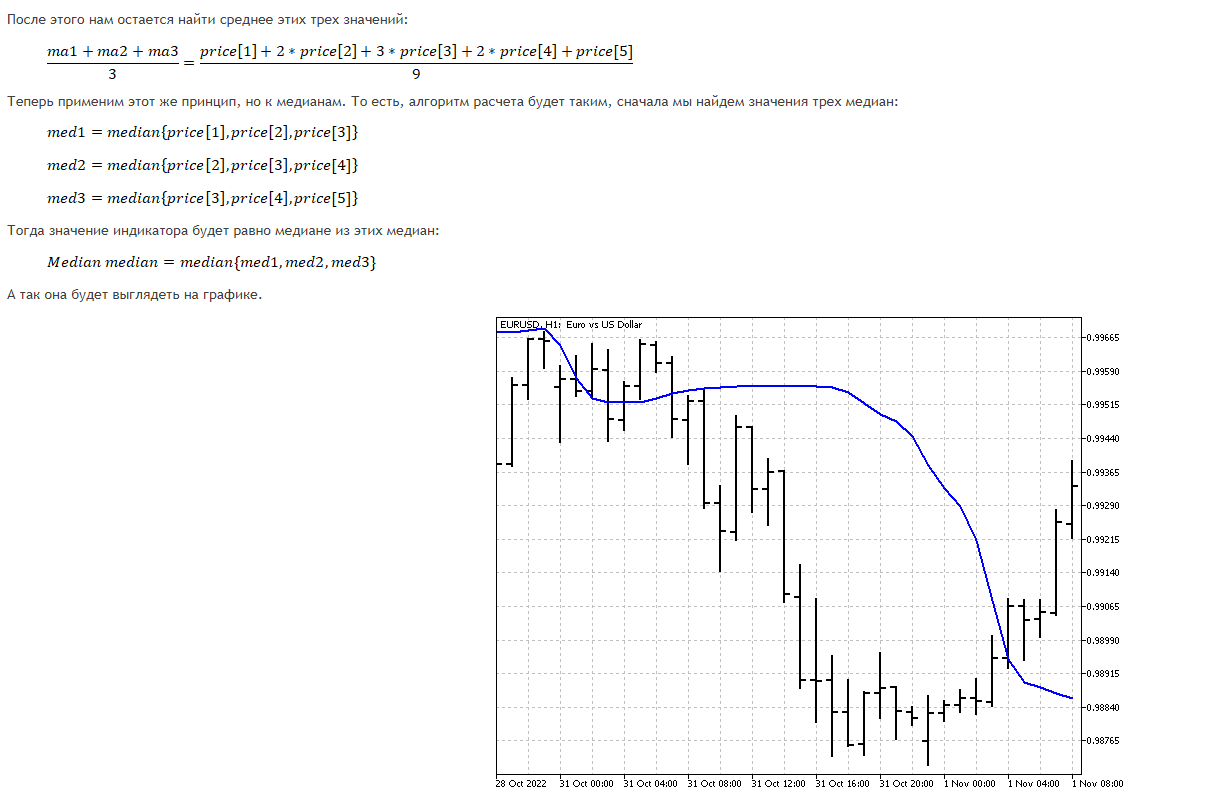
It is better to compare the median in this form with a triangular window. The most "tasty" situation for it is a change of the trend direction to the opposite one. If you need a more sensitive variant, it is better to do it this way. First we find the median from one last price, then we find the median from two prices, then from three, etc. At the end we find the median of all previously found prices. We get the analogue of a linear weighted average. This will not get rid of the main disadvantage of the median - loss of information on the edges, but will make the indicator more sensitive to current changes.
The median of medians in this form is better compared to a triangular window. The most "tasty" situation for it is a change of the trend direction to the opposite one. If you need a more sensitive variant, it is better to do it this way. First we find the median from one last price, then we find the median from two prices, then from three, etc. At the end we find the median of all previously found prices. We get the analogue of a linear weighted average. This will not get rid of the main disadvantage of the median - loss of information on the edges, but will make the indicator more sensitive to current changes.
nah - all in vain.
Just as all my previous attempts of many years ago to develop various methods of clustering and averaging and create hundreds of robots with their application were in vain. Believe me, I have succeeded much more in this. There are no white spots left in this field.
Only AI with pattern and process recognition remains.
You will come to it anyway, if you do not tread on the ground.
Oh, yeah, I wasn't paying attention.
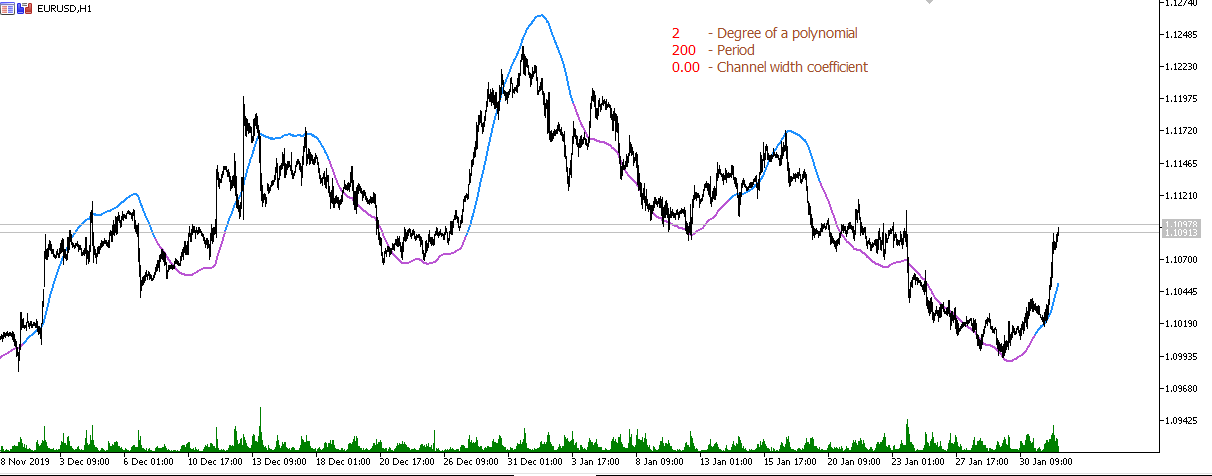
If you want to fight lag, you have to use an appropriate model. For example, we plot a third degree polynomial forward by 20 points. We get the coefficients {4979,3264,1904,864,109,-396,-686,-796,-761,-616,-396,-136,129,364,534,604,539,304,-136,-816} /8855 - such an indicator will not lag
if we struggle with lag, we need to take an appropriate model. For example, we construct a third degree polynomial forward by 20 points. We get the coefficients {4979,3264,1904,864,109,-396,-686,-796,-761,-616,-396,-136,129,364,534,604,539,304,-136,-816} /8855 - such an indicator will not lag behind
long ago everything has been implemented, checked, rechecked, tested, retested. There is no fish. More precisely, the existence of fish is always temporary, and the rest of the time levelling temporary success.
if we struggle with lag, we need to take an appropriate model. For example, we construct a third degree polynomial forward by 20 points. We get the coefficients {4979,3264,1904,864,109,-396,-686,-796,-761,-616,-396,-136,129,364,534,604,539,304,-136,-816} /8855 - such an indicator will not lag behind
The polynomial itself is redrawn, so the value is its trace, which forms a non-drawn sliding line.
Indeed, you can achieve a minimum lag, but there begin other problems.
Forum on trading, automated trading systems and testing trading strategies.
Nikolai Semko, 2020.02.01:09
Simple moving average (period 200):

Moving average from linear regression (period 200):

Moving average from parabolic regression (period 200):
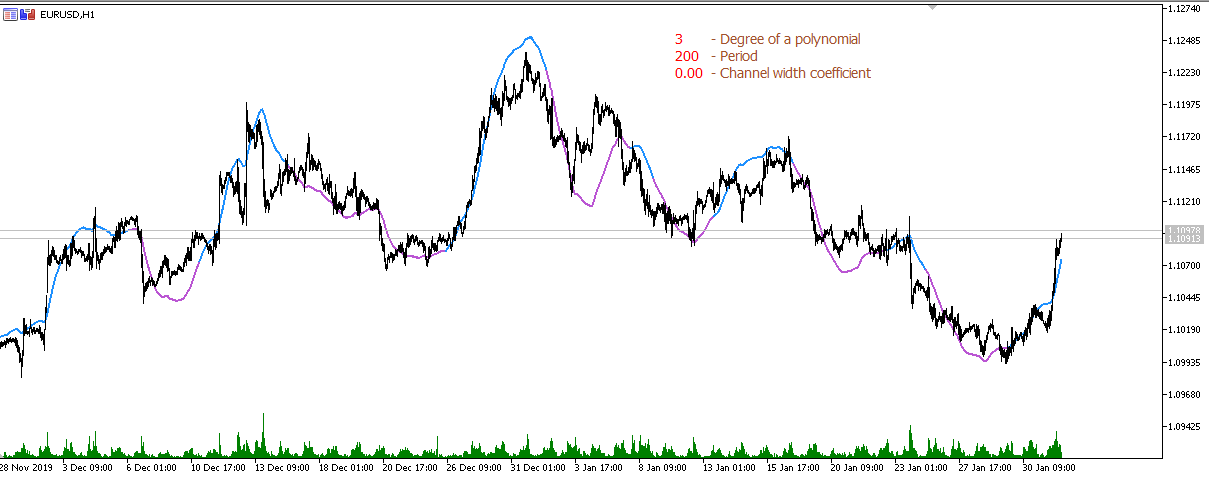
Moving average from a 3rd degree polynomial (Period 200):
Moving average from a 4th degree polynomial (Period 200):

Moving average from a 5th degree polynomial (Period 600):

etc.
- Free trading apps
- Over 8,000 signals for copying
- Economic news for exploring financial markets
You agree to website policy and terms of use
New article Non-linear indicators has been published:
In this article, I will make an attempt to consider some ways of building non-linear indicators and their use in trading. There are quite a few indicators in the MetaTrader trading platform that use non-linear approaches.
The mode is the value that occurs most frequently in the data sample. For example, in the sample 1, 6, 9, 3, 3, 7, 8, the most common number is 3. It will be the mode of the series. However, when analyzing prices, each value can occur only once. Then, in order to calculate the mode, we can use the Pearson empirical equation:
According to the equation, the mode is an unstable indicator (the coefficients go beyond the boundaries of the interval -1…+1). But it can be useful as an addition to other indicators.
Another central measure can be considered the middle of the range. To calculate it, we need to find the half-sum of the maximum and minimum values of the time series. Although mid-range is sensitive to spikes and not very reliable, it is used in some indicators.
This is what all four measures of the central tendency look like on the chart.
Author: Aleksej Poljakov