Data for backtesting
1) Use a constant spread based on mean from the symbol
2) Use the spread as it comes from tickstory, which seems very conservative in my analysis
3) Use a variable spread based on analysis from existing data
Just curious to what others are using? Cheers, Ed
If you are using MT5, then there is no need to use TickStory, and Tick Data Suite (TDS) is not even meant to be used with MT5, only MT4.
You don't even need to use Dukascopy data, nor is it ideal. Just use the data provided by the broker. If you use a reliable broker, they often provide quality historical data quite far back.
Using the broker's real tick data, also allows you test with real and floating spreads, instead of fixed spreads.
Don't be stuck in the MT4 mind-set. MT5 is different and you don't need 3rd party tools for testing with real and quality historical data.
Thanks Fernando,
I was only looking elsewhere as the 1 minute OHLC for some of the symbols with the Broker I'm using (Darwinex) doesn't go back as far as that from Dukascopy.
For example with GDAXI I was looking at 1minute bars in the symbol list dialog and it shows that 1minute data starts at around 31/01/2018. Darwinex site says that tick data is available from 2018-06-27. Whera's in tickstory it says data are available from 03/01/2006.
Am I missing something here?
Thanks
Ed
Am I missing something here? Thanks Ed
I think there is some misunderstanding. MT5 does not have separate source data for the different time frames. It generates it all from the broker's OHLC M1 data, so that whether that be converted to D1, H4, H1 or whatever, then it will all have the same time span.
As for how far back that original historical M1 data goes, is up to the broker. However, sometimes you have to use the Symbols (Ctrl-U) panel to request older data so that the terminal downloads it for you. Sometimes just scrolling the Chart to the left is not enough. And you also have to wait for the data to download as it may take a while on the first try.
For example, on both my main brokers I can get EURUSD as far back as 1971, but it also depends on whether you are using a demo or real account for the data. For example on a demo account I can only get DAX as far back as 2020 but on a real account I can get as far back as 2016.
Morning,
Yes I was aware of that Fernando but thanks for reminding me.
For DAX I go to the symbol manager (Ctrl+U)-bars and then request back to 2020 and I get the following. Looks like there is some form of data back at 2012 but on closer inspection it's daily data and not M1.It then transitions to hourly data in 2016. Scrolling through the data it seems that the M1 data starts properly until 2018.01.31.
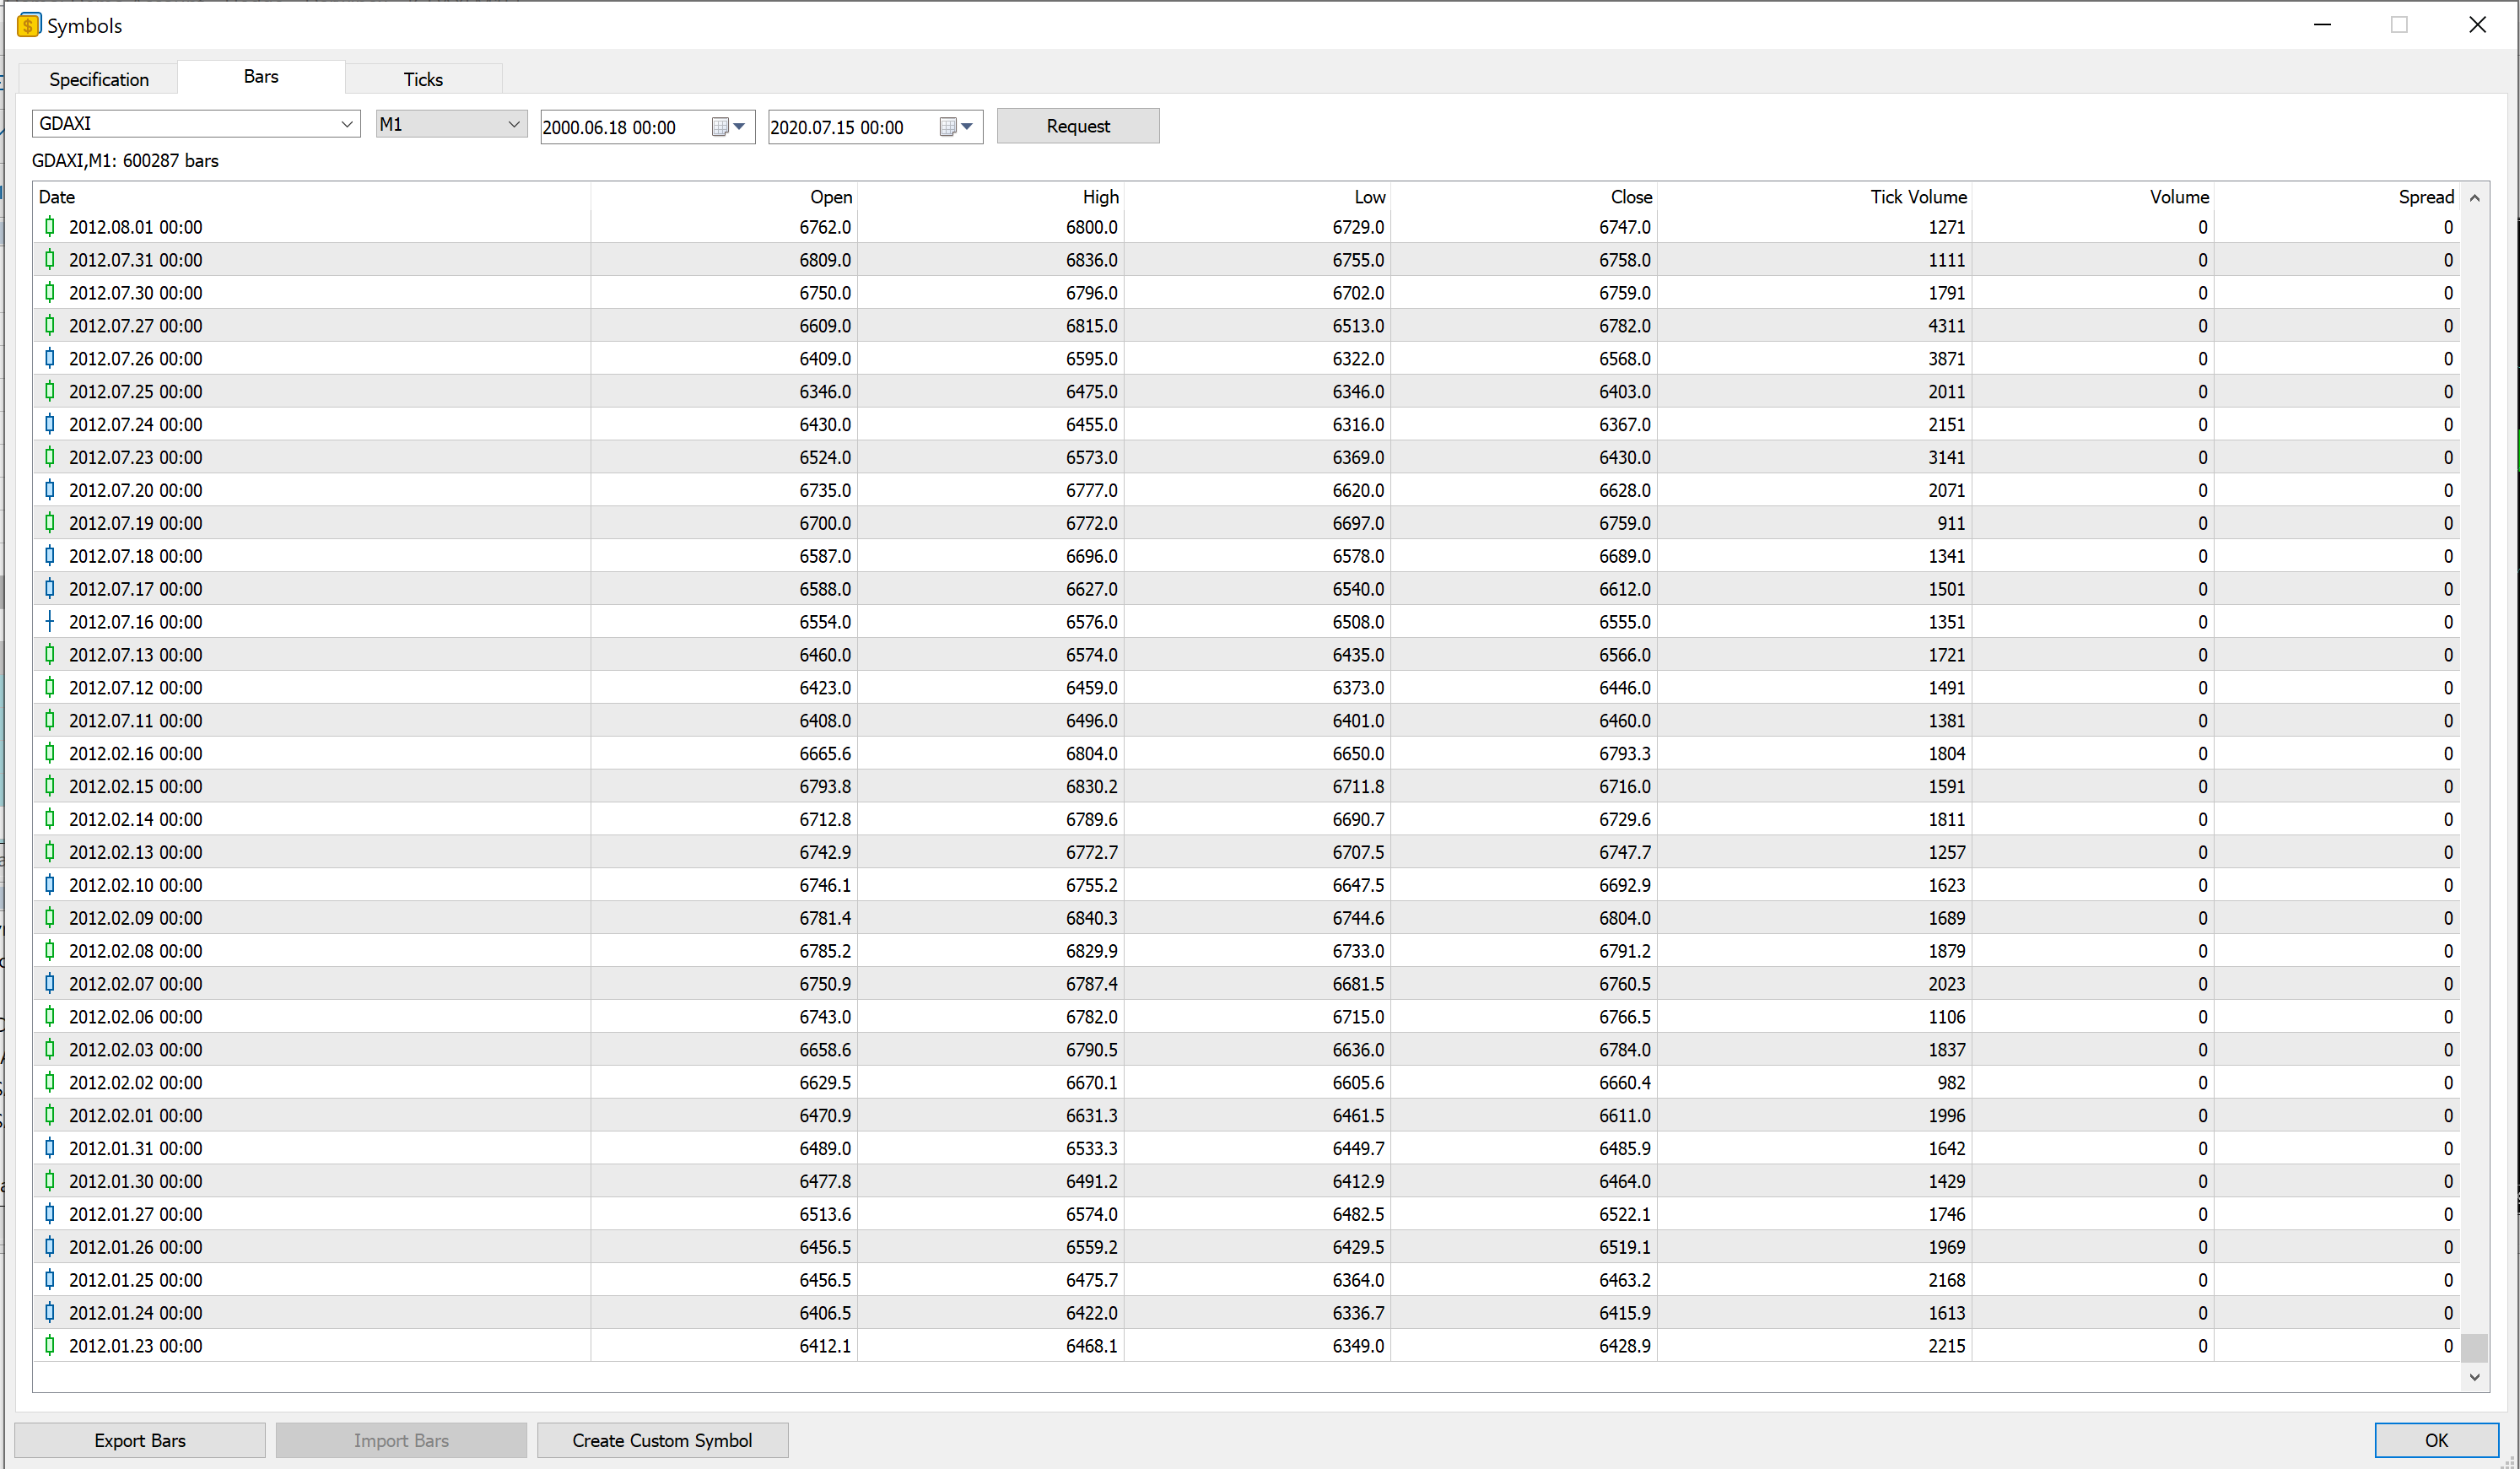
So if I want data from further back than 2018 I will have to look elsewhere hence why I was looking at Dukascopy etc and how to handle spread etc.
I've realised nothing is ever straight forward in this game! :-)
Ed
If you are going to use Dukascopy data, then you will have to import tick data into your Custom Symbol, so that you can have both the Ask and Bid prices for the floating spread.
If you are going to use Dukascopy data, then you will have to import tick data into your Custom Symbol. Only the tick data will have both the Ask and Bid prices for the floating spread. Importing M1 data will have no spread data.
Yes, that is what I feared. I'm guessing that if I import tick data that I will have to run using real ticks in the strategy tester. I was trying to avoid doing this to save time on processing etc. Or can MT5 use the tick data to produce 1M OHLC bar data from it then use that in the tester?
Many thanks,
Ed
Yes, you will have to run with real ticks for floating spread. Obviously M1 bar data only has one value for spread, meaning that the spread is constant for an entire bar.
If you don't mind testing it like that, then just import the M1 data generated by TickStory.
EDIT: You can have different spread for each M1 bar — pseudo floating spread.
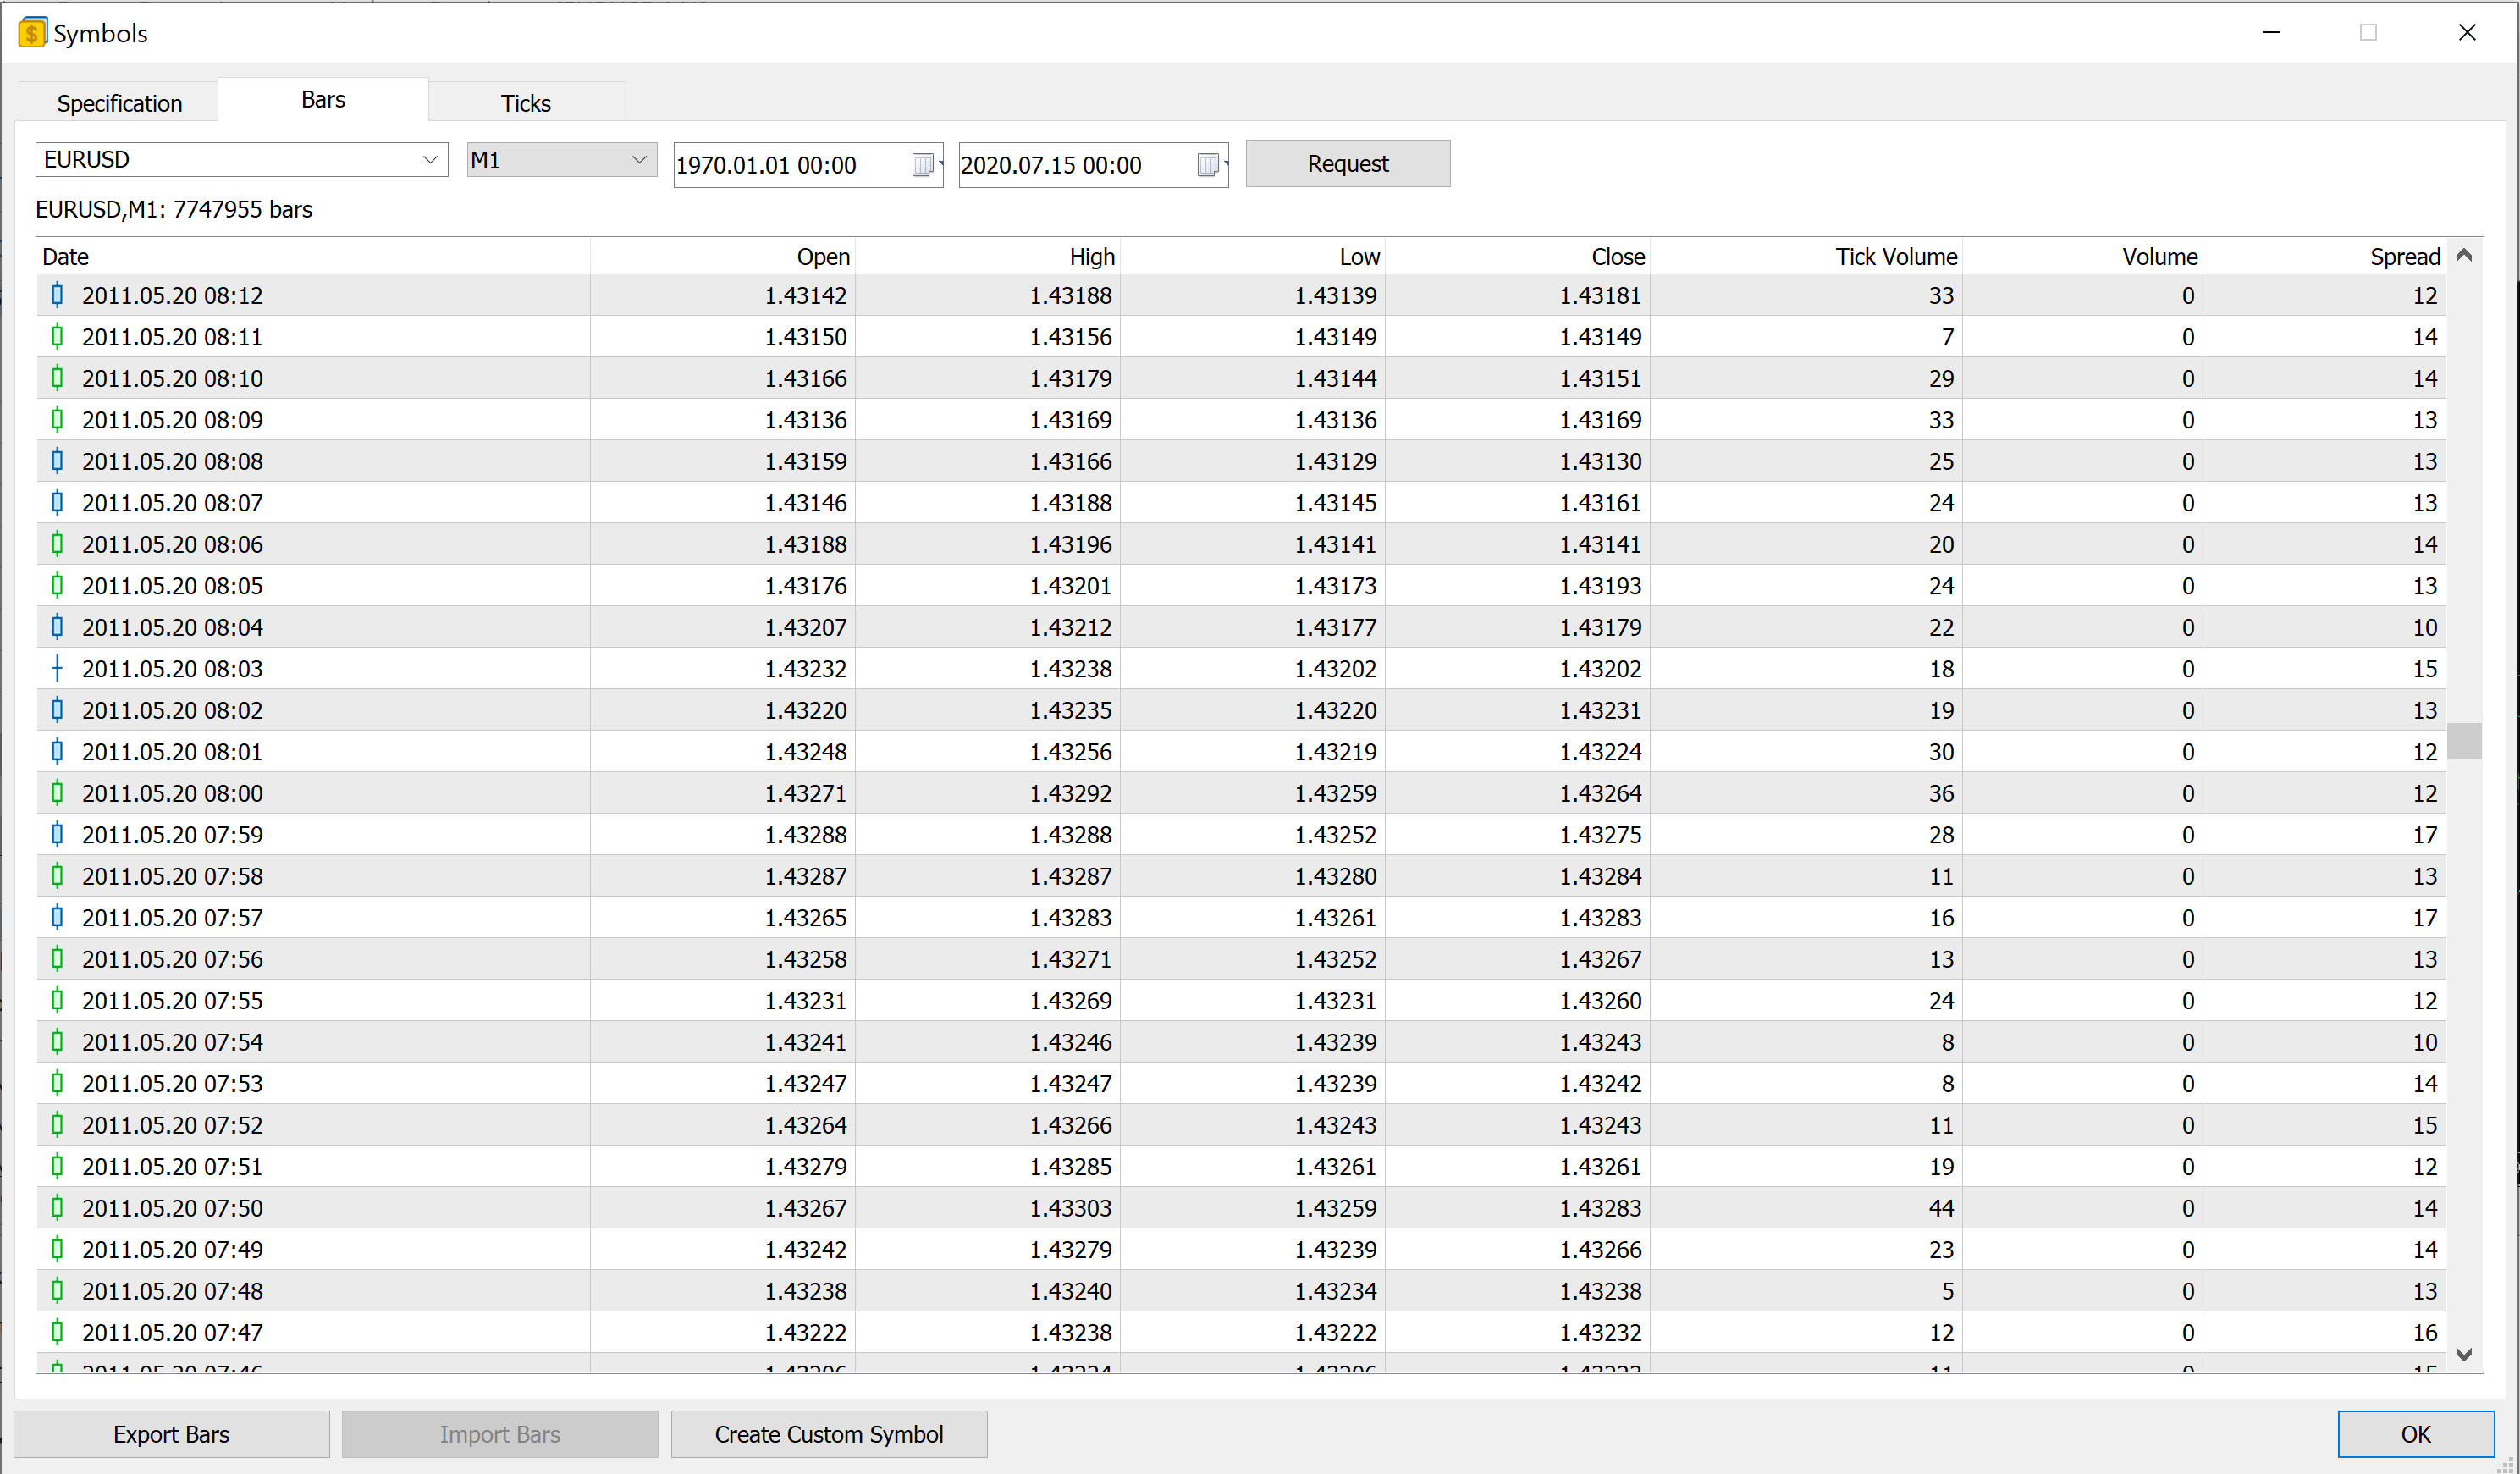
The following is the requested 1minute data for EURUSD in MT5 symbol manager. As you can see there is a spread figure at the end column. Do you know how this is calculated? I guess it's broker dependant and could be mean or max spread over the bar or the spread at close etc?
Any ideas?
Ed
The "spread" for bars is a timeseries as described in the documentation — Documentation on MQL5: Timeseries and Indicators Access
No official information is provided by MetaQuotes, but from tests done by a user here on the forum, the consensus is that it is the minimum spread of the bar.
Forum on trading, automated trading systems and testing trading strategies
Tester different Bar Open price in different testing modes
Alain Verleyen, 2018.10.25 17:53
The M1 bar rate spread is the minimum during this M1 bar.
2018.10.25 11:06:00.387 MqlRatesSpread (EURUSD,M1) 2018.10.25 18:05. MqlRates spread=2 pts. tick_volume=115 MaxSpread=0.000060 MinSpread=0.000020 Avg=0.000037 Ticks=115(148)
2018.10.25 11:07:00.392 MqlRatesSpread (EURUSD,M1) 2018.10.25 18:06. MqlRates spread=2 pts. tick_volume=89 MaxSpread=0.000060 MinSpread=0.000020 Avg=0.000038 Ticks=89(136)
2018.10.25 11:08:00.463 MqlRatesSpread (EURUSD,M1) 2018.10.25 18:07. MqlRates spread=3 pts. tick_volume=81 MaxSpread=0.000050 MinSpread=0.000030 Avg=0.000038 Ticks=81(124)
2018.10.25 11:09:00.463 MqlRatesSpread (EURUSD,M1) 2018.10.25 18:08. MqlRates spread=2 pts. tick_volume=113 MaxSpread=0.000050 MinSpread=0.000020 Avg=0.000038 Ticks=113(163)
2018.10.25 11:10:00.552 MqlRatesSpread (EURUSD,M1) 2018.10.25 18:09. MqlRates spread=2 pts. tick_volume=114 MaxSpread=0.000060 MinSpread=0.000020 Avg=0.000037 Ticks=114(163)
The "spread" for bars is a timeseries as described in the documentation — Documentation on MQL5: Timeseries and Indicators Access
No official information is provided by MetaQuotes, but from tests done by a user here on the forum, the consensus is that it is the minimum spread of the bar.
Thanks. That makes sense.
- Free trading apps
- Over 8,000 signals for copying
- Economic news for exploring financial markets
You agree to website policy and terms of use
Hi everyone,
I use MT5.
I've been trialling the use of tickstory and Tick Data Suite (TDS) for sourcing symbol data for better backtesting.
My trading strategies are based on the close of M15 timeframe and above so I'm not looking at HFT, more swing trading. Based on this fact I'm planning on using 1 minute OHLC and have downloaded it from Dukascopy (via tickstory and TDS). My question is what do people use for spread values? TDS doesn't include any spread values at all and tickstory gives an option to output the maximum spread seen within each bar which I have found to be very conservative when comparing the data to that from the broker, which will use the actual spread at the time of the trade.
There are a number of forms of attack, as follows, which I have considered and I can easily add the spread into the csv files:
1) Use a constant spread based on mean from the symbol
2) Use the spread as it comes from tickstory, which seems very conservative in my analysis
3) Use a variable spread based on analysis from existing data
Just curious to what others are using?
Cheers,
Ed