How can I draw a zigzag?
I suppose you expect it to go from one Fractal to the next... But what is the problem right now, what is displayed?
Look, to use DRAW_SECTION you need to have all the points to be drawn in one buffer, so in the original zigzag you have one high buffer, one low buffer. These two are INDICATOR_CALCULATIONS, but not drawn.
Then there is another buffer which contains all the highs and lows (minus some) and this one is INDICATOR_DATA which means it is drawn. And the rest of preliminary and initiation stuff has to stay as it is, especially EMPTY_VALUE stuff from zigzags OnInit. So have the Fractal Buffers be INDICATOR_CALCULATIONS.
I looked at the Zigzag indicator a bit to see how I can do it, but there are different situations. Now how can I draw a zigzag with the arrays I have in this hand?
For example:
i have a zigzag indicator that i converted from tradingview.
not sure if it will help you.
but don't ask me to explain the code, i'm not good in explanation.
I suppose you expect it to go from one Fractal to the next... But what is the problem right now, what is displayed?
Look, to use DRAW_SECTION you need to have all the points to be drawn in one buffer, so in the original zigzag you have one high buffer, one low buffer. These two are INDICATOR_CALCULATIONS, but not drawn.
Then there is another buffer which contains all the highs and lows (minus some) and this one is INDICATOR_DATA which means it is drawn. And the rest of preliminary and initiation stuff has to stay as it is, especially EMPTY_VALUE stuff from zigzags OnInit. So have the Fractal Buffers be INDICATOR_CALCULATIONS.
I already have two separate price lists of highs and lows, these will be "INDICATOR_CALCULATIONS", and I have a total list, which is a combination of these two lists, which will be "INDICATOR_DATA" and I'll just draw this, right?
In short,
indicator_buffer 1
indicator_plots 1
--
Setindexbuffer(0,...)
plotindexsetintege...(0,...)
That's how it should be, right?
In MQL5 you declare all the buffers
The current zigzag and fractal indicators do not give the results I want. I don't know exactly how they are calculated, but I get better results in my calculations. Also, it doesn't repaint. My main goal is to make an indicator that will find harmonic and other patterns. First I get the waves detected properly. It should give the prices in this "Total" array to one array and show only the price ranges that I want on the chart. (for example 500 candles) Actually, I did this with "Arrow" and tried to show it as a straight line in a zigzag shape.
Okay now I don't understand what you want to do any more. I mean it partly makes sense but doesn't quite add up. You mentioned in a previous post that you have two calculations buffers and one drawn buffer, so it sounds feasible to copy the head of ZZ from Examples/Indicators and build your own calculation formula below that.
Another thing is letting a for loop run across the last 500 bars of data buffer and have it gather all the ZZ points into an array. So you have the price differences and you can take the bar differences as well into another array. But this array can't have the same size as the data buffer. Because it doesn't contain the empty places.
(Edit) I think you did the latter one first. But that is not ideal for the functionality of indicator buffers. An Indicator buffer is a special kind of array that goes from bar zero to rates_total-1. When you initialise it as indicator data it is drawn automatically. The ZZ's Final buffer still contains a lot of zero values, but they are changed into EMPTY_VALUE, so they don't appear in the chart via PlotIndexSetDouble.

Its true ZigZag is not reliable for visual analysis done manually as you cannot see the repainting steps.
Usually in projects that require divergence or patterns its a headache to explain certain things expecially if
the clients are coming with ideas from a youtuber .
But any way , laughs aside , there are 2 basic ways of going about it :
- Measure by bars , lets call it barometry , where you require an amount of bars before and after the swing point that have not gone beyond its price.
- Measure by points , lets call it tickometry , where you require an amount of points before and after the swing point of which the bars that make up the move have not gone beyond its price.
These terms are personal , so don't google them.
- You will log swings when the left side and the right side have at least X amount of points and above.
- You will also need to define what that size is , by atr or by reading higher timeframe bars .(i used to read 20 bars of the monthly chart and the average was then multiplied by a timeframe factor)
- There will be a lot of swings missed because they won't be logged in low volatility
- What is good about tickometry is you can go one way , and don't have to loop back to check , if i recall correctly.
- There will be instances where you have a new high , you have not found a new low and you find a higher high again.If you want to not repaint you will have to interject a low in between those two points so that they remain in history but the code (or user) needs to know that the interjected low was not discovered like the rest of the points are.
- You will also have to account for equal price swings , i.e a top being the same value across 3 bars .
Okay now I don't understand what you want to do any more. I mean it partly makes sense but doesn't quite add up. You mentioned in a previous post that you have two calculations buffers and one drawn buffer, so it sounds feasible to copy the head of ZZ from Examples/Indicators and build your own calculation formula below that.
Another thing is letting a for loop run across the last 500 bars of data buffer and have it gather all the ZZ points into an array. So you have the price differences and you can take the bar differences as well into another array. But this array can't have the same size as the data buffer. Because it doesn't contain the empty places.
(Edit) I think you did the latter one first. But that is not ideal for the functionality of indicator buffers. An Indicator buffer is a special kind of array that goes from bar zero to rates_total-1. When you initialise it as indicator data it is drawn automatically. The ZZ's Final buffer still contains a lot of zero values, but they are changed into EMPTY_VALUE, so they don't appear in the chart via PlotIndexSetDouble.
Ok it's been a while and I fixed some things.
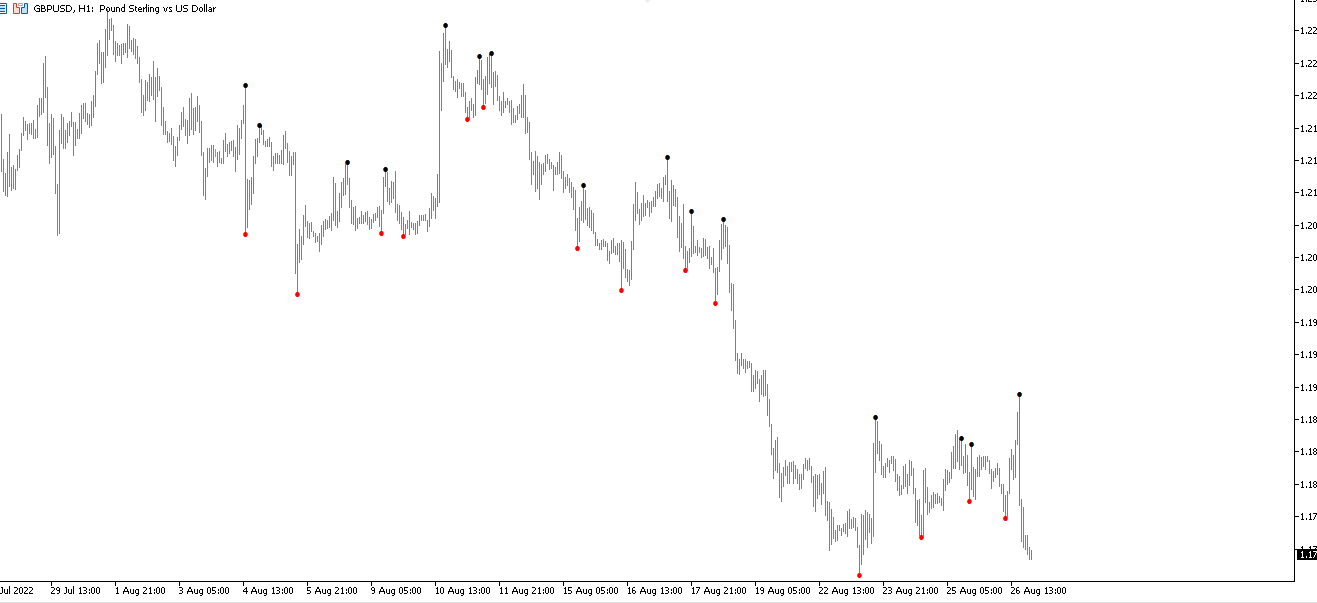
1) First of all, I have identified candles that are higher and lower than the candle before and after them within the candle range I have determined.
2) I did another elimination due to a problem
3) If there is a high then the following should be low. So it should be sequential. I eliminated consecutive lows and highs according to certain rule.
4) I kept at least 0.4% or more between high-low or low-high both points and eliminated the values.
5) I gave the remaining highs and lows to 2 separate series according to their indexes, I gave "zero" to places where there is no price.
I did each elimination with "ArrayRemove" then resized with "ArrayResize".
As a result I have
Up Price array
Up Index array
Down Price array
Down Index array
Total Price array
Total Index array
and two buffers (plotted)
up_dots
down_dots
Yes okay congratulations from your picture your calculations seem to work.
- Free trading apps
- Over 8,000 signals for copying
- Economic news for exploring financial markets
You agree to website policy and terms of use
I looked at the Zigzag indicator a bit to see how I can do it, but there are different situations. Now how can I draw a zigzag with the arrays I have in this hand?
For example: