Laboratory - statistical analysis of price charts.
You can take a methodology book (Theory of Mass Fucking Service), which is somewhere in the 3rd or 4th year. Where it is written in the box how the real needs in the form of independent requests are put into the results of transactions.
Nothing changes, the sun keeps on rising. The daily activity is absolutely identical, day by day.
Stationarity or constancy is the property of a process not changing its characteristics over time.
Conclusion: the deviation of the tick flow intensity from the average value depending on the time of the day is constant in nature and does not change over time.
Maybe later I will make such an analysis by days of the week.
What time is it MSC or Central European time?
I was doing a similar exercise with OHLC and got a similar picture. By the way, the maximum volatility by days of the week I got Wednesday and Thursday...
What time is it MSC or Central European time?
Right now it's the same time as the MSC. RoboFX demo data.
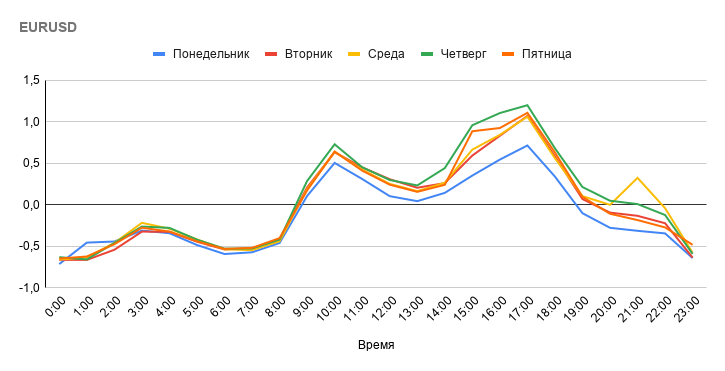
Statistics by days of the week.
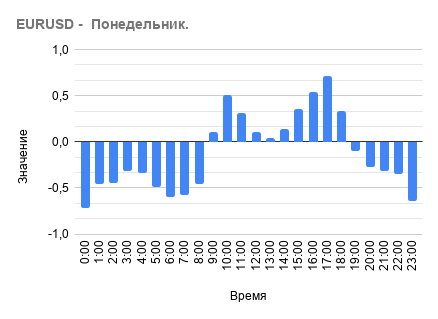
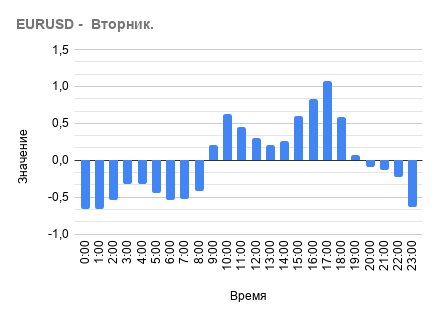
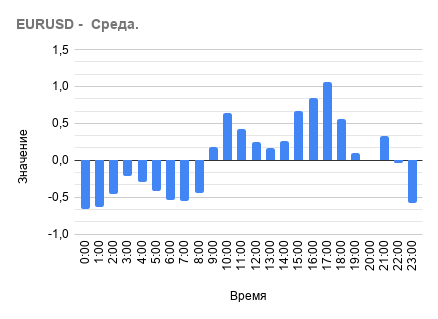
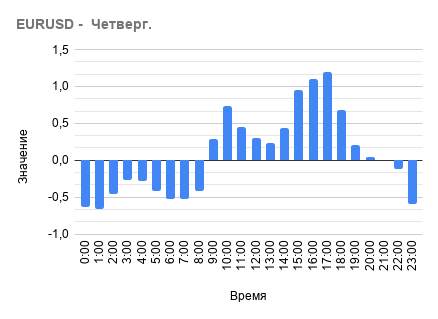
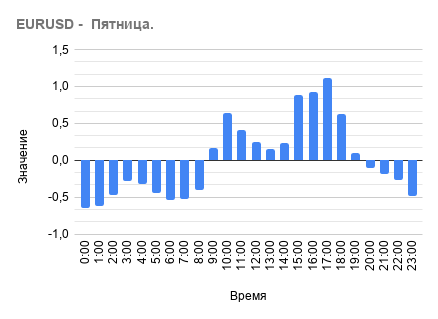
As you can see, the same tick flow structure.
Statistics by day of the week.
Compare the different days of the week to find out which days of the week have the highest and lowest number of ticks, if you're not too lazy)
Compare the different days of the week to find out which days of the week have the highest and lowest numbers of ticks, if you are not too lazy)
Right?
And here are a couple of months at a guess:
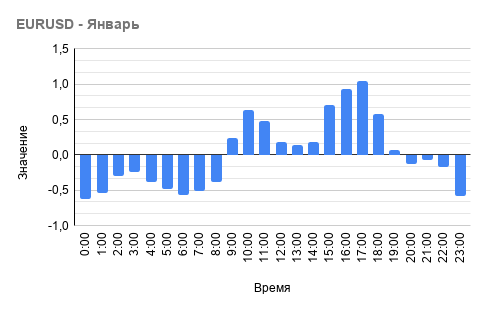
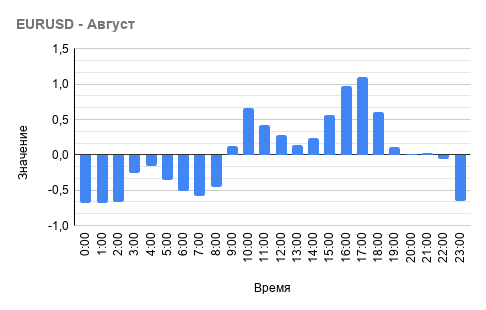
Bottom line: the pattern of deviation of tick flow intensity from the average depending on the time of day is of a constant nature and does not change over time from day of the week or month or year.
Right?
In looking for a pattern I did this, 1 hour OHLC bar;
green bar is the summed difference between HL, blue bar is the positive summed difference between OC (i.e. rising bar), red bar is the negative summed difference between OC (i.e. falling bar) converted to positive for convenience.
The first one from left to right is intraday, the 2nd one is by days of the week and the bottom one is by weeks.

The picture is not much different from yours, Thursday is also your most active day)
In looking for a pattern I have done this, 1 hour OHLC bar;
green bar is the summed difference between HL, blue bar is the positive summed difference between OC (i.e. rising bar), red bar is the negative summed difference between OC (i.e. falling bar) converted to positive for convenience.
The first one from left to right is intraday, the 2nd one is by days of the week and the bottom one is by weeks.
The picture is not much different from yours, Thursday is also your most active day)
I understand you analysed volatility and mine above is the intensity of tick flow.
As I understood you analysed volatility and my above is tick flow intensity.
The charts are similar in terms of ticks, volumes, OHLC -> activity)
Noticed an interesting thing; the body of an average candle is just over 51%, that is, we can assume purely statistically of course) that the new candle will close in a rangeslightly over 51% of the opening)

I noticed an interesting thing; the body of an average candle is a little over 25%, which means, statistically of course), that the new candle will close in a range ofa little over 25% of the opening)
Are we talking about H1?
- Free trading apps
- Over 8,000 signals for copying
- Economic news for exploring financial markets
You agree to website policy and terms of use
Stationarity or constancy is the property of a process not changing its characteristics over time.
So is there something constant in forex price charts or not?
We need to find it out experimentally.
Study #1 - the goal is to determine the deviation of the intensity of the tick flow from the average value depending on the time of day.
Let's determine the period of the average value as 100 hours (it should be said, that the choice of the average period size doesn't significantly change the character of the final result).
The deviation of the tick-flow intensity from the average will be calculated by the formula:
[ Flow Rate] = ([Number of ticks of the current bar] - [average number of ticks during the last 100 bars])/ [average number of ticks during the last 100 bars ].
Thus we get the value similar to the percentage change, only minus multiplying the result by 100%.
Then we pass through the chart in the sliding window and collect the data for each hour of the day separately.
As a result, for each hour we get the average of the observations - [Total flux intensity for time of day ]/[number of observations].
Let's look at the results of the experiment:
Graph 1 - deviation of the tick flux intensity from the average value depending on the time of day for the whole available history.
Many people already know from their observations that the intensity of ticks is less at night and in the morning, and then increases during the day and then fades again.
The graph clearly shows the structure of this tick flow behavior.
But this is the data for the whole period of available history and what is constant here? This question may arise in the reader. I agree that we should consider the data of different periods of history. Then let's look at the structure of the tick flow in different years.
As can be seen from the graphs the character of the flow of ticks is almost identical from year to year.
Conclusion: the deviation of the tick flow intensity from the average value depending on the time of the day is of a constant nature and doesn't change with time.
Maybe later I will make such an analysis by days of the week.