The problem of transferring from MT4 to MT5. Or, more precisely, the inability to execute some algorithms in MT5 without'err.
Oh, by the way, just yesterday I was writing an indicator in which I had to periodically copy data in chunks lasting a year from W1. Very often unsuccessful attempts of copying happened. In the end it didn't work, I had to do everything by a different principle.
...
Also unaccustomed and inconvenient with data access after 4.
Data access in 5 is limited to TF.
If you draw quite a long trend line on TF D1 or on W1 then going to M1 or M5 you will not see it due to limitation of access to far trend point.
You can check it easily.
We have to deal with the canvas. But it is possible that such an ambush awaits there as well.
It is also unaccustomed and inconvenient with data access after 4.
Data access in 5 is limited to the TF.
If you draw quite a long trend line on TF D1 or on W1 then going to M1 or M5 you will not see it due to limitation of access to far trend point.
You can check it easily.
We have to deal with the canvas. But maybe there is an ambush waiting there as well.
It is a completely different story. The far point should have the history on small prices to show the trend.
Let's draw with W1 fork with reference to it. Minimal timeframe is m20. This is shown by the algorithm of fractal filtering. In this case it is shown in the tooltip. It does not make sense to build something with reference to the first point of the pitchfork on lower tf.

The spot shown by the up arrow in the next picture on m20 is marked by a vertical line. Everything is displayed fine. But on more shallowframes those pitchforks will not be shown by fractal filtering. The history goes beyondTERMINAL_MAXBARS on more shallowframes. This is why it will not be shown on TF less than m20.
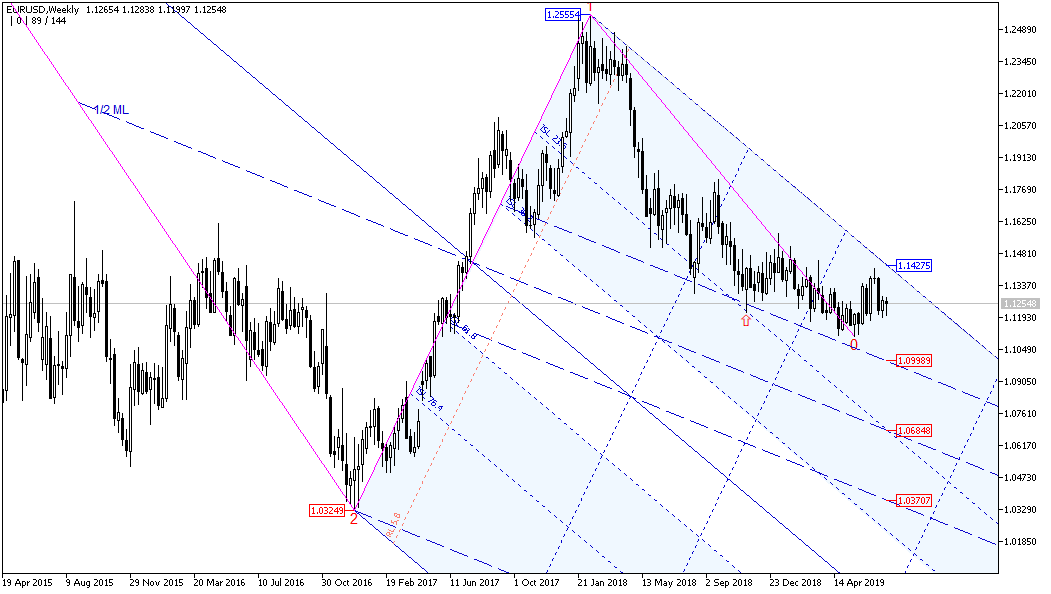

Everything is perfectly displayed. No shifts. And it works fine in MT5. However, to be able to display it that way, one should set the exact time of the extremum on the smallest timeframe, in our case on m20, when displaying the forks.
By the way, you can see that the line SLM318 (dotted line) worked fine on 09-11-2018. It's like the sniper technique, which the forex academy from Minsk is promoting. But here the market "saw" the line SLM318 and just masterfully worked...
Can you reproducibly demonstrate the inaccessibility of the data?
I didn't save the picture. But I will post the pictures when the situation arises. I won't be able to reproduce it with some test code. It is too much code to create.
I will just describe the way it was. I drew the pitchfork on H3. I bound it to extrema available on higherframes as well. I moved to H4. The pitchforks disappeared. I started to understand why it happened. I checked the tooltip on which TF boundary of fractal filtration is located. It appeared thatthe upper boundary was on H3. I deleted the pitchfork from the chart. Re-linked the pitchfork to the same extremums. I checked the upper limit. It turned out to be at one-month timeframe. And such situations repeated themselves. But not frequently.
The program accesses all safes for the first 10 extrema when displaying a zigzag. Each time the zigzag is re-drawn. The zigzag is re-drawn only when the price leaves the zero bar. Not on every tick.
I am closing the terminal. I unload it from the computer memory. I access the folder with the history where the *.hc files are located. Files of timeseries for all timeframes have the date and time as of the moment when the terminal was unloaded from the computer memory. That is, all timeseries are formed.
Not the picture I'm interested in, it's derived from your code.
This has to be modelled. To create logs. I will think about how to do this.
Can you reproducibly demonstrate the inaccessibility of the data?
If that's a question for me?
Then here's reproducing a simple example.
D1.

Go to H4

Go to H1

There will be a clear chart on a small TF.
Objects are in the lists, but they are not on the chart.

- Free trading apps
- Over 8,000 signals for copying
- Economic news for exploring financial markets
You agree to website policy and terms of use
First a quote from the MQL5 language guide. Under the heading Organising data access.
"...Data accessibility
The availability of data in HCC format or even in HC ready format does not always mean the unconditional accessibility of these data for displaying them on charts or for use in mql5-programs.
When accessing the price data or indicator values from mql5-programs, you should remember that it is not guaranteed to be available at a certain moment of time, or from a certain point in time...".
Immediately please do not give advice on how to circumvent the described problem. This is written mostly for MQL5 developers.
In the ZUP for MT4 the fractal filtering algorithm is implemented. TheZUP is a universal zigzag with Pesavento patterns. The graphical interface is a little written about it. But here I will describe the algorithm once again.
When displaying graphical tools on a chart with binding of selected graphical tools (e.g. Andrews' Pitchfork, or any other) to zigzags extremums or wave patterns using the graphical interface, the algorithm of fractal filtering is engaged.
Fractal filtering removes the created graphical tool at those timeframes where the output of this graphical tool loses its meaning.
For example, there are no quotes for the selected extremum on some timeframes (this is relevant for lower timeframes) or two or more extrema appear in the body of one bar on higher timeframes with various variations of location within the bar.
It does not make sense to display a previously created graphical tool on such timeframes. It loses its functionality. In such cases, fractal filtering automatically prevents the displaying of graphical tools "in trouble". I'll add for neural networkers as I go along... there are some very interesting ideas on implementation in neural networks... ...but that's a different topic.
The problem with MQL5 is that even having generated time series on all timeframes for all extrema attached to a charting tool, there are moments when access to some timeframes for the selected extremum is discontinued due to peculiarities of data access (see above). As a result, incorrect data on timeframes for the fractal filtering algorithm is generated. That is, for example, when accessing all timeframes, the upper cf in the data for fractal filtering gives the value of the upper cf of the monthly timeframe. But at the moment whenaccessibility is not guaranteed, the upper tf for this extremum is limited to the current timeframe.
A user clicks on the symbol to which a graphical tool is attached. The chart symbol will be displayed. User switches to the older timeframe. Fractal filter algorithm deletes the graphical tool. The user is puzzled. Extremes are all visible, but the graphical tool disappears.
And here it is impossible to organize the waiting for the chart symbol binding after a user clicks on a selected symbol until the time of access to timeseries different from the current timeframe.
There are no such problems in MT4.
This situation is the problem that has prevented me, in this case, from developing programs for MT5. This problem was clear even when MT5 was introduced on the market...
The ZUP code was translated to MT5. And placed it in my Market. But the problem described above is present there. I didn't build crutches to bypass the problem. If you know about this problem, you can simply delete the created graphical tool. And display it anew. But this is, how should I put it so gently....
I believe that the issue described above is still an imperfection of MQL5 language or MT5 terminal. It SHOULD!!! be a guaranteed access to the already generated timeseries at any time!
On a sidenote. When creating a wave partitioning in ZUP, the fractal filtering is enabled. Here we have the following. When I have access to all timeseries of all timeframes the wave patterns are correct. But with sudden termination of access to timeseries the wave patterns may be output in an unpredictable way. That is, when the wave partitioning was being created, everything was tidy. And in some subsequent moment when the wave partitioning was created at transition to other timeframes it was displayed in an unpredictable way. And it is not easy to create crutches to eliminate erroneous terminal operation.