From theory to practice - page 521
You are missing trading opportunities:
- Free trading apps
- Over 8,000 signals for copying
- Economic news for exploring financial markets
Registration
Log in
You agree to website policy and terms of use
If you do not have an account, please register
What's wrong with the dashboard?
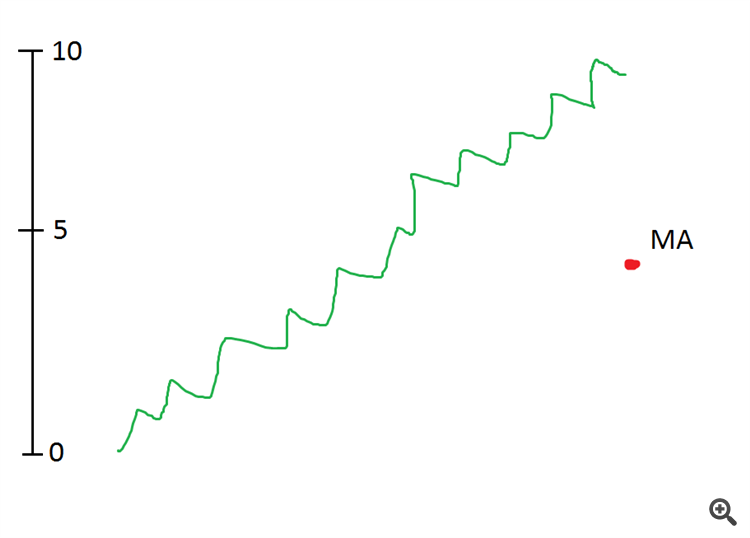
It shows the average value of the graph. What would be the average value of a graph that rose from mark 0 to mark 10?
5.
So the scale will now be at 5. Even though the graph is already at 10.
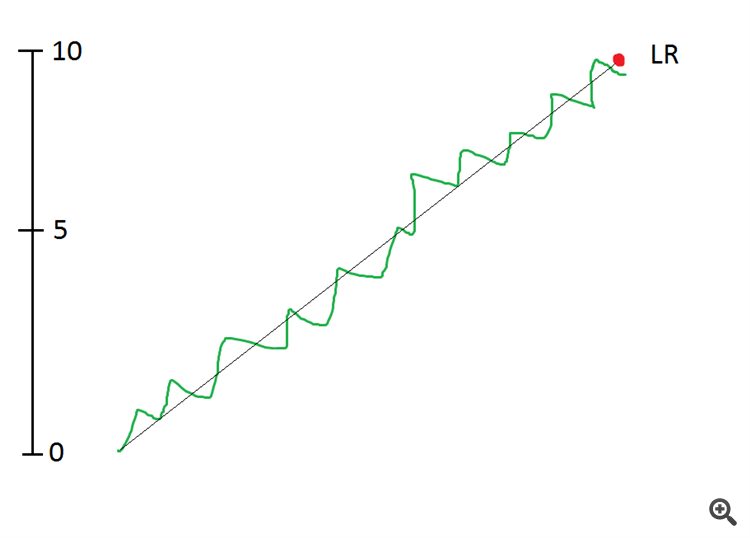
A linear regression will help.
The line of a linear regression will go through the centre of the price channel, and the last point of this line will be at 10.
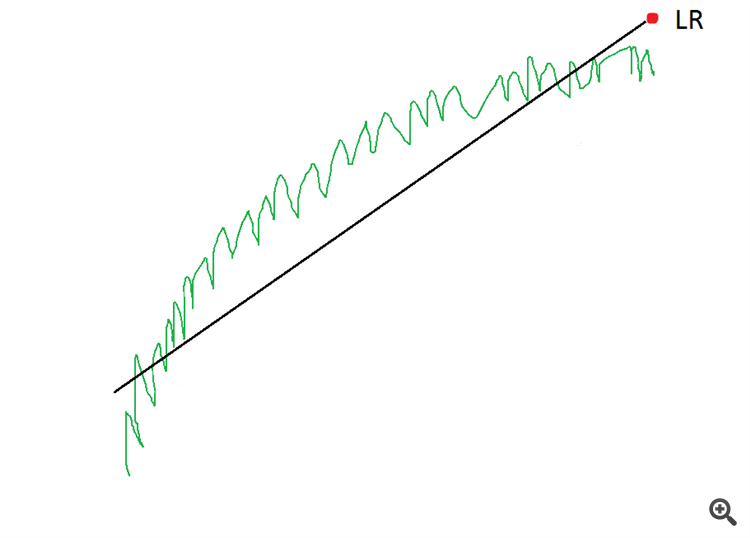
But channels are not always straight. Some channels are arc-shaped. In this case the LR will not work well.
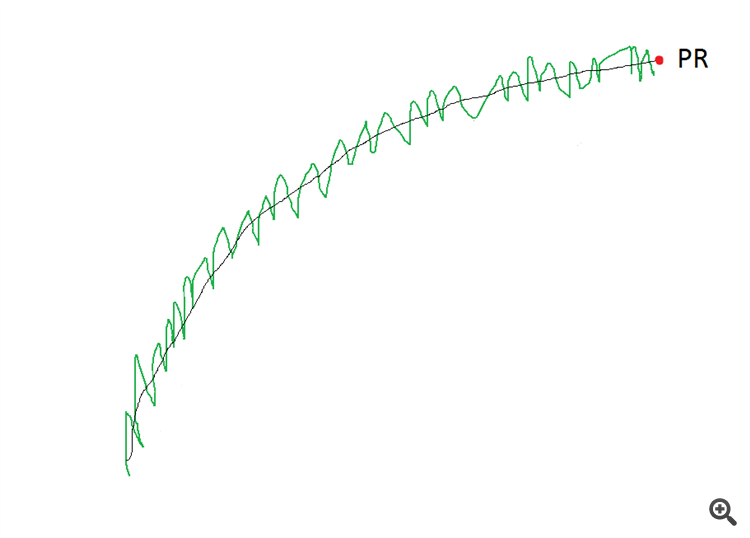
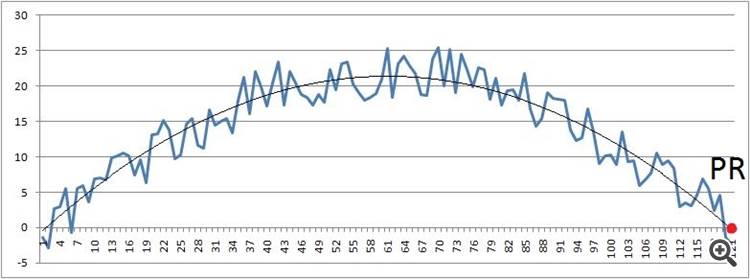
This is where polynomial regression will do the trick.
The OR plot will go straight down the centre of the channel and its last point will also be in the centre of the channel.
And here's how the PR will go along such an arc (if it's exactly a slice of a sine wave)
you have to consider the disadvantages as well...
What's wrong with the dash?
It shows the average value of the graph. What would be the average value of a graph that rose from mark 0 to mark 10?
5.
So the scale will now be at 5. Even though the graph is already at 10.
A linear regression will help.
The line of a linear regression will go through the centre of the price channel, and the last point of this line will be at 10.
But channels are not always straight. Some channels are arc-shaped. In this case the LR will not work well.
This is where polynomial regression will do the trick.
The PR graph will go straight down the centre of the channel and its last point will also be in the centre of the channel.
Here, another arc. (i.e. a slice of the sine wave).
we have to consider the disadvantages as well...
But the basis is the same - dependency reconstruction by introducing mappings into new dimensions using kernel transformations, and there's more on top of that
even better this way:
figure out how to solve it.
Maxim Dmitrievsky:
What about forecasting? ))
defect?)))
figure out how to solve it.
in the current dimension - there's no way to solve it, that's the problem. Your regression knows nothing about the possibility of such an event occurring
By the way, Victor has an article about kernel probability densities, here
I don't think it's about kernel tricks - mapping feature vectors to other spaces
at least not in my opinion...haven't read it.
in the current dimension - there's no way to solve it, that's the problem. Your regression knows nothing about the possibility of such an event occurring
drawback?)))
even better like this:
figure out how to solve it.
usually like this.
in the current dimension - there's no way to solve it, that's the problem. Your regression knows nothing about the possibility of such an event occurring