From theory to practice - page 525
You are missing trading opportunities:
- Free trading apps
- Over 8,000 signals for copying
- Economic news for exploring financial markets
Registration
Log in
You agree to website policy and terms of use
If you do not have an account, please register
No, you cannot use a crawler to assess how much the market has changed.
You can only assess how much the new prediction errors have changed the forecast against the old errors.
That is, SSA does not say anything about the correctness of the forecast, SSA's difference only tells us about the difference in errors. Where the market will go, SSA does not care about it at all.
Without error estimation of each SSA, your difference is hanging in the air, it has nothing to rely on.
I've known this for a long time, but I have hope, so I'm thinking where else to look :)) I want to run the covariance matrix on history and analyze how big the differences in it are - and suddenly they say in theory that the price takes into account all and so on ))))
I don't know, it seems to me that if Alexander hasn't made it to the end - nothing can save this approach. Predicting random wandering is difficult, and assessing it some imaginary states :)
Here, in addition to my post above, particularly the anecdote part... To be honest, there is some illusion that the regularity in the price charts is just not to repeat its previous states. In SSA I will have time, I will make a set of all possible covariance matrices and try to analyze them for non-repeating in nearby states, i.e. the matrices should alternate in non-repeating order
maybe in the evening I'll clean up the code by SSA and post it, the code is just a port from Matlab, I didn't expect, but Alglib is very helpful to quickly port such things did as an example to myself in order to learn, may also help someone to understand, here's Matlab SSA attached
I'll highlight the question separately:
What function to do a regression on, so that its last point is in the centre of the price channel?
I need a function, like a polynomial, that can handle both zigzag and half circle (as you can see from the examples, the polynomial cannot handle these themes).
(Maxim Dmitrievsky's figure may not be considered yet, it does not fit the theory that the price is a trading channel that follows a certain trajectory. this figure is a trading channel with an ejection at the end, it may be considered later).
Other examples of non-linear functions are exponential functions, logarithmic functions, trigonometric functions, power functions, Gaussian functions and Lorenz curves.
Well Smokchy, you've got everyone all riled up with your pictures! ))
Well, and a bit of psychology to gauge how successful the Grail quest is, liked the video, apparently the girl looks natural and convincing
And a bit of psychology to gauge the success of the Grail quest, I liked the video, apparently the girl looks natural and convincing
You could give birth to a caterpillar at night with those eyes.
a bit of psychology to gauge the success of the Grail quest, liked the video, apparently the girl looks natural and convincing
The girl is smart-young she sees the invisible for many.
Well, if psychology is of interest, the cherry on the cake...
well, if psychology is interesting, the cherry on the cake, so to speak...
The 30th minute of the film is the most interesting), but you have to watch the whole thing to understand it.
You've already been told it's a useless pastime.
until you've spent your time, you don't understand.
How to do regression in Excel.
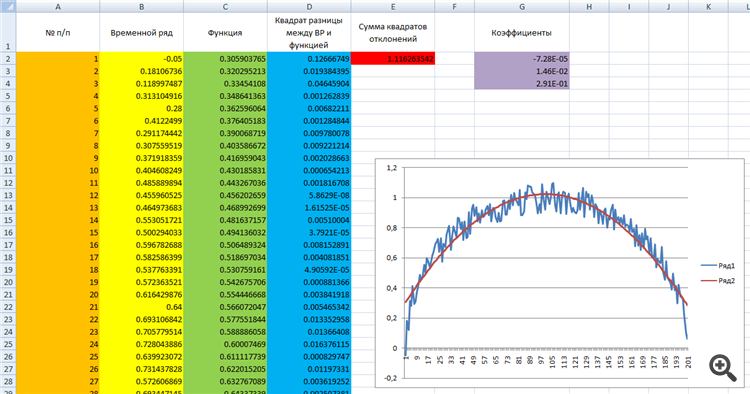
Using the Data/Solution Finder function.
In the attached table:
the first column is the number of the n/a.
the second column is the time series.
The third is a function (in this case, a polynomial).
The fourth is the ANC. the value of the time series minus the value of the function, and squared.
in the red cells is the sum over the blue column, i.e. the sum of the squares of the deviations.
in the purple cells are the coefficients to be fitted.
The polynomial function is y=ax2+bx+c
where x is the coordinate values on the x-axis. orange column. from 0 to 201.
y are the coordinate values on the y-axis that the picked polynomial will have.
a,b,c are the coefficients we will be fitting.
In Excel, the formula will look like this =a*A1^2+b*A1+c. That is, we substitute the values from column A instead of the X's (see the green column).
To find the coefficients of the function, click "Data" and then "Find Solution".
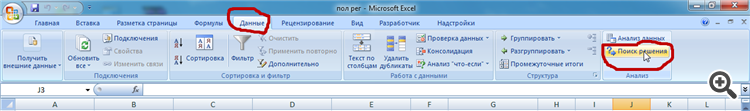
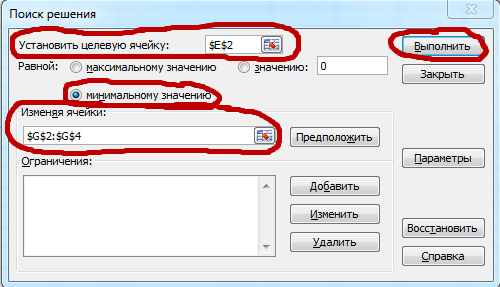
On the menu that opens select:
Set target cell (the red cell in our table),
to a minimum value,
Change cells (purple cells on our table).
and then click Execute.
That is, we minimise the squares of the deviations of the time series from the function.
Try putting your own functions in the green column.
exponential functions, logarithmic functions, trigonometric functions, power functions, Gaussian function, Lorenz curves, others...
The problem remains the same, the last point of this function must be in the centre of price channel (for both zigzag and half circle).
...
That is, we minimize the squares of deviations of the time series from the function.
Try putting your own functions in the green column.
exponential functions, logarithmic functions, trigonometric functions, power functions, Gaussian function, Lorenz curves, others...
The problem is the same: you have to find a function, the last point of which will be in the centre of the price channel (for both zigzag and half circle figures).
Interesting. Firstly, it is inaccurate, it is not "squares" but "sum of squares" that we minimise. Second, if you want to give greater value to the last points, it is done simply, in the minimized sum take not just squares, but weighted squares, that is multiplied by some positive weighting coefficients. Their values at the end of the array should be larger, and at the beginning - smaller. For example, for numbers of points i from 1 to n, weights equal to q^(n-i) with q < 1, give squares of deviation multipliers similar to weights of courses in an exponential moving average. Often their sum is also made equal to one, if we want to compare different approximations by the value of the minimum weighted sum of squares of deviation.
And what is the "centre" for a curvilinear channel whose boundaries are described by different types of formulas? Or at least for the first variant, by exponential functions?
If it is simply the midpoint of the segment from the penultimate value in the series to the last, then it is sufficient to make the deviation weights in the last two points of the series very large. Or even simpler, find this middle and that's it.
You need some other requirements for the deviations, otherwise the problem is understated.
What's the use of calculating the "centre" at the last point?