From theory to practice - page 514
You are missing trading opportunities:
- Free trading apps
- Over 8,000 signals for copying
- Economic news for exploring financial markets
Registration
Log in
You agree to website policy and terms of use
If you do not have an account, please register
1. trade on the trend. And it follows that you have to identify it and determine when it is over.
2. The size of the take is at least twice as big as the stop, and better than that if possible.
it won't work, points 1 and 2 will be lost at flat, trading in the channel is profitable at flat.
i remember, just yesterday i wrote another Elder with 2 screens, the state in the strategy tester then slowly draws a saw downwards, then an arrow upwards, for 2 years with a fixed lot profit is almost zero
the point is not the erlang flows. the point is to find an indicator that will go to the centre of the channel.
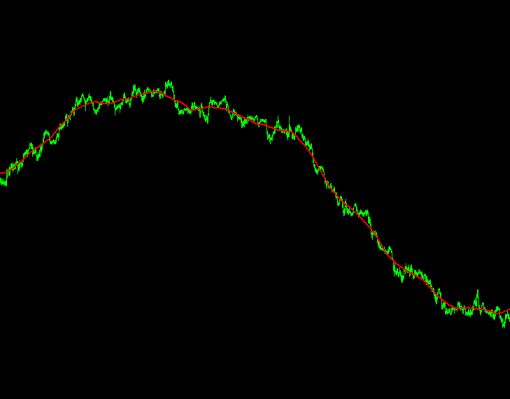
here, develop an indicator that will go like this red line.
the point is not the erlang flows. the point is to find an indicator that will follow the centre of the channel.
here, develop an indicator that will go like this red line.
Information about the centre of the channel comes in late. A beautiful picture can be obtained if the indicator is redrawn.
the point is not the erlang flows. the point is to find an indicator that will go to the centre of the channel.
here, develop an indicator that will go like this red line.
It doesn't centre everywhere. Take a waveform of period 2 and move it half a period back from the origin, then take a waveform from the waveform and move it proportionally back each time, you get a very good averaging on history, with uncertainty to the origin, and apply your version of that in the picture, see the deviations.
the point is not the erlang flows. the point is to find an indicator that will go to the centre of the channel.
here, develop an indicator that will go like this red line.
that's probably not possible.
Information about the centre of the channel comes in late. A beautiful picture can be obtained if the indicator is redrawn.
You can try to apply polynomial regression.
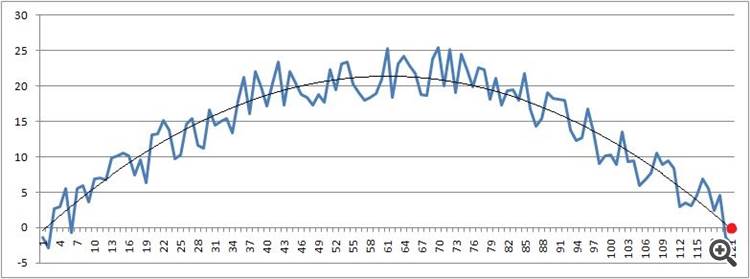
It tends to fit into an arc.
you can always use only the last point.
But there are disadvantages there as well.
The indicator was posted on the forum.
You could try screwing in a polynomial regression.
It tends to fit into an arc.
You can always use only the last point.
But there are drawbacks there as well.
The indicator was posted on the forum.
I mean try, khorosh wrote, it re-draws, polynomial also re-draws, there are many such variants in kodobase, different methods and filters, from simple to complex, but the effect is the same - either a lag or a re-draw, so the conclusion is that we should work with the same price