You are missing trading opportunities:
- Free trading apps
- Over 8,000 signals for copying
- Economic news for exploring financial markets
Registration
Log in
You agree to website policy and terms of use
If you do not have an account, please register
Insert in your EA before OrderSend():
You can put a condition with a spread to open a Buy, but you can't do anything about closing a Sell. Therefore, all of this does not solve anything.
It often makes sense to enter Buy with a larger spread than to wait for the market to calm down.
Let me make it even simpler. The Expert Advisor asks to open a trade at 1.3002 and the DC opens at 1.3003.
Have you forgotten about the slippage?
I made it so that one function could output information several times to any point on the screen. It's handy.
And how to use it?
This is a function that is inserted into your program code. It is called on one line, as many times as needed. You don't have to cobble together the same thing all the time, just one line!
Could you redo the macd indicator signal line using the formula ( signal=macd/n) where macd values are sma-close. And plot the indicator on the chart according to the formula sma=sma+ macd signal
Hello.
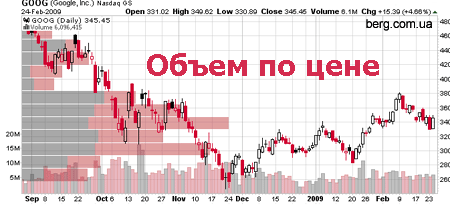
I would like to ask to make the following interesting: it has pushed me to this indicator https://www.mql5.com/ru/code/10526, the essence of what: The vertical price scale on the chart is divided into equal parts, with a given step (in pips). For each of these areas need to calculate what was the total volume (number of ticks) for a given period of H1 or H4 or D1 or etc., in which the price closed within the selected area. The data is taken from the minute timeframe, if we have a bar down, add ticks in the red zone, if a bar up, add ticks in the green zone (grey in the picture). The market profile may be more contrasting, and it will show better the accumulation zones. P / S and quite well, that it would be drawn from the right side of the chart. And thanks in advance if anyone wants to implement it.
Could you redo the macd indicator signal line using the formula ( signal=macd/n) where macd values are sma-close. And plot the indicator on the chart according to the formula sma=sma+ macd signal
The idea is as follows:
PERIOD 1 = time between bars 0 and 1
PERIOD 2 = time between bars 1 and 2
If PERIOD 2 is less than PERIOD 1 and bar 1 is high and bar 2 is low, mark in red.
If PERIOD 2 is less than PERIOD 1 and bar 1 is down and bar 2 is up, mark in green.
In other words, we are looking for pairwise opposing moves with small time difference.
Who has understood it, please help me to refine the ToR to fit the language capabilities and better visualization.