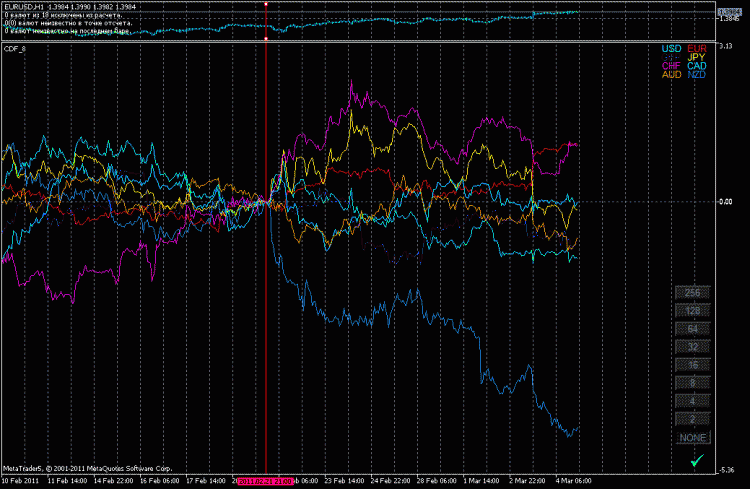
Its trading system is quite simple: if the index rises, we buy all 27 currency pairs. If it falls, we sell. It does not matter how any of the pairs is rising or falling. The overall result is not a bad profit.
I wonder how to determine the ratio of currencies in your basket? You have to agree that the weight of the USD cannot be equal to the weight of the NZD. How do you make this graph?
(AUDCAD+AUDCHF+AUDJPY+AUDNZD+AUDUSD+CADCHF+CADJPY+CHFJPY+EURAUD+EURCAD+EURCHF+EURGBP+EURJPY+EURNZD+EURUSD+GBPAUD+GBPCAD+GBPCHF+GBPJPY +GBPUSD+NZDCAD+NZDCHF+NZDJPY+NZDUSD+USDCAD+USDCHF+USDJPY)/27 = index on a given date.
(AUDCAD+AUDCHF+AUDJPY+AUDNZD+AUDUSD+CADCHF+CADJPY+CHFJPY+EURAUD+EURCAD+EURCHF+EURGBP+EURJPY+EURNZD+EURUSD+GBPAUD+GBPCAD+GBPCHF+GBPJPY +GBPUSD+NZDCAD+NZDCHF+NZDJPY+NZDUSD+USDCAD+USDCHF+USDJPY)/27 = index on a certain date.
Hee-hee... Funny formula.
Why 27? Of the 8 currencies there are 28 pairs.
Golden words, the author has opened my eyes. As they say everyone should know this: if it goes up-buy, if it goes down-sell))))
Well, allow me, allow me - diamond words... - Buy cheaper (the bottom), sell more expensive (the top). :-)))
P.S. As the market guru A. Elder teaches us. There are two types of risks - informational and monetary. :-))) Something like "When everything goes up - everyone knows it and
There is no informational risk - we buy according to the principle of the biggest fool, that later a more courageous fool will come and buy even more expensive - because everyone knows that this is a trend and it will continue and continue ... That said, there is a monetary risk that the price will reverse to its ss. So "I" prefer information risks - to buy at the lower border of the channel (on the trend - down) and sell at the upper border (on the trend - up)..." :-)))
Conclusions: So now, based on chart analysis, is the best time to sell, but not to buy on the principle of the biggest fool... :-)))
Отличная идея! сам замечал, пока одни валюты во флэте (ждут..) другие отрабатывают свои цели сильными движениями.
Based on historical prices (between 0.6-3.6), I suggest that the developers of the indicator use USD\JPY, GBP\Jpy (and similar) quotes divided by 100.
- Free trading apps
- Over 8,000 signals for copying
- Economic news for exploring financial markets
You agree to website policy and terms of use

I have an idea: take 27 currency pairs (currencies such as USD, EUR,GBP,CAD,JPY,AUD,CHF,NZD) and find the average. You get a basket of world currencies.
You can clearly see that the bubble is growing until 2007. The maximum was in July 2007 and the double top was in October 2007. The trend of the index changes downwards and the bubble bursts in June 2008 (it could not break through the resistance). At this moment a triangle is being formed and the index is close to the upper resistance boundary. Since September 2010 the index has continued to rise until this day.
Here is the same index from the last 2 months which has shown an uptrend. At the moment the index is close to the high of February 18.
I ask who is interested in this index to create it as an indicator and post it here. I am not a programmer and I created it with Exel from the quotes archive for 27 currency pairs and cross rates.
The trading system is quite simple: if the index is rising, then buy all 27 currency pairs. If it is falling - sell. And it does not matter how any of the pairs is rising or falling. The overall result is not a bad profit.