Strategic foresight systems
Changed the table. Probability of a trend change on the forecast date.
- 0%- the probability that the sum of increments on the forecast horizon will change the trend is negligible, it is not strictly zero, but it can be neglected
- 50-60% trend is about to start.
- 100% the new trend (in relation to the old one), has definitely started and this figure tells almost about the missed start of the trend change. It is too late to make a decision about trend change at this moment (within the horizon of 5-7 trading days), but again it is not a fact, new data will be required.
| Date | AUDJPY | AUDUSD | CHFJPY | EURCHF | EURGBP | EURJPY | EURUSD | GBPCHF | GBPJPY | GBPUSD | NZDUSD | USDCAD | USDCHF | USDJPY |
|---|---|---|---|---|---|---|---|---|---|---|---|---|---|---|
| 21.02 | 0 | 0 | 0 | 0 | 0 | 45 | 0 | 32 | 0 | 0 | 0 | 0 | 5 | 15 |
| 22.02 | 0 | 0 | 0 | 0 | 0 | 15 | 0 | 18 | 0 | 0 | 87 | 0 | 0 | 3 |
| 23.02 | ||||||||||||||
| 24.02 | ||||||||||||||
| 25.02 |
Theoretically the system should learn, it will be interesting to see if it lies much or not.
PS: reminder, not to use for trading. In addition, I will be debugging for the first few weeks.
In other words - a kind of trajectory deviation analysis.
I do that too, I try to automate it with NS, but I'm not looking for a specific future price prediction, but only at what 1/3 of a bar the price will be at different TFs.
I'd love to see the predictions, when will be the first prediction?
I'm doing that too, I'm trying to automate with NS, but I'm not looking for a specific future price prediction, but just what 1/3 of a bar the price will be in at different TFs.
different ways, one goal :o)
i would love to see the forecasts, when will be the first one?
I will finish the identification till tomorrow and fill the table definitively. If there will be a signal, in the "deal type" field, it will show what should be done. I have taken 14 quotations because the trend durations are different, we will have to wait for some time, nothing is expected out of 5 trades on Monday.
| EURJPY | 45 | SELL | Wait 1 day maximum. Then control and trade |
Please be more specific in your forecasts, for example after 2.00 Moscow timeframe on 21.02.2011 or within 21.02.2011.
i am interested in the BBH indicator, write it down, how much you think it is enough to take a decision, maybe your forecasts will change the BBH value when approaching a new trend - i think it should be written in the first message of the topic
.....
Found one tricky thing about the behaviour of increments on large periods (actually scales) .....What is the difference between the different time variables (timeframes)?
Interesting BBH indicator, write down how much you think is enough to make a decision, maybe in your forecasts BBH value will change when approaching a new trend - I think this should be written in the first post of the topic
Right, forgot the most important thing. I use Bayesian probability nets when determining BBST. In particular, this BayesiaLab thing(http://www.bayesia.com/en/products/index.php), I'm in a hurry before the demo is over. I'm also thinking to use it for model identification with the "fundamentals" and news, as well as for searching some regularities (but it's not so easy here). I thought I would be able to build a comprehensible classifier for trading, but it has not worked so far. Understandable in the sense that normalization goes from 0 to 1 and, for example, the value 0.9 suggests that beginning of a new trend is most probable and it is time to make a decision. It cannot be explained briefly like that, but it hasn't worked out yet and the matter is not simple rationing.
Let me remind you, the accepted concept of classification assumes no flat, i.e. at the current moment there is always a trend (big/small is not important, what is important is that any trend (entry/exit) will make money for you), and the question is what to catch a change in the trend. In general, the classical problem. Following the accepted logic, we get the following "system of views":
- 0%- the probability of that the sum of increments on the forecast horizon will change the trend is insignificant, it is not strictly zero, but it can be neglected.
- 50-60% trend is about to start.
- 100% the new trend (in relation to the old one), has definitely started and this figure tells almost about the missed start of the trend change. It is too late to decide on trend change at this point (within the 5-7 trading day horizon), but again not a fact, new data will be required.
Please be more specific in your forecasts, e.g. after 2.00 MSK on 21.02.2011 or within 21.02.2011, otherwise there will be discrepancies.
All forecasts are performed for (H+L)/2 and should be interpreted relative to start and end of formal bars (candlesticks). For example, let's assume the EURJPY will fall on 21.02:
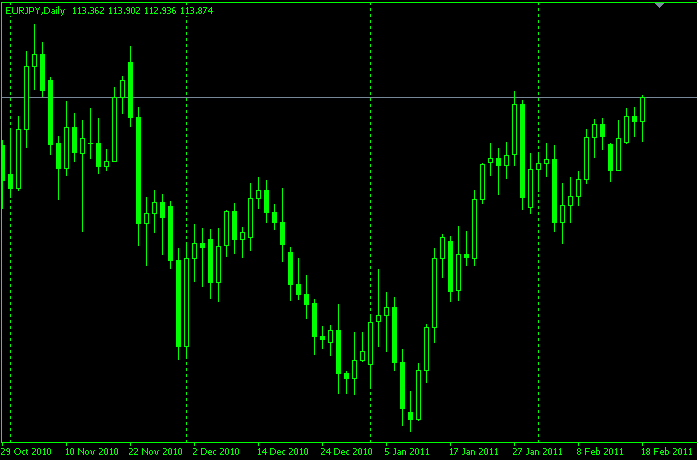
That is, the forecast will "take effect" from the beginning of Monday trading. And here it is important to enter correctly, i.e. we still need the forecast (H+L)/2 (not yet ready), and to enter above this level, otherwise there will be high drawdowns.
"After 2.00 Moscow time on 21.02.2011, there is one technical snag. The break between Friday and Monday is understandable. I manage to make my forecast during weekend and I am kind of ready for Monday. But it's more complicated on weekdays. I don't want to sit and wait for the formal trading day to be over at night according to MSK. I've decided I will wait for 23:00 Moscow timeframe, call for data, make forecasts and get results. But the value in the flow will not be fully formed and, hopefully, it won't affect me too much.
In this connection, there is a technical question. Here is my code that fetches the data for 14 quotes:
#property copyright ""
#property link      ""

extern int window=290;

int start()
{
   int i, n;
   int Handle;

   string FileName="quatation.csv";

   Handle=FileOpen(FileName, FILE_CSV|FILE_WRITE," ");

   if(Handle==-1)
   {
      Alert("");
      return;
   }

   FileWrite(Handle, "AUDJPY", "AUDUSD", "CHFJPY", "EURCHF", "EURGBP", "EURJPY",
"EURUSD", "GBPCHF","GBPJPY", "GBPUSD", "NZDUSD", "USDCAD", "USDCHF", "USDJPY");


   for(n=0; n<=window-1; n++)
   {
      double AUDJPY=(iHigh("AUDJPY", PERIOD_D1, n)+iLow("AUDJPY", PERIOD_D1, n))/2.0;
      double AUDUSD=(iHigh("AUDUSD", PERIOD_D1, n)+iLow("AUDUSD", PERIOD_D1, n))/2.0;
      double CHFJPY=(iHigh("CHFJPY", PERIOD_D1, n)+iLow("CHFJPY", PERIOD_D1, n))/2.0;
      double EURCHF=(iHigh("EURCHF", PERIOD_D1, n)+iLow("EURCHF", PERIOD_D1, n))/2.0;
      double EURGBP=(iHigh("EURGBP", PERIOD_D1, n)+iLow("EURGBP", PERIOD_D1, n))/2.0;
      double EURJPY=(iHigh("EURJPY", PERIOD_D1, n)+iLow("EURJPY", PERIOD_D1, n))/2.0;
      double EURUSD=(iHigh("EURUSD", PERIOD_D1, n)+iLow("EURUSD", PERIOD_D1, n))/2.0;
      double GBPCHF=(iHigh("GBPCHF", PERIOD_D1, n)+iLow("GBPCHF", PERIOD_D1, n))/2.0;
      double GBPJPY=(iHigh("GBPJPY", PERIOD_D1, n)+iLow("GBPJPY", PERIOD_D1, n))/2.0;
      double GBPUSD=(iHigh("GBPUSD", PERIOD_D1, n)+iLow("GBPUSD", PERIOD_D1, n))/2.0;
      double NZDUSD=(iHigh("NZDUSD", PERIOD_D1, n)+iLow("NZDUSD", PERIOD_D1, n))/2.0;
      double USDCAD=(iHigh("USDCAD", PERIOD_D1, n)+iLow("USDCAD", PERIOD_D1, n))/2.0;
      double USDCHF=(iHigh("USDCHF", PERIOD_D1, n)+iLow("USDCHF", PERIOD_D1, n))/2.0;
      double USDJPY=(iHigh("USDJPY", PERIOD_D1, n)+iLow("USDJPY", PERIOD_D1, n))/2.0;

      FileWrite(Handle, AUDJPY, AUDUSD, CHFJPY, EURCHF, EURGBP, EURJPY, EURUSD, GBPCHF,
GBPJPY, GBPUSD, NZDUSD, USDCAD, USDCHF, USDJPY);
   }

   FileClose(Handle);

   return(0);
}
Sampling comes from zero, but how would I make it select 290 bars, but only for finally formed bars? I can't figure it out.
And what is the difference between the different time variables (timeframes)?
I must have put it in a bit of a funny way. I meant the following. There is a certain scale at which some special characteristics of a time series can manifest themselves. These characteristics relate to features (properties) of trajectories, or more precisely, their deviations. I.e. behavior of some statistics on fixed time windows. If we take, for example, duration of 17 minutes (just as an example), then there is nothing on this scale - it is very difficult, almost impossible to predict where the trajectory will deviate in 17 minutes. But on larger scales there is a possibility, well ... it seems to be there. One has to check it :o)
That's what I meant.
You can tell me off right away, but I wondered if I might add something...
- Free trading apps
- Over 8,000 signals for copying
- Economic news for exploring financial markets
You agree to website policy and terms of use
Purpose of the branch
The system basis
I've found one tricky feature of increments behavior at larger periods (in fact, scales), so I will try to use it. In other words - a kind of trajectory deviation analysis.
Limitations
Trading
A reminder (just in case)
I'm sure my colleagues have the wisdom not to use these predictions for real trading. If the author didn't test it on a micro account, then there's no need to "hurry".