Mashki and I. Captured by illusion...
And since it's not a word...
Decided on the "testing ground" quickly.
EURUSD 18/02/2009-11/01/2010
I borrowed a script to simplify the data preparation.
I got a sample length of 5488 observations. I have started to look at it.
But first I will describe the variables/coordinates.
F - price at the extremum of 33 (zigzag) in the nearest future on H4. (Perfect exit or estimate invented by the author of the script - I do not go further... FC - ideal profit and it is needed for markup).
M15 - value of moving average with period 15, and M15-O - deviation of opening price.
M100 is the same, but with a period of 100.
ZZ is the price value on the last knee of 33, but on the H1 period and without "looking ahead".What do we see at once?
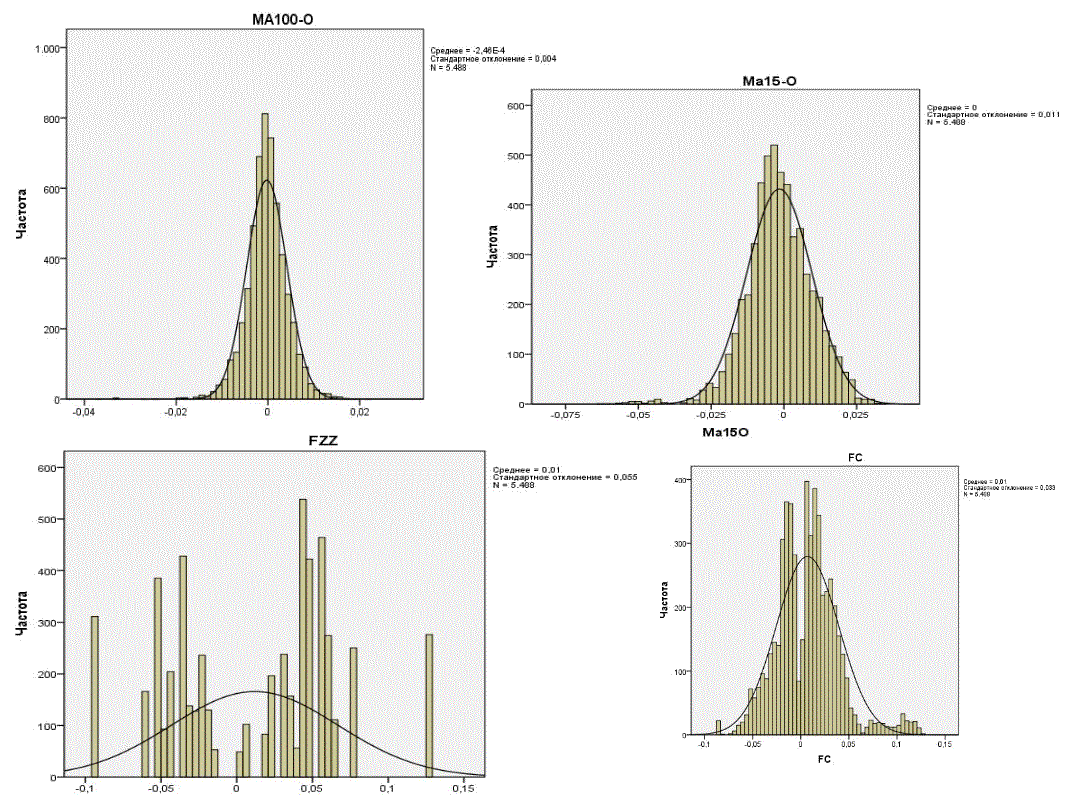
We see that "average" deviations will not disappoint.
Now we should separate the wheat from the chaff.
Separate the observations into "reversals" and others.
Who's thinking on a separation algorithm?
Help me solve my "homework".
Or let me copy it.
;)
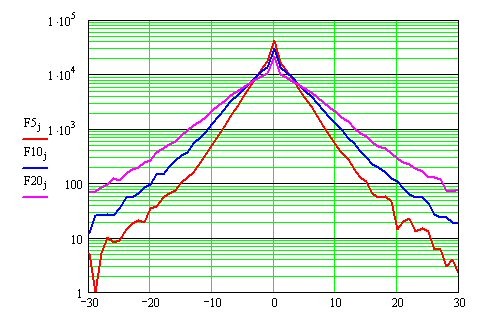
Не, Sorento, не ведёт себя эта величина нормально на разных ТФ:
Распределения построены для сглаживания по 5, 10 и 20 отсчётам m1 пары EURUSD.
Thanks for the info.
I'll look at the self-similarity on the smaller TFs later too.
But the watches are deliberately chosen because of their "good" volatility.
And remembering the sliding frequency suppression I thought the 15 and 100 periods were interesting.
In order to use this distribution as a signal for a reversal, you must 1) build it dynamically and 2) have a change in this picture that is identifiable.
П. 2) can be left aside for the moment. What about item 1)? Without it there is no way, what kind of signal can a static picture give?
In order to use this distribution as a signal for a reversal, you must 1) build it dynamically and 2) have a change in this picture that is identifiable.
П. 2) can be left aside for the moment. What about item 1)? Without it, what kind of signal can a static picture give ?
3) Which sliding window to choose to identify this distribution? A dependence on the Mach period is suggested.
This hypothesis should be investigated. ;)
It has been approached a thousand times on this forum. Here I have dared.
Undoubtedly.
I'm sure there will be separation, although I'm not sure if it can be used. At the moment of turning, the lag of the Mach is at its maximum. This leads to the spread having a fat tail. And the difficulty is that for this thick tail, there is no measure by which you can say that it's all over, the spread. However thick it may be, it can get even thicker. Alas.
3) What sliding window to choose to identify this distribution. A dependence on the Mach period suggests itself.
Undoubtedly.
I'm sure there will be separation, although I'm not sure if it can be used. At the moment of turning, the lag is at its maximum. This leads to the spread having a thick tail. And the difficulty is that for this thick tail, there is no measure by which you can say that it's all over, the spread. However thick it may be, it can get even thicker. Alas.
Not necessarily a tail. If there was a trend before the reversal, the residuals may be normally distributed, but with a shifted MO (price has been on one side of the swing for a long time). However, it will not follow that if this distribution is identified, there will be a reversal. It may well be a continuation of the trend. In short, we should look for the distribution or its individual properties that precede the reversal but not the trend continuation.
But most likely, it will turn out that before the reversal, there is a flat or incomprehensible (sometimes a trend and sometimes a flat - the average temperature at the hospital) - the HP of the residuals with mo close to zero
- Free trading apps
- Over 8,000 signals for copying
- Economic news for exploring financial markets
You agree to website policy and terms of use
I once said (with a clever look) - let's see how the price behaves around the moving average?
What if it's normally distributed in a trend and flat, and when there are reversals the characteristics change...
"Come on" - the gurus say (apparently knowing the answer:)...
That's the way I got it.