Correlation of indicators
Я бы все-таки определял коррелированность индикаторов с учетом их полезных свойств - то есть обрабатывать не сами индикаторы, а их сигналы (например, "сиди кури", "покупай", "продавай", "стоп"). Тогда можно четко сформулировать коэффициент корреляции математически.
What if the indicator signals are not discrete but continuous? Say, if their readings change from -1 to 1 (we are not talking about oscillators), would it be possible to calculate?
I would still determine the correlation of indicators taking into account their useful properties - i.e. to process not the indicators themselves, but their signals (e.g. "sit smoking", "buy", "sell", "stop"). The correlation coefficient can then be clearly formulated mathematically.
So first you have to convert the indicator signals into a "binary" system, such as: 1-buy, 0-wait.
In my opinion, there are 2 ways:
1 - the way that programmers choose - testing on the history;
2-nd - the way of mathematicians - mathematical description, which could be used in the making of your own indicator.
So, first you have to convert the indicator signals into a "binary" system, such as: 1-buy, 0-wait.
In my opinion, there are 2 ways:
1 - the way that programmers choose - testing on the history;
2 - the way of mathematicians - mathematical description, which could be used in the construction of their own turkey.
Then not in binary, but in ternary. Buy, sell, wait.
That's if there is only one indicator. And if there are two - one to buy, the other to sell. In any case, it is different for everyone.
In general, switching to the 2-nd, 3-rd or 4-th system will strongly sober the lovers of the "standard" indices. It becomes clearly visible
the "quality" of their work at all their settings.
How many talks such as "when will this chart cross this stochastic.... from the bottom to the top" or "Fibonacci grid is built like this...", but here
it's easy to see that nothing works :)))
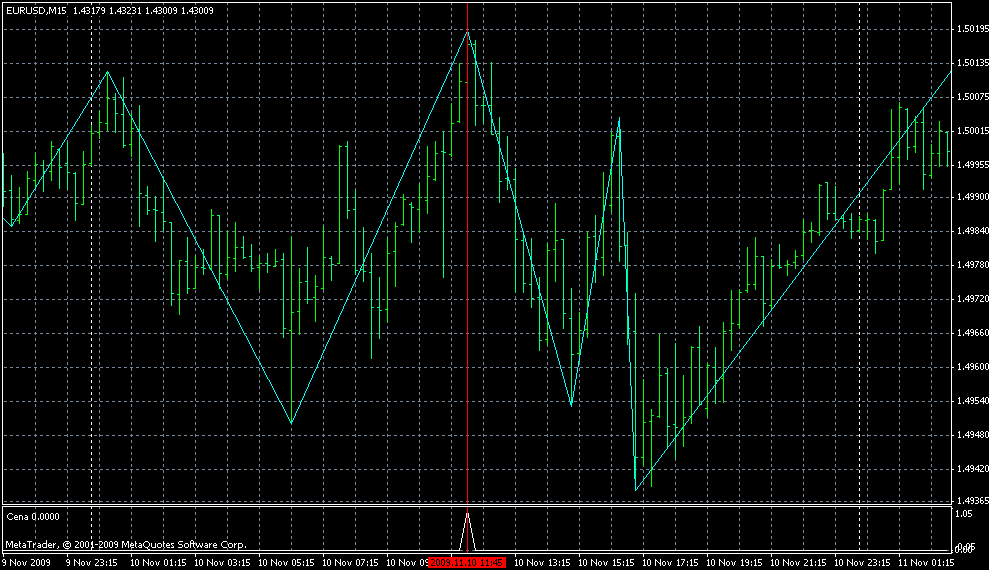
Here's what a good indicator should look like, clearly and distinctly showing where to sell, without all the "crossovers":
-
Значит, сначала необходимо перевести сигналы индикаторов в "двоичную" систему, типа: 1- покупать, 0- ждать.
На мой взгляд тут 2 пути:
1-й - путь, который выбирают программисты - тестирование на истории;
2-й - путь математиков - математическое описание, которое можно было бы использовать при изготовлении своего индюка.
I would say path 1 is the path of analysis, for which there are theoretical tools - probability theory, matstatistics, and others. In principle, a technical grasp of their apparatus is enough to carry out this very analysis. The 2nd way - to create a mathematical model, which could be used to stamp indicators with given correlation characteristics - is a synthesis way, it is non-trivial and almost impossible to formalize, in fact, only irrational thinking and intuition can help here, which, if you like, is a communication with the space:)
There is one more problem with the correlation. Suppose we have a big history - the watch since 1999.
Suppose further that our goal is as simple as a basin: to investigate the correlation of two simple flies with periods of 7 and 13. Not even the signals (which here are taken only from the interaction of the wands), but the rows of the indices themselves.
Of course, we are not going to count this correlation on the whole story. We are not interested in such a correlation because it does not reflect the current moment. We need to determine the window within which to calculate this correlation. It may be 10 bars or 100. What criteria should we use to determine this window?
- Free trading apps
- Over 8,000 signals for copying
- Economic news for exploring financial markets
You agree to website policy and terms of use
Richie, you promised to frighten everyone with a new question today - hurry up, before the scientific community gets excited :)))
Happy Holidays, everyone!
-
No, I don't want to scare anyone, I think it has "matured", I have many questions but this one has not matured yet, I still need to think about it. However, I'd like to raise an important question, in my opinion, that was pointed out by Vinin yesterday:
I wonder how to take into account the correlation of indicators. All indicators are price dependent, it's just the processing algorithm may be different in each of them.
But the correlation is not going anywhere.
So my question is: how to determine to what extent the indicators are "correlated". This is the continuation of yesterday's topic about correlation of indicators, because I was accused of not taking into account many things and this is true. I think it is clear, that I'm not speaking about "two waves with periods of 51 and 52" figuratively speaking.
Who has any opinions on this, it would be interesting to hear from mathematicians.....