To follow up
>> who would look at this avatar and think there's something human behind it?
In fact, I'm even scarier on the inside...
But you should put it in the database, it gets lost here, and it's an interesting thing.
You'd think it wouldn't get lost in there. Here, at least versions can be added every five minutes. With corrections and innovations. And then there's the fluffing.
Why not make the same template in kodobase as in the branches? It's a mystery. And not for me alone, judging by the forum.
In fact, I'm even scarier on the inside...
You'd think it wouldn't get lost in there. Here, at least versions can be added every five minutes. With corrections and innovations. And then there's the fluffing.
Why not make the same template in kodobase as in the branches? It's a mystery. And not for me alone, judging by the forum.
Respect!
And respect! ;)
I told you "beauty will save the world" ....
Thanks for the lovely turkey.
And what is the "slippage" of this zigzag? The slope is the ratio of the average amplitude of a segment of the zigzag at the time of its registration to the average amplitude of the completed segments.
It is possible to calculate - all the data is in the code. But what for? It is possible to see where the extrema are and where they are really determined by time: the parameter ShowZigZag (1 - where, 2 - when).
Otherwise... this "slip" parameter is purely an academic one, IMHO. No one is going to go long by, say, the trough detection. Rather the opposite (that's how it is done), if the context requires it.
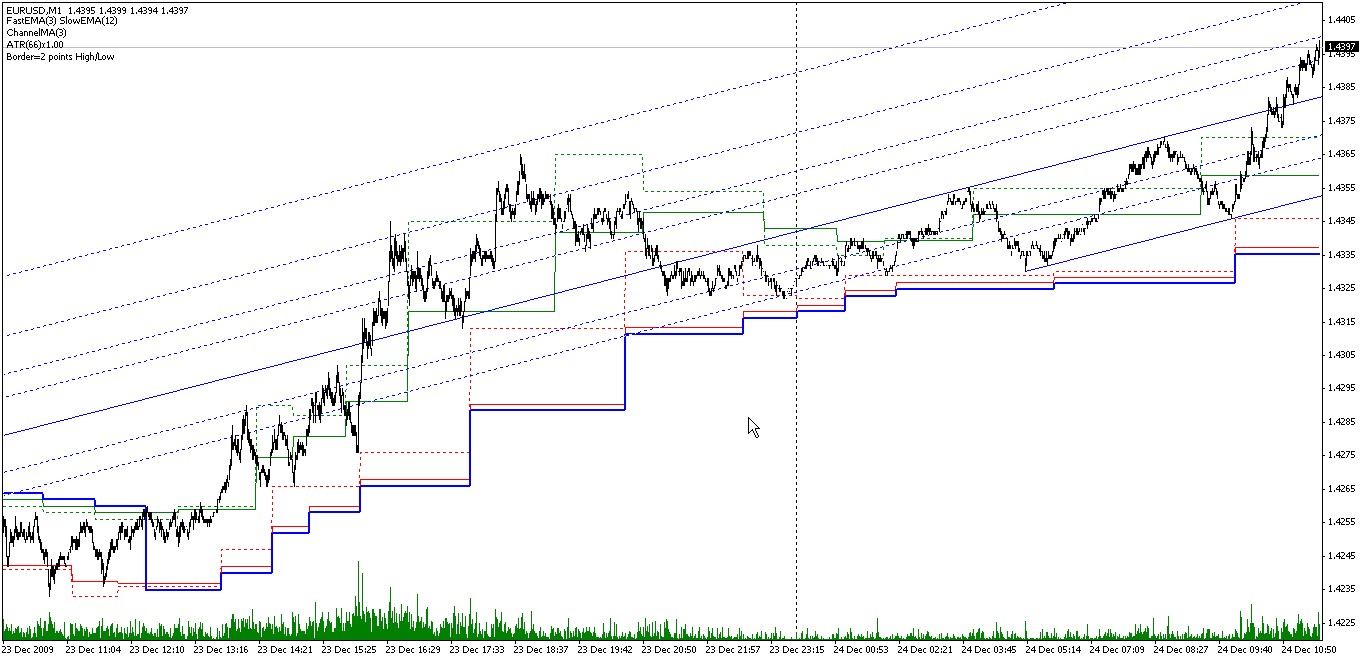
Well look, here is the last picture today from the Eurobucks on the minutes. The channel is displayed as it is, as it is drawn in real time, i.e. by the time of identification of extrema. It is clear that it would be logical to go long (obviously, the context is long) during the periods after the definition of the peaks (change of the upper divergence of the channel) aiming at some minor oscillator in particular. And not vice versa.
But it is possible, I repeat, to calculate. Do you have to?
===
Then this parameter will be different for different input parameters of the indicator. It is one thing to use 3, 12, and another to use 1, 7. We may use shifted ones as well. Is it possible to display the average slope in the buffer in the real time mode? It is possible. I'm not sure if that would be necessary. Although... Yes - you can sort of estimate when to go in. But it would be so inaccurate that it would be a pain in the ass. No. I don't think so.
It can be calculated - all the data is in the code. But what for?
I have formulated a sort of theorem for myself: For any (liquid) market, for any zigzag, the average slippage will be about 1/2. It can hardly be proved, but a single fact would suffice to disprove it. So my interest, and rightly so, is rather academic :) .
Exactly this "theorem" says, that "straight" and "the other way round" depend on the context in equal measure, imho.
And no, I think that 1/2 will be for any set of parameters and even for any zigzag :)
Outputting the average slippage to the buffer in real time?
I usually sum up the data on the fly and output it to Comment (divided by the counter, of course).
Context detection is of course a separate topic, and much more interesting :). Are you able to formalize this procedure? That is, is brown bear cosmetology an exact science? :)
I have formulated a kind of theorem for myself: For any (liquid) market, for any zigzag, the average slippage will be about 1/2. It can hardly be proved, but a single fact would suffice to disprove it. So my interest, and rightly so, is rather academic :) .
Well... if that's the case, of course. Although, you know, I've been thinking - it may not be academic. Anyway, I'll think about it, OK?
It's just this "theorem" that says "straight" and "in reverse" are quite equally dependent on context, imho.
And no, I think 1/2 will be for any set of parameters and even for any zigzag :)
In the limit? Greetings Marquis de Lopital.))) Probably. Only from a practical point of view all this BP consideration in general is an evergreen cactus with its mice.
I usually summarize the data on the fly and display it in Comment (divided by the counter, of course).
You can do it this way too. But you can't count it later from the comments. That's why I mentioned buffer.
Defining context is a separate topic and much more interesting :). Is it possible to formalise this procedure? That is, is brown bear cosmetology an exact science? :)
А... that's what you mean! >> Yeah, yeah. >>)) Formalized... yes, of course. And not yesterday. But it's really a very separate topic. You know, you can't even do an article here. Although, this thread, maybe, will do. On this sporadic, but has repeatedly written in various other branches. In general terms, of course, wrote - it would be strange to detail there. But here, sort of as a follow-up... Yes, I think I'll write slowly. Non Time Frame or Non Fiction, yeah.)) Although, if you look into it, there's nothing new I could say that anyone wouldn't know. Such is the paradox.)))
===
Generally speaking, a "catch-up" is probably a good idea. It is possible to collect in one place what was occasionally mentioned, written about, etc. // My posts, like precious wines, will have their turn. ("Scattered in the dust of shops..." Akhmatova)
Well, I certainly won't die of modesty. That's good. )))
Well... if that's the case, sure. Although, you know, I've been thinking - the interest may not be academic. Anyway, I'll think about it, okay?
At the limit? Hello, Marquis de Lopital.) Maybe. Only from a practical point of view, all this BP consideration in general is an evergreen cactus with its mice.
You can do it that way. Only you don't count from the commentary afterwards. That's why I mentioned the buffer.
1 If it were urgent, I would add the code and calculate it myself :)
2. 2. In the limit.
3. If the indicator is fast - it is easier to recalculate it, if it is slow - it is better to put it directly into a file.
But if it's really "maybe not academic", I'd listen.
А... that's what you mean! Yes, yes.)) Formalization has succeeded... yes, of course. And not yesterday. But it's really a very separate topic. You know, you can't even do an article here. Although, this thread, maybe, will do. On this sporadic, but has repeatedly written in various other branches. In general terms, of course, wrote - it would be strange to detail there. But here, sort of as a follow-up... Yes, I'll probably write slowly. Non Time Frame or Non Fiction, yeah.)) Although, if you look into it, there's nothing new I could say that anyone wouldn't know. >> That's the paradox.)
Interesting, interesting. Although I confess I have some initial scepticism.
By the way, real formalisation means being able to test on history, have you done that?
- Free trading apps
- Over 8,000 signals for copying
- Economic news for exploring financial markets
You agree to website policy and terms of use
I had a CodeBase entry on zigzags and horizontal channels on different indices. Recently one person wanted a Zigzag on a cross of two MAs, which he said publicly on the forum. It is not a difficult thing to do - just tweak the ready-made one and it is done. The foxy thing is that he corrected ZigZag based on the unknown for me indicator and asked to do it. I declined. I do not like poking around in other people's codes, I would like to understand some of my own codes. Then, feeling a certain responsibility for what I've cobbled together/published, as well as some discomfort resulting from the refusal to help, I decided to make an indicator that can do the following:
Let me explain the principle of identifying price peaks/troughs (extremums). The image (1) shows two EMAs - fast and (can you guess three times) - correctly, slow. The areas between the crossovers are marked in green and red, respectively for peaks and troughs. That is where they are searched for. In general, use of two MAEs allows a rather flexible approach to identification of extrema.
For example, DiNapoli practises using DMA - displaced prime MAs (someone showed it to him - just like Don Juan's teachings). Is it possible to search for extrema by DMA using this indicator? Shit question (sn.2). We set the period value of the fast MA = 1 and the period and offset of the slow MA =3 and obtain extrema identified by crossing the price of bar closing by a 3-bar simple MA shifted by 3 bars. It seems to me that besides the above mentioned 3 by 3, Joe uses 7 X 3 and 25 X 5 displaying MAKs. You could just use the intersection of the MA and its replica offset by whatever bar (sn.3) - sort of like the ACF. In the end, one can simply put the MAA period values for the class. (12.26) or DiNapoli's (8.17) (sn.4) MACD and feel happy to be involved in other people's nonsense.
The horizontal channel is built using the extrema found (sn.5). If we set the channel smoothing period greater than 1, the raw channel will remain in the form of dashes, while the smoothed one will be drawn as solid lines (fn.6 - smoothing period =3).
The trend line (fn. 6) is drawn as either support under the prices for a rising trend, or as resistance over the prices for a falling trend. The falling/rising condition is determined by breaking through the corresponding channel edge or closing price of the bar, or its High/Low. The channel boundary may be moved by a certain value in pips or by the ATR (parameter Border) in order to prevent the channel boundary from being broken through by a noise spike.
Well, corrections (сn.7) and extensions, as well as the equidistant channel, are clear without any explanation. For the Fibo channel I have made some changes in the default levels - otherwise there is not much sense in it, IMHO (fn. 8).
More details on the input parameters:
// MAC parameters
FastMA - period of the fast МА.
SlowMA - period of a slow MA.
SlowMAshift - shift of a slow MA.
Method - smoothing algorithm.
// trigger threshold
ATR - period of ATR for adaptive sensitivity.
xATR - multiplier for ATR value.
Sens - sensitivity in points.
// horizontal channel
ChannelMA - period of channel borders smoothing.
Border - indent in points from the channel borders. Used for determining the channel breakdown. Less than zero - the maximum value between the Zigzag sensitivity by ATR and the modulus of the entered parameter is selected.
// what the hell to cue! (0 - don't show shit).
ShowTrend - 1 - show trend determined by breakdown of the channel borders HIgh/Low bar; 2 - Close.
ShowChannel - show horizontal channel by position of extrema; 2 - by time of their determination (by the moment of fixing the MA MA crossing).
ShowZigZag - 1 - show ZigZag by the positions of extrema; 2 - by the time of their determination.
ShowFibo - 1 - show Fibo correction; 2 - Fibo extensions; 3 - Fibo channel; 4 - equidistant channel.
===
Kind of out of place in the kodobase - everything is secondary, but it's a shame if it goes away. So to follow up. There will be more on stochastics here. Later.