entrance point - page 6
You are missing trading opportunities:
- Free trading apps
- Over 8,000 signals for copying
- Economic news for exploring financial markets
Registration
Log in
You agree to website policy and terms of use
If you do not have an account, please register
I don't think it's very accurate to talk about signal independence at all. Only in theory. Signals of Expert Advisors can be independent if the data on which they work is independent. For example, one Expert Advisor is classical, another one is based on the stars, the third one on folk omens). But when using different TA strategies on the same data, the independence will not be possible. And how to count what is a big question. But in any case there is no big use in unreasonable to lump several strategies into one pile.
I can tell you what I mean by convergence. I'm talking about so-called convergence of Advisors, by the way, slightly tested by me manually. That is, the methods rule here, but the selection of one advisor should be more efficient.
Three independent signals in the same time interval and often is a grail. :о)
Now I would be very grateful if someone could tell me how to do it better through a magician and how many of them can be attached to the chart or combined into one or something else - the best option, and I'll deal with it directly all just no insults and discontent just need a little help
Based on the starting post, "sequential".
I'm personally more interested in how Arthur distinguishes between right inputs and wrong inputs ( specific wording )
I'm kind of stuck on something. Yes, at first glance it looks like a series connection.
But then the corresponding problem would also sound like this: "There are three resistors connected in series. The resistors have a reliability of 0.55, 0.65, 0.75. What is the probability that the circuit will not glitch (the resistors pass a non-zero current through them)?". And its solution is the same as Arthur's. Well then I don't understand something...
P.S. But with parallel connection the answer is like mine: the probability that the circuit will glitch is equal to the probability that all three resistors will fail simultaneously, i.e. 4% (this is the principle of redundancy of unreliable elements).
It turns out that the resistors have to be wired differently than they appear.
It turns out that the resistors have to be connected differently than they seem.
Hi, Alexey.
It's easier to play the Monte Carlo problem.
So, we were interested in the answer to the question of how the forecast reliability P changes with the growth of the number N of indicators used. The calculation was conducted for any number of indicators that don't correlate to each other and have the same probability p of each correct prediction in the series. The graph shows the results of numerical modeling of forecast reliability at simultaneous operation of all indicators for p=0.5 ... 0.7 I think that in practice it's impossible in the long run to get p=0.55 and more from the forecast reliability indicator, that's why the case with p>0.6 is of academic interest only.
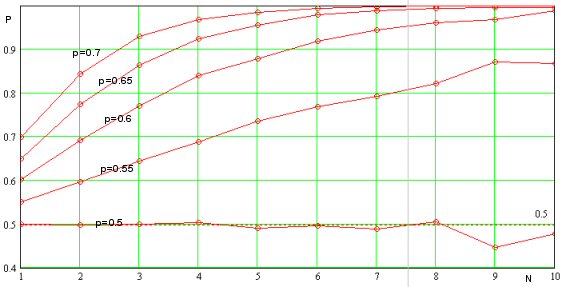
We can note that prediction reliability increases with increasing number of non-correlated indicators (see fig.). In this sense, it is useful to pre-evaluate the independence of signals of applied indicators and try to use them. On the other hand, any indicator that uses historical price data for signal generation is a priori dependent. Therefore, we should try to use the indicators on different timeframes, it will reduce the correlation of signals, at least to some extent.
At first approximation we can consider that p increases almost linearly with the number of used indicators (see fig. above). In its turn, the probability of the simultaneous operation of n indicators exponentially decreases as the number of indicators increases and it means that the frequency of trades will also decrease rapidly. Thus, we have two competing processes: the profitability and the frequency of trades. The first one grows linearly, while the second one exponentially decreases with the growth of the number of indicators. This fact should be kept in mind, because at the number of indicators greater than a certain number, the effectiveness of TS will begin to decrease dramatically. It is interesting to find the optimal number of indicators, for example, for the predictive probability of each p=0.55, see fig.
The conclusion is the following: the use of two independent indicators will give in general a worse result at the section with the number of trades >10 (for the statistical significance), than when using one! It is associated with a sharp decrease in the frequency of entering the market. With dependent indicators the situation is even worse. So, it is better to use a single indicator, and if there is a choice, it must be the most reliable indicator of all, even at the expense of the frequency of transactions.
Hi Alexey.
It is easier to play the Monte Carlo problem.
So, we are interested in the answer to the question of how the forecast reliability P changes with the increase of the number N of indicators used. The calculation has been performed for any number of indicators that do not correlate to each other and have the same probability p of each correct prediction in the series. The graph shows the results of numerical modeling of forecast reliability at simultaneous operation of all indicators for p=0.5 ... 0.7 I think that in practice it's impossible in the long run to get p=0.55 and more from the forecast reliability indicator, that's why the case with p>0.6 is of academic interest only.
We can note that prediction reliability increases with increasing number of non-correlated indicators (see fig.). In this sense, it is useful to pre-evaluate the independence of signals of applied indicators and try to use them. On the other hand, any indicator that uses historical price data for signal generation is a priori dependent. Therefore, we should try to use the indicators on different timeframes, it will reduce the correlation of signals, at least to some extent.
At first approximation we can consider that p increases almost linearly with the number of used indicators (see fig. above). In its turn, the probability of the simultaneous operation of n indicators exponentially decreases as the number of indicators increases and it means that the frequency of trades will also decrease rapidly. Thus, we have two competing processes: the profitability and the frequency of trades. The first one grows linearly, while the second one exponentially decreases with the growth of the number of indicators. This fact should be kept in mind, because at the number of indicators greater than a certain value, the effectiveness of TS will begin to decrease dramatically. It is interesting to find the optimal number of indicators, for example, for the predictive probability of each p=0.55, see fig.
The conclusion is the following: the use of two independent indicators will give in general a worse result at the section with the number of trades >10 (for the statistical significance), than when using one! It is associated with a sharp decrease in the frequency of entering the market. With dependent indicators the situation is even worse. So, it's better to use the only one indicator, and if there is a choice, it must be the most reliable indicator of all, even to the detriment of the frequency of deals.
Would you estimate reliability of the forecast if you consider not the simultaneous operation of the indicators, but their operation in a certain time interval? For example, if 1 indicator has triggered on bar 4, 2 indicators - on bar 2 and 3 - on bar 1, then we should enter the market.
sorry I was away for a while drinking beer and missed a lot when I said that the exit is easy I meant to take the maximum possible profit or close to it but it does not help if you enter the market do not understand how (according to you FOREXMASTER is not important) and immediately catch a los) to my mind you just do not know what you are talking about
If you don't understand what you're talking about, you just don't understand what you're talking about :), a buy/sell trade can be opened on every tick, knowing where the price will change and closing with a profit (the spread would allow it).
fate писал(а) >>
-----------------------------------------------
nkeshka wrote:>>
Three undependable signals in the same time span and often is a grail. :о)
-------------------------------------
Now I would be very grateful if someone could suggest how to do it better through a magician and how many of them can be attached to a chart or combined into one or something else - the best option, and I'll deal with it deeply.
do you even know what the word grail means? =)
Can you estimate the reliability of the forecast if you consider not the simultaneous triggering of the indicators, but their triggering in a certain time interval? For example, if 1 indicator has triggered on bar 4, 2 on bar 2 and 3 on bar 1, then we should enter the market.
Here's how it works. You somehow estimate the time interval (in bars, for example) during which the indicator readings are accepted by MTS. Then the signal for the opening will be a hitting in one interval of signals from all indicators. Suppose the profitability of your TS at one-time signal of all indicators - n points/transaction, then at the widening of the registration interval up to N-bars, the price "will leave" the optimal entry point at dV=Volatility*SQRT(N) points, where Volatility - volatility (points/bar) of the instrument in the selected TF. The real profitability of the trade will decrease by the value of dV and will be nr=n-Volatility*SQRT(N) points/transaction.
How to get "forecast reliability" from this I don't know, but I think that estimate through profitability is representative.
P.S. This fact, by the way, shows why "slippage" is always to DC's advantage, although, it would seem, slippage can also be in player's favour... However, a player is oriented on the optimal entry point and any drift up or down will bring losses to a trader and profits to a brokerage company.
So this is not complicated arithmetic!
This is how it works. You estimate the time interval (in bars, for example) during which the indicator readings are accepted by MTS. Then, the signal to open will be a hit in one interval of signals from all indicators. Suppose the profitability of your TS at one-time signal of all indicators - n points/transaction, then at the widening of the registration interval up to N-bars, the price will "depart" from the optimal entry point by dV=Volatility*SQRT(N), where Volatility - the volatility of the instrument on the selected TF. The real profitability of the TS will decrease by the value dV and will be nr=n-Volatility*SQRT(N).
I don't know how to get "prediction reliability" from it, but I think the evaluation through profitability is representative.
When you concluded that "application of two independent indicators will give the worse result", was it supposed that the time interval, in which these indicators were activated, is equal to zero? If so, it is clear that the probability of such an event is very small and of only theoretical interest. In practice we need to assess the reliability of the prognosis exactly in some time interval!
time interval !
No it isn't.
A finite time interval not equal to zero is assumed. In this case, the probability that all indicators will work is equal to the product of the probabilities for each of them to work in time tau( it decreasesexponentially fast with increasing number of indicators).
No it isn't.
A finite time interval not equal to zero is assumed. In this case, the probability that all indicators will work is equal to the product of probabilities of each of them to work for time tau (it decreases exponentially fast with the growth of the number of indicators).
Depending on the degree of closeness of the points, you can output a coefficient, for example, it would help more. When I was testing by hand, on a strong trend (H4) 6 EAs with -6+6 (bars) difference showed entry points and vice versa, not on the trend of the period even 2 did not coincide with the interval (-6+6) and there is nothing to reason about it, I checked and made sure of that potential grail